Del Mar, CA Investment Properties for Sale
Browse homes for sale and investment properties in Del Mar, CA. Refine your search by price, property type, or more.
Best cash flowing properties in Del Mar, CA
Active
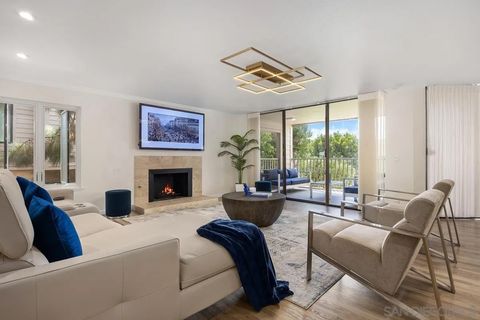
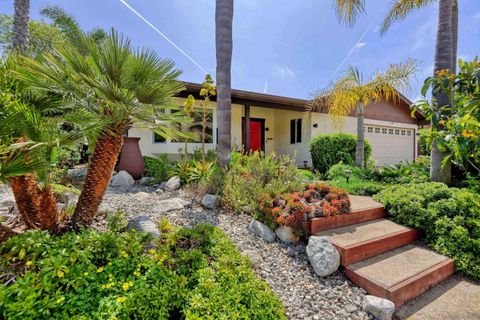
$1,398,000
2
bds
|
2
ba
|
1,232
sqft
|
built
1975
290 Dolphin Cove Ct, Del Mar, CA 92014
$-4,068
Cash flow
-15.2%
Cash-on-Cash Return
2.6%
Cap rate
0.4%
Rent to Value Ratio
Active
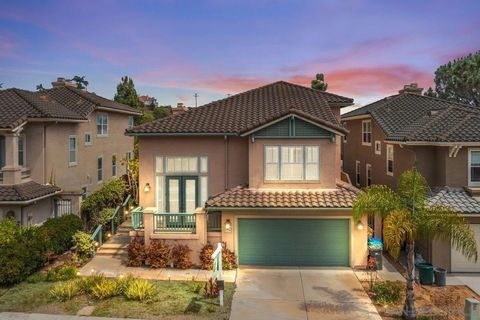
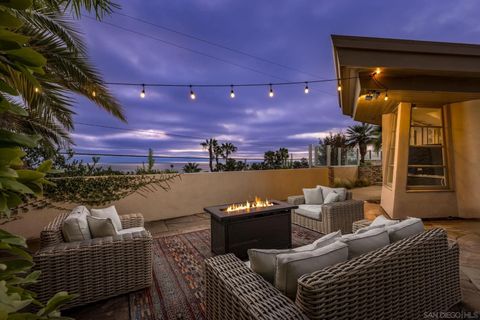
$2,100,000
4
bds
|
3
ba
|
2,353
sqft
|
built
1996
15793 Caminito Cantaras, Del Mar, CA 92014
$-5,245
Cash flow
-13.0%
Cash-on-Cash Return
3.1%
Cap rate
0.4%
Rent to Value Ratio
16 out of 40 properties for sale in Del Mar, CA
Limited Results Shown
Create a free account, or log in to reveal all property listings and enjoy the complete experience.
Active
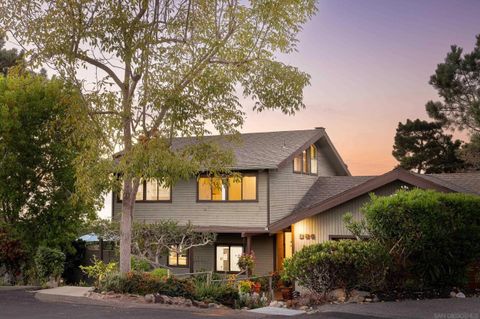
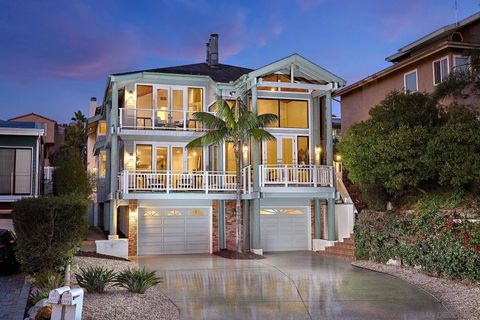
$4,750,000
4
bds
|
2
ba
|
2,327
sqft
|
built
1970
364 Bellaire St, Del Mar, CA 92014
$-17,809
Cash flow
-19.6%
Cash-on-Cash Return
1.6%
Cap rate
0.2%
Rent to Value Ratio
Active
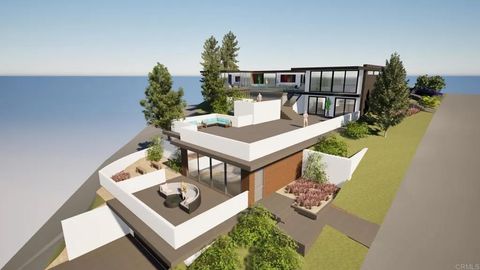
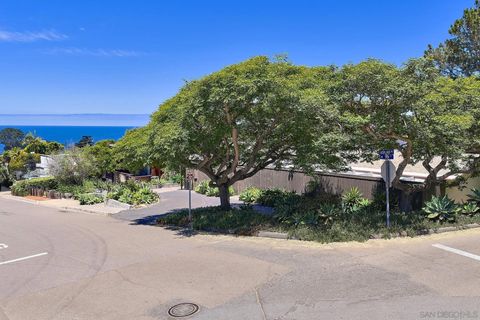
$4,998,000
3
bds
|
2
ba
|
2,000
sqft
|
built
1965
2029 Balboa Ave, Del Mar, CA 92014
$-19,132
Cash flow
-20.0%
Cash-on-Cash Return
1.5%
Cap rate
0.2%
Rent to Value Ratio
Active
$2,150,000
3
bds
|
2
ba
|
1,665
sqft
|
built
1970
13595 Calais Dr, Del Mar, CA 92014
$-6,525
Cash flow
-15.8%
Cash-on-Cash Return
2.4%
Cap rate
0.3%
Rent to Value Ratio
Active
$4,995,000
3
bds
|
4
ba
|
2,166
sqft
|
built
1999
1722 Seaview Ave, Del Mar, CA 92014
$-17,529
Cash flow
-18.3%
Cash-on-Cash Return
1.9%
Cap rate
0.2%
Rent to Value Ratio
Active
$4,900,000
5
bds
|
4
ba
|
3,968
sqft
|
built
1989
13765 Condesa Dr, Del Mar, CA 92014
$-18,636
Cash flow
-19.8%
Cash-on-Cash Return
1.5%
Cap rate
0.2%
Rent to Value Ratio
Active
$4,495,000
8
bds
|
4
ba
|
3,710
sqft
|
built
1958
914 Highland Ave, Del Mar, CA 92014
$-18,451
Cash flow
-21.4%
Cash-on-Cash Return
1.1%
Cap rate
0.1%
Rent to Value Ratio
Active
$5,495,000
4
bds
|
5
ba
|
4,090
sqft
|
built
2003
12927 Via Grimaldi, Del Mar, CA 92014
$-22,335
Cash flow
-21.2%
Cash-on-Cash Return
1.2%
Cap rate
0.1%
Rent to Value Ratio
Active
$2,650,000
3
bds
|
3
ba
|
1,668
sqft
|
built
1974
13132 Caminito Mar Villa, Del Mar, CA 92014
$-9,575
Cash flow
-18.9%
Cash-on-Cash Return
1.7%
Cap rate
0.2%
Rent to Value Ratio
Active
$6,495,000
4
bds
|
5
ba
|
3,880
sqft
|
built
2007
404 Pine Needles Dr, Del Mar, CA 92014
$-25,873
Cash flow
-20.8%
Cash-on-Cash Return
1.3%
Cap rate
0.2%
Rent to Value Ratio
Active
$2,685,000
4
bds
|
4
ba
|
2,304
sqft
|
built
1972
14058 Mira Montana Dr, Del Mar, CA 92014
$-8,126
Cash flow
-15.8%
Cash-on-Cash Return
2.4%
Cap rate
0.3%
Rent to Value Ratio
Active
$10,150,000
4
bds
|
5
ba
|
3,709
sqft
|
built
2005
354 Ocean View Ave, Del Mar, CA 92014
$-44,286
Cash flow
-22.8%
Cash-on-Cash Return
0.8%
Cap rate
0.1%
Rent to Value Ratio
Active
$2,299,999
5
bds
|
3
ba
|
2,193
sqft
|
built
2005
13349 Portofino Dr, Del Mar, CA 92014
$-5,282
Cash flow
-12.0%
Cash-on-Cash Return
3.3%
Cap rate
0.4%
Rent to Value Ratio
Active
$2,098,000
3
bds
|
3
ba
|
2,150
sqft
|
built
1985
13563 Caminito Carmel, Del Mar, CA 92014
$-6,316
Cash flow
-15.7%
Cash-on-Cash Return
2.5%
Cap rate
0.3%
Rent to Value Ratio

Active
$18,000,000
5
bds
|
5
ba
|
2,100
sqft
|
built
1988
2050 Ocean Front, Del Mar, CA 92014
$-84,256
Cash flow
-24.4%
Cash-on-Cash Return
0.5%
Cap rate
0.1%
Rent to Value Ratio