Delray Beach, FL Investment Properties for Sale
Browse homes for sale and investment properties in Delray Beach, FL. Refine your search by price, property type, or more.
Best cash flowing properties in Delray Beach, FL
Active
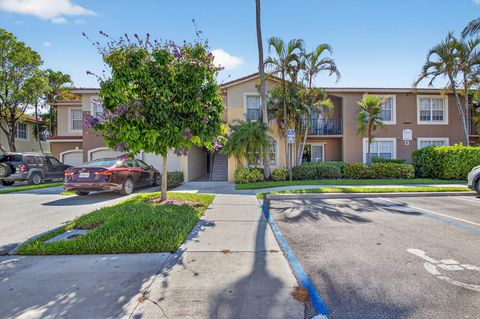
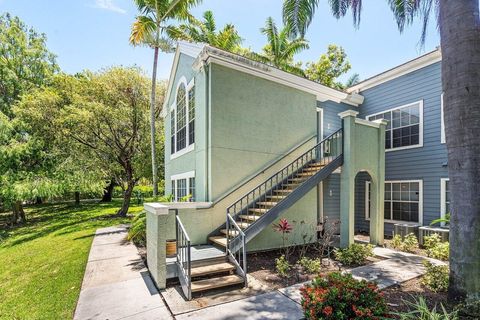
$309,999
2
bds
|
2
ba
|
1,079
sqft
|
built
2001
15045 Michelangelo Blvd, Delray Beach, FL 33446
$-43
Cash flow
-0.7%
Cash-on-Cash Return
6.0%
Cap rate
1.0%
Rent to Value Ratio

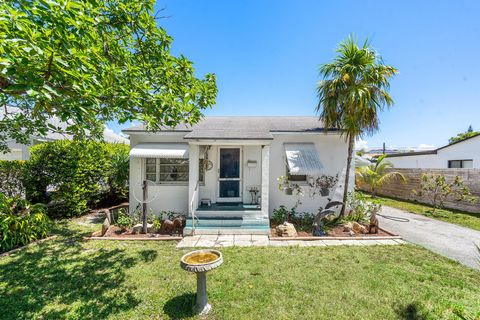
Active
$239,000
2
bds
|
2
ba
|
1,126
sqft
|
built
1978
2860 SW 22nd Ave, Delray Beach, FL 33445
$-425
Cash flow
-9.3%
Cash-on-Cash Return
4.0%
Cap rate
0.9%
Rent to Value Ratio
508 out of 587 properties for sale in Delray Beach, FL
Limited Results Shown
Create a free account, or log in to reveal all property listings and enjoy the complete experience.
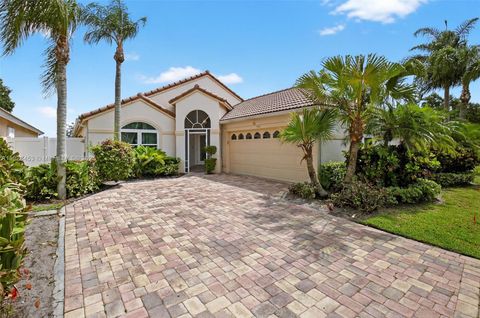
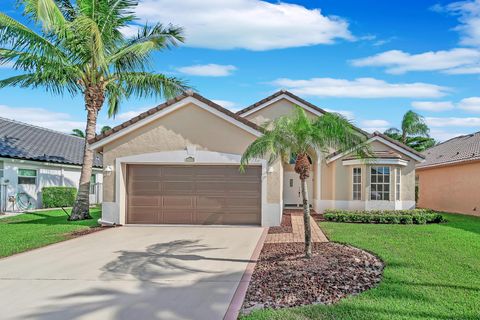
Active
$630,000
3
bds
|
2
ba
|
2,023
sqft
|
built
1994
7881 Stirling Bridge Blvd S, Delray Beach, FL 33446
$-1,425
Cash flow
-11.8%
Cash-on-Cash Return
3.6%
Cap rate
0.6%
Rent to Value Ratio
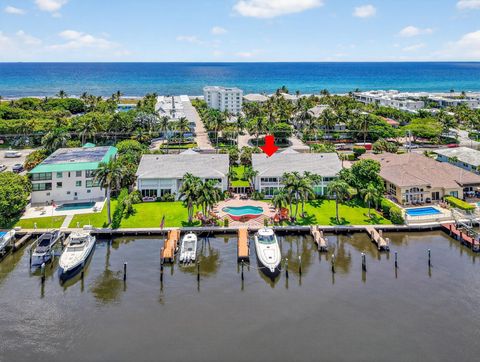
Active
$1,350,000
2
bds
|
2
ba
|
1,544
sqft
|
built
1964
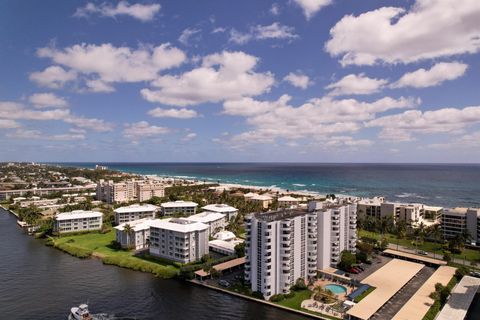
1710 S Ocean Blvd, Delray Beach, FL 33483
$-3,859
Cash flow
-14.9%
Cash-on-Cash Return
2.7%
Cap rate
0.6%
Rent to Value Ratio
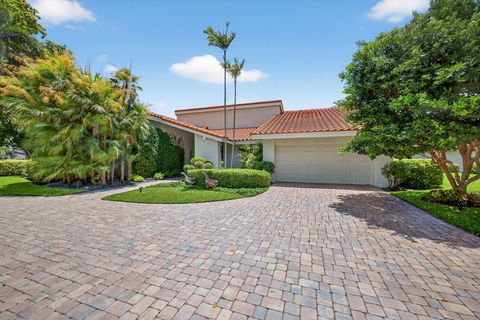
Active
$1,850,000
3
bds
|
4
ba
|
3,025
sqft
|
built
1979
5107 Pineview Cir, Delray Beach, FL 33445
$-6,282
Cash flow
-17.7%
Cash-on-Cash Return
2.1%
Cap rate
0.3%
Rent to Value Ratio
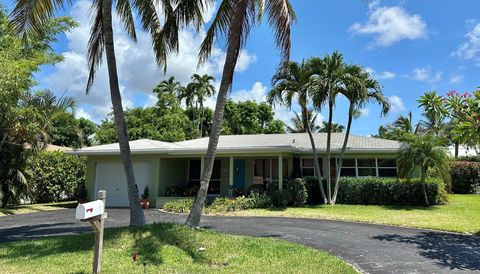
Active
$610,000
2
bds
|
2
ba
|
1,482
sqft
|
built
1970
2200 S Ocean Blvd, Delray Beach, FL 33483
$-1,689
Cash flow
-14.4%
Cash-on-Cash Return
2.9%
Cap rate
0.8%
Rent to Value Ratio
Active
$4,800,000
4
bds
|
5
ba
|
3,658
sqft
|
built
2020
109 NE 9th St, Delray Beach, FL 33444
$-23,104
Cash flow
-25.1%
Cash-on-Cash Return
0.4%
Cap rate
0.2%
Rent to Value Ratio

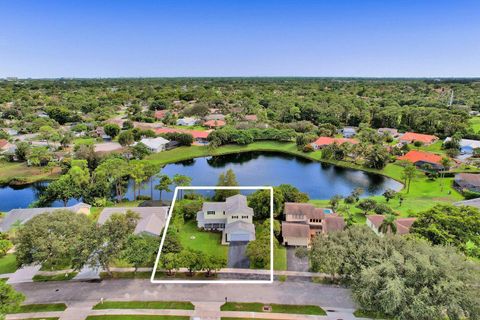
Active
$849,000
3
bds
|
1
ba
|
0
sqft
|
built
1958
246 NE 13th St, Delray Beach, FL 33444
$-2,093
Cash flow
-12.9%
Cash-on-Cash Return
3.2%
Cap rate
0.5%
Rent to Value Ratio
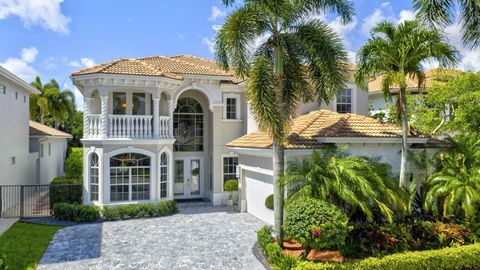
Active
$3,299,000
4
bds
|
4
ba
|
3,443
sqft
|
built
1999
923 Hyacinth Dr, Delray Beach, FL 33483
$-11,637
Cash flow
-18.4%
Cash-on-Cash Return
1.9%
Cap rate
0.3%
Rent to Value Ratio
Active
$675,000
4
bds
|
2
ba
|
1,910
sqft
|
built
1973
633 Heron Dr, Delray Beach, FL 33444
$-1,017
Cash flow
-7.9%
Cash-on-Cash Return
4.3%
Cap rate
0.6%
Rent to Value Ratio
Active
$314,900
2
bds
|
2
ba
|
1,126
sqft
|
built
1981
2895 SW 22nd Ave, Delray Beach, FL 33445
$-928
Cash flow
-15.4%
Cash-on-Cash Return
2.6%
Cap rate
0.6%
Rent to Value Ratio

Active
$229,000
1
bds
|
1
ba
|
680
sqft
|
built
1973
207 Tropic Isle Dr, Delray Beach, FL 33483
$-516
Cash flow
-11.8%
Cash-on-Cash Return
3.4%
Cap rate
1.0%
Rent to Value Ratio
Active
$750,000
3
bds
|
2
ba
|
1,711
sqft
|
built
2000
4780 Blossom Dr, Delray Beach, FL 33445
$-2,162
Cash flow
-15.0%
Cash-on-Cash Return
2.7%
Cap rate
0.5%
Rent to Value Ratio
Active
$215,000
2
bds
|
2
ba
|
1,023
sqft
|
built
1979
2800 Fiore Way, Delray Beach, FL 33445
$-523
Cash flow
-12.7%
Cash-on-Cash Return
3.2%
Cap rate
0.9%
Rent to Value Ratio
Active
$2,400,000
3
bds
|
3
ba
|
1,636
sqft
|
built
1955
1203 NE 9th Ave, Delray Beach, FL 33483
$-9,342
Cash flow
-20.3%
Cash-on-Cash Return
1.6%
Cap rate
0.2%
Rent to Value Ratio
Active
$799,000
2
bds
|
2
ba
|
1,265
sqft
|
built
1965
1015 Ingraham Ave, Delray Beach, FL 33483
$-2,719
Cash flow
-17.8%
Cash-on-Cash Return
2.1%
Cap rate
0.6%
Rent to Value Ratio

Active
$924,999
5
bds
|
4
ba
|
2,848
sqft
|
built
2016
8072 Ironstone Dr, Delray Beach, FL 33446
$-2,204
Cash flow
-12.4%
Cash-on-Cash Return
3.3%
Cap rate
0.6%
Rent to Value Ratio
Active
$499,000
3
bds
|
1
ba
|
972
sqft
|
built
1962
1303 NW 2nd St, Delray Beach, FL 33444
$-818
Cash flow
-8.6%
Cash-on-Cash Return
4.2%
Cap rate
0.6%
Rent to Value Ratio
Active
$3,100,000
4
bds
|
3
ba
|
2,778
sqft
|
built
1989
923 Dogwood Dr, Delray Beach, FL 33483
$-10,648
Cash flow
-17.9%
Cash-on-Cash Return
2.0%
Cap rate
0.4%
Rent to Value Ratio
Active
$459,900
3
bds
|
2
ba
|
1,594
sqft
|
built
2000
5076 N La Sedona Cir, Delray Beach, FL 33484
$-965
Cash flow
-10.9%
Cash-on-Cash Return
3.6%
Cap rate
0.7%
Rent to Value Ratio
Active
$1,250,000
3
bds
|
2
ba
|
1,682
sqft
|
built
1957
114 NE 11th St, Delray Beach, FL 33444
$-4,161
Cash flow
-17.4%
Cash-on-Cash Return
2.2%
Cap rate
0.4%
Rent to Value Ratio
Active
$525,000
3
bds
|
2
ba
|
1,620
sqft
|
built
1993
7506 Ironbridge Cir, Delray Beach, FL 33446
$-850
Cash flow
-8.4%
Cash-on-Cash Return
4.2%
Cap rate
0.7%
Rent to Value Ratio
Active
$995,000
3
bds
|
2
ba
|
1,791
sqft
|
built
1976
3384 Lakeview Dr, Delray Beach, FL 33445
$-2,974
Cash flow
-15.6%
Cash-on-Cash Return
2.7%
Cap rate
0.4%
Rent to Value Ratio
Active
$650,000
3
bds
|
2
ba
|
1,956
sqft
|
built
1994
14066 Glenlyon Ct, Delray Beach, FL 33446
$-1,254
Cash flow
-10.1%
Cash-on-Cash Return
3.8%
Cap rate
0.6%
Rent to Value Ratio
Active
$525,000
3
bds
|
2
ba
|
1,360
sqft
|
built
1993
7514 Ironbridge Cir, Delray Beach, FL 33446
$-1,342
Cash flow
-13.3%
Cash-on-Cash Return
3.2%
Cap rate
0.6%
Rent to Value Ratio
Active
$1,700,000
3
bds
|
2
ba
|
1,664
sqft
|
built
1957
501 NW 13th St, Delray Beach, FL 33444
$-5,917
Cash flow
-18.2%
Cash-on-Cash Return
2.1%
Cap rate
0.3%
Rent to Value Ratio
Active
$1,700,000
4
bds
|
6
ba
|
4,251
sqft
|
built
2004
8168 Valhalla Dr, Delray Beach, FL 33446
$-5,424
Cash flow
-16.6%
Cash-on-Cash Return
2.3%
Cap rate
0.5%
Rent to Value Ratio
Active
$760,000
3
bds
|
3
ba
|
1,908
sqft
|
built
1982
4110 NW 10th St, Delray Beach, FL 33445
$-1,287
Cash flow
-8.8%
Cash-on-Cash Return
4.1%
Cap rate
0.7%
Rent to Value Ratio
Active
$290,000
2
bds
|
2
ba
|
948
sqft
|
built
1989
1000 Crystal Way, Delray Beach, FL 33444
$-853
Cash flow
-15.3%
Cash-on-Cash Return
2.7%
Cap rate
0.9%
Rent to Value Ratio
Active
$795,000
2
bds
|
1
ba
|
780
sqft
|
built
1947
221 NE 10th St, Delray Beach, FL 33444
$-1,994
Cash flow
-13.1%
Cash-on-Cash Return
3.1%
Cap rate
0.4%
Rent to Value Ratio
Active
$465,000
3
bds
|
2
ba
|
1,056
sqft
|
built
1986
713 SW 9th Ct, Delray Beach, FL 33444
$-631
Cash flow
-7.1%
Cash-on-Cash Return
4.5%
Cap rate
0.7%
Rent to Value Ratio
Active
$579,900
2
bds
|
2
ba
|
1,705
sqft
|
built
1986
15822 Loch Maree Ln, Delray Beach, FL 33446
$-1,252
Cash flow
-11.3%
Cash-on-Cash Return
3.6%
Cap rate
0.7%
Rent to Value Ratio
Active
$789,000
3
bds
|
2
ba
|
1,998
sqft
|
built
1995
13506 Carrick Green Ct, Delray Beach, FL 33446
$-1,657
Cash flow
-11.0%
Cash-on-Cash Return
3.6%
Cap rate
0.7%
Rent to Value Ratio

Active
$1,749,000
5
bds
|
5
ba
|
4,807
sqft
|
built
2002
9521 New Waterford Cv, Delray Beach, FL 33446
$-5,952
Cash flow
-17.8%
Cash-on-Cash Return
2.1%
Cap rate
0.4%
Rent to Value Ratio
Active
$1,650,000
3
bds
|
3
ba
|
2,701
sqft
|
built
1992
3568 Admirals Way, Delray Beach, FL 33483
$-4,542
Cash flow
-14.4%
Cash-on-Cash Return
2.8%
Cap rate
0.5%
Rent to Value Ratio

Active
$365,500
3
bds
|
2
ba
|
1,238
sqft
|
built
2001
15185 Michelangelo Blvd, Delray Beach, FL 33446
$-716
Cash flow
-10.2%
Cash-on-Cash Return
3.9%
Cap rate
0.8%
Rent to Value Ratio
Active
$348,000
2
bds
|
2
ba
|
1,079
sqft
|
built
2001
15155 Michelangelo Blvd, Delray Beach, FL 33446
$-917
Cash flow
-13.7%
Cash-on-Cash Return
3.0%
Cap rate
0.6%
Rent to Value Ratio

Active
$275,000
1
bds
|
1
ba
|
750
sqft
|
built
1973
600 Greensward Ln, Delray Beach, FL 33445
$-582
Cash flow
-11.0%
Cash-on-Cash Return
3.6%
Cap rate
0.8%
Rent to Value Ratio

Active
$330,000
2
bds
|
2
ba
|
1,079
sqft
|
built
2001
15035 Michelangelo Blvd, Delray Beach, FL 33446
$-824
Cash flow
-13.0%
Cash-on-Cash Return
3.1%
Cap rate
0.7%
Rent to Value Ratio
Active
$799,000
4
bds
|
3
ba
|
2,338
sqft
|
built
1996
13530 Weyburne Dr, Delray Beach, FL 33446
$-2,323
Cash flow
-15.2%
Cash-on-Cash Return
2.7%
Cap rate
0.6%
Rent to Value Ratio