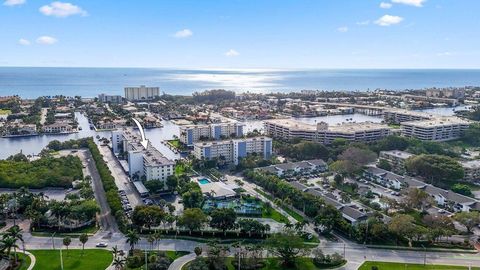
Delray Beach, FL Investment Properties for Sale
Browse homes for sale and investment properties in Delray Beach, FL. Refine your search by price, property type, or more.
Best cash flowing properties in Delray Beach, FL
Active
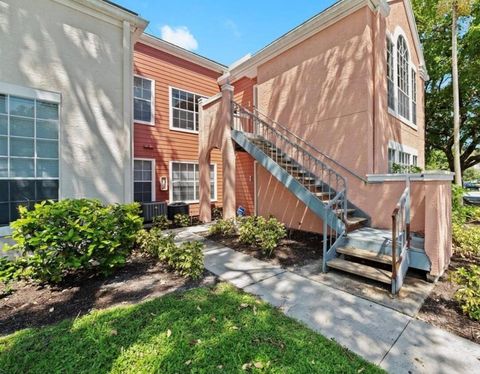
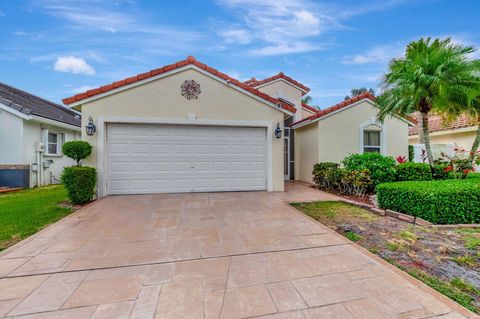
$189,000
2
bds
|
2
ba
|
1,311
sqft
|
built
1990
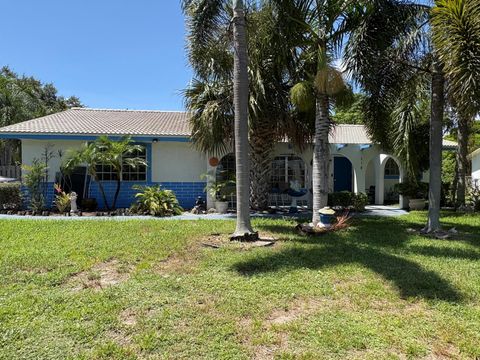
7320 Clunie Pl, Delray Beach, FL 33446
$-81
Cash flow
-2.2%
Cash-on-Cash Return
5.6%
Cap rate
1.2%
Rent to Value Ratio
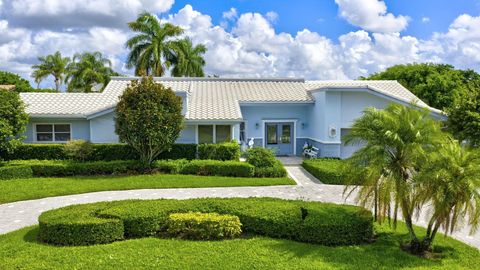
Active
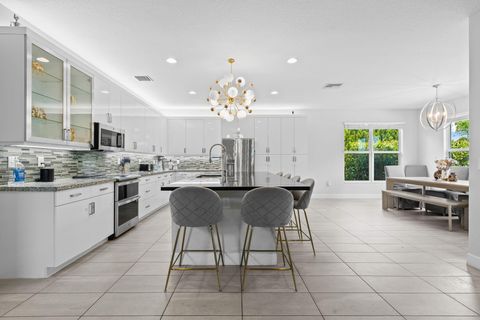
$985,000
3
bds
|
3
ba
|
1,882
sqft
|
built
1958
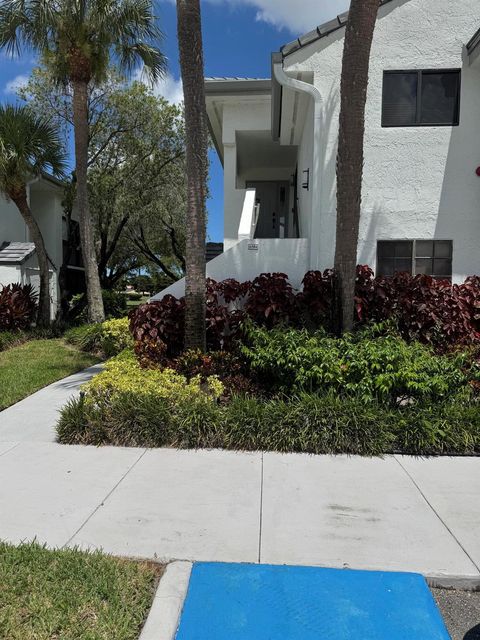
351 Homewood Blvd, Delray Beach, FL 33445
$-486
Cash flow
-2.6%
Cash-on-Cash Return
5.6%
Cap rate
0.8%
Rent to Value Ratio
393 out of 452 properties for sale in Delray Beach, FL
Limited Results Shown
Create a free account, or log in to reveal all property listings and enjoy the complete experience.

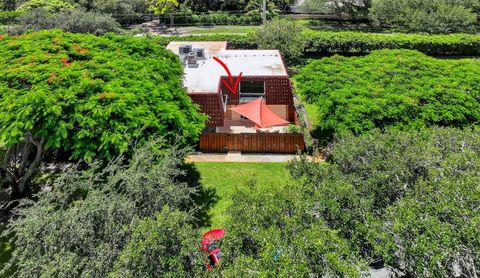
Active
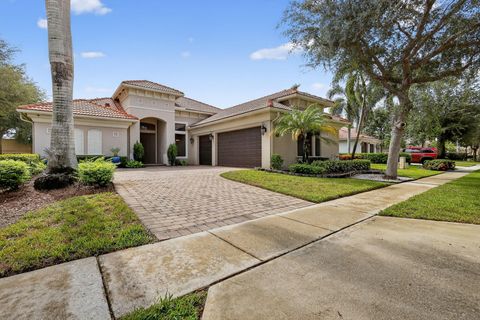
$1,125,000
4
bds
|
3
ba
|
2,656
sqft
|
built
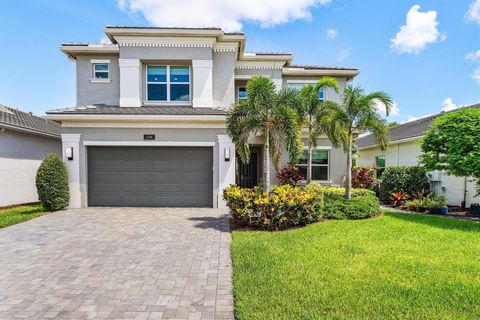
2019
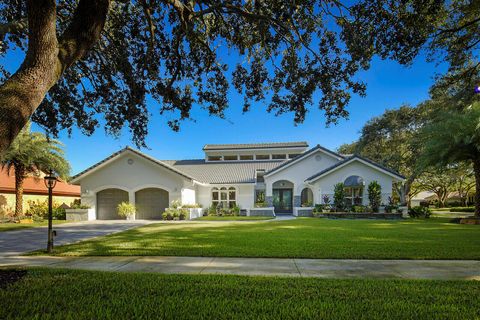
9751 Salty Bay Dr, Delray Beach, FL 33446
$-804
Cash flow
-3.7%
Cash-on-Cash Return
5.3%
Cap rate
0.8%
Rent to Value Ratio
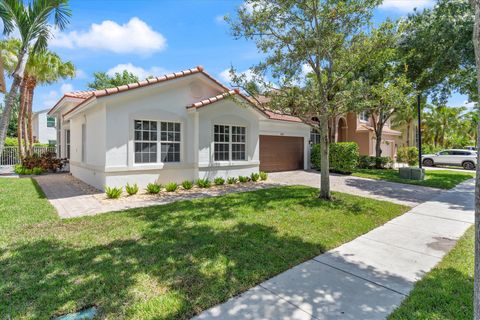
Active
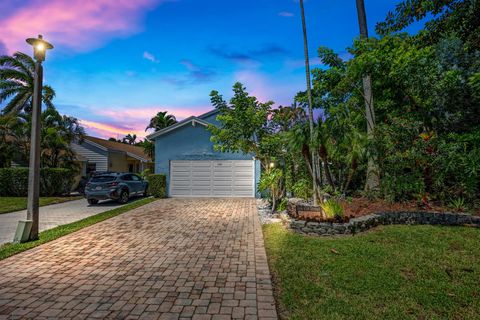
$565,999
4
bds
|
2
ba
|
1,363
sqft
|
built
2002
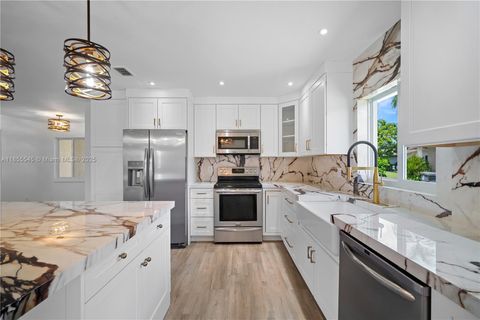
31 SW 11th Ave, Delray Beach, FL 33444
$-1,583
Cash flow
-14.6%
Cash-on-Cash Return
2.8%
Cap rate
0.5%
Rent to Value Ratio
Active
$1,950,000
6
bds
|
5
ba
|
4,052
sqft
|
built
2000
15463 Tall Oak Ave, Delray Beach, FL 33446
$-5,916
Cash flow
-15.8%
Cash-on-Cash Return
2.5%
Cap rate
0.4%
Rent to Value Ratio
Active
$1,475,000
3
bds
|
3
ba
|
2,601
sqft
|
built
1996
16100 Villa Vizcaya Pl, Delray Beach, FL 33446
$-4,644
Cash flow
-16.4%
Cash-on-Cash Return
2.4%
Cap rate
0.4%
Rent to Value Ratio
Active
$1,250,000
3
bds
|
3
ba
|
2,103
sqft
|
built
2017
1015 Phillips Rd, Delray Beach, FL 33483
$-4,619
Cash flow
-19.3%
Cash-on-Cash Return
1.7%
Cap rate
0.4%
Rent to Value Ratio
Active
$795,000
4
bds
|
2
ba
|
1,574
sqft
|
built
1959
803 Bluebird Dr, Delray Beach, FL 33444
$-2,151
Cash flow
-14.1%
Cash-on-Cash Return
2.9%
Cap rate
0.5%
Rent to Value Ratio
Active
$529,000
2
bds
|
2
ba
|
1,092
sqft
|
built
1975
1 Harbourside Dr, Delray Beach, FL 33483
$-1,492
Cash flow
-14.7%
Cash-on-Cash Return
2.8%
Cap rate
0.7%
Rent to Value Ratio
Active
$384,900
2
bds
|
2
ba
|
1,028
sqft
|
built
2005
4816 W Bexley Park Dr, Delray Beach, FL 33445
$-982
Cash flow
-13.3%
Cash-on-Cash Return
3.1%
Cap rate
0.6%
Rent to Value Ratio
Active
$305,000
2
bds
|
2
ba
|
1,079
sqft
|
built
2001
15105 Michelangelo Blvd, Delray Beach, FL 33446
$-696
Cash flow
-11.9%
Cash-on-Cash Return
3.4%
Cap rate
0.7%
Rent to Value Ratio
Active
$489,000
3
bds
|
3
ba
|
1,440
sqft
|
built
1996
831 Kokomo Key Ln, Delray Beach, FL 33483
$-1,376
Cash flow
-14.7%
Cash-on-Cash Return
2.8%
Cap rate
0.7%
Rent to Value Ratio
Active
$1,815,000
3
bds
|
3
ba
|
2,184
sqft
|
built
2007
125 NE 10th St, Delray Beach, FL 33444
$-3,605
Cash flow
-10.4%
Cash-on-Cash Return
3.8%
Cap rate
0.5%
Rent to Value Ratio
Active
$289,900
2
bds
|
2
ba
|
948
sqft
|
built
1989
1165 Crystal Way, Delray Beach, FL 33444
$-902
Cash flow
-16.2%
Cash-on-Cash Return
2.4%
Cap rate
0.8%
Rent to Value Ratio
Active
$1,420,000
6
bds
|
5
ba
|
3,477
sqft
|
built
2022
7619 Francisca Club Ln, Delray Beach, FL 33446
$-4,645
Cash flow
-17.1%
Cash-on-Cash Return
2.2%
Cap rate
0.5%
Rent to Value Ratio
Active
$1,195,000
4
bds
|
3
ba
|
2,772
sqft
|
built
2006
16211 Rosecroft Ter, Delray Beach, FL 33446
$-3,219
Cash flow
-14.1%
Cash-on-Cash Return
2.9%
Cap rate
0.5%
Rent to Value Ratio
Active
$675,000
3
bds
|
3
ba
|
1,955
sqft
|
built
1979
1885 NW 9th St, Delray Beach, FL 33445
$-1,404
Cash flow
-10.9%
Cash-on-Cash Return
3.7%
Cap rate
0.7%
Rent to Value Ratio
Active
$720,000
3
bds
|
2
ba
|
1,515
sqft
|
built
1972
518 Linnet Cir, Delray Beach, FL 33444
$-1,417
Cash flow
-10.3%
Cash-on-Cash Return
3.8%
Cap rate
0.5%
Rent to Value Ratio

Active
$625,000
3
bds
|
2
ba
|
1,600
sqft
|
built
1980
6251 Hitchin Post Way, Delray Beach, FL 33484
$-1,819
Cash flow
-15.2%
Cash-on-Cash Return
2.7%
Cap rate
0.4%
Rent to Value Ratio
Active
$699,000
2
bds
|
2
ba
|
1,900
sqft
|
built
1987
15646 Loch Maree Ln, Delray Beach, FL 33446
$-2,555
Cash flow
-19.1%
Cash-on-Cash Return
1.8%
Cap rate
0.4%
Rent to Value Ratio
Active
$1,695,000
4
bds
|
3
ba
|
2,586
sqft
|
built
1986
2155 Rabbit Hollowe Cir, Delray Beach, FL 33445
$-5,629
Cash flow
-17.3%
Cash-on-Cash Return
2.2%
Cap rate
0.3%
Rent to Value Ratio
Active
$495,000
2
bds
|
2
ba
|
1,527
sqft
|
built
1984
13826 Kaiser Trl, Delray Beach, FL 33484
$-1,436
Cash flow
-15.1%
Cash-on-Cash Return
2.7%
Cap rate
0.5%
Rent to Value Ratio
Active
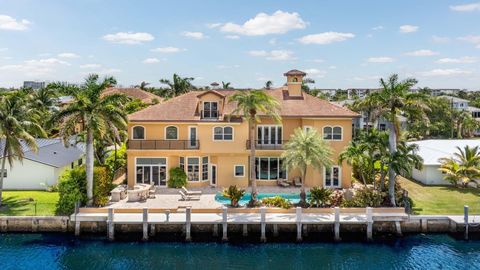
$4,950,000
5
bds
|
7
ba
|
6,079
sqft
|
built
2007
929 Banyan Dr, Delray Beach, FL 33483
$-25,341
Cash flow
-26.7%
Cash-on-Cash Return
0.0%
Cap rate
0.2%
Rent to Value Ratio
Active
$675,000
3
bds
|
2
ba
|
1,528
sqft
|
built
1993
7534 Ironbridge Cir, Delray Beach, FL 33446
$-1,608
Cash flow
-12.4%
Cash-on-Cash Return
3.3%
Cap rate
0.6%
Rent to Value Ratio
Active
$660,000
4
bds
|
3
ba
|
2,004
sqft
|
built
2003
1660 W Classical Blvd, Delray Beach, FL 33445
$-1,368
Cash flow
-10.8%
Cash-on-Cash Return
3.7%
Cap rate
0.7%
Rent to Value Ratio
Active
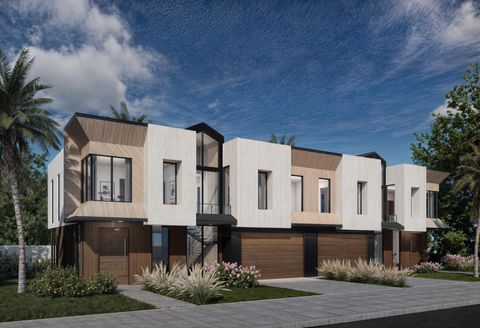
$3,750,000
4
bds
|
5
ba
|
3,055
sqft
|
built
2026
801 Bond Way, Delray Beach, FL 33483
$-18,716
Cash flow
-26.0%
Cash-on-Cash Return
0.2%
Cap rate
0.1%
Rent to Value Ratio
Active
$1,297,000
6
bds
|
5
ba
|
3,477
sqft
|
built
2021
13148 Whistler Mountain Rd, Delray Beach, FL 33446
$-2,381
Cash flow
-9.6%
Cash-on-Cash Return
3.9%
Cap rate
0.7%
Rent to Value Ratio
Active
$749,000
1
bds
|
1
ba
|
1,004
sqft
|
built
2006
200 NE 2nd Ave, Delray Beach, FL 33444
$-6,044
Cash flow
-42.1%
Cash-on-Cash Return
-3.5%
Cap rate
0.5%
Rent to Value Ratio
Active
$585,000
3
bds
|
3
ba
|
2,110
sqft
|
built
1997
16927 Isle Of Palms Dr, Delray Beach, FL 33484
$-1,652
Cash flow
-14.7%
Cash-on-Cash Return
2.8%
Cap rate
0.6%
Rent to Value Ratio
Active
$4,599,000
4
bds
|
6
ba
|
5,222
sqft
|
built
1995
16283 Vintage Oaks Ln, Delray Beach, FL 33484
$-20,692
Cash flow
-23.5%
Cash-on-Cash Return
0.7%
Cap rate
0.2%
Rent to Value Ratio
Active
$4,200,000
4
bds
|
3
ba
|
3,166
sqft
|
built
1998
256 Venetian Dr, Delray Beach, FL 33483
$-17,081
Cash flow
-21.2%
Cash-on-Cash Return
1.3%
Cap rate
0.2%
Rent to Value Ratio
Active
$1,450,000
4
bds
|
3
ba
|
2,523
sqft
|
built
1988
2736 Devon Ct, Delray Beach, FL 33445
$-4,543
Cash flow
-16.3%
Cash-on-Cash Return
2.4%
Cap rate
0.4%
Rent to Value Ratio
Active
$220,000
1
bds
|
1
ba
|
696
sqft
|
built
1989
1205 Crystal Way, Delray Beach, FL 33444
$-693
Cash flow
-16.4%
Cash-on-Cash Return
2.4%
Cap rate
0.9%
Rent to Value Ratio
Active
$4,275,000
5
bds
|
6
ba
|
3,813
sqft
|
built
1992
917 Iris Dr, Delray Beach, FL 33483
$-17,586
Cash flow
-21.5%
Cash-on-Cash Return
1.2%
Cap rate
0.2%
Rent to Value Ratio
Active
$485,000
2
bds
|
2
ba
|
1,092
sqft
|
built
1982
1 Harbourside Dr, Delray Beach, FL 33483
$-1,282
Cash flow
-13.8%
Cash-on-Cash Return
3.0%
Cap rate
0.7%
Rent to Value Ratio
Active
$1,980,000
4
bds
|
4
ba
|
4,006
sqft
|
built
1980
3533 Pine Lake Ct, Delray Beach, FL 33445
$-6,987
Cash flow
-18.4%
Cash-on-Cash Return
1.9%
Cap rate
0.3%
Rent to Value Ratio
Active
$359,900
2
bds
|
3
ba
|
1,230
sqft
|
built
1979
1820 San Juan Dr, Delray Beach, FL 33445
$-720
Cash flow
-10.4%
Cash-on-Cash Return
3.7%
Cap rate
0.7%
Rent to Value Ratio
Active
$825,000
4
bds
|
3
ba
|
2,004
sqft
|
built
2003
4813 S Classical Blvd, Delray Beach, FL 33445
$-2,046
Cash flow
-12.9%
Cash-on-Cash Return
3.2%
Cap rate
0.5%
Rent to Value Ratio
Active
$1,620,000
4
bds
|
5
ba
|
4,040
sqft
|
built
2002
16251 Bristol Pointe Dr, Delray Beach, FL 33446
$-4,655
Cash flow
-15.0%
Cash-on-Cash Return
2.7%
Cap rate
0.5%
Rent to Value Ratio
Active
$1,997,313
4
bds
|
4
ba
|
3,765
sqft
|
built
1959
3523 Lone Pine Rd, Delray Beach, FL 33445
$-7,264
Cash flow
-19.0%
Cash-on-Cash Return
1.8%
Cap rate
0.3%
Rent to Value Ratio