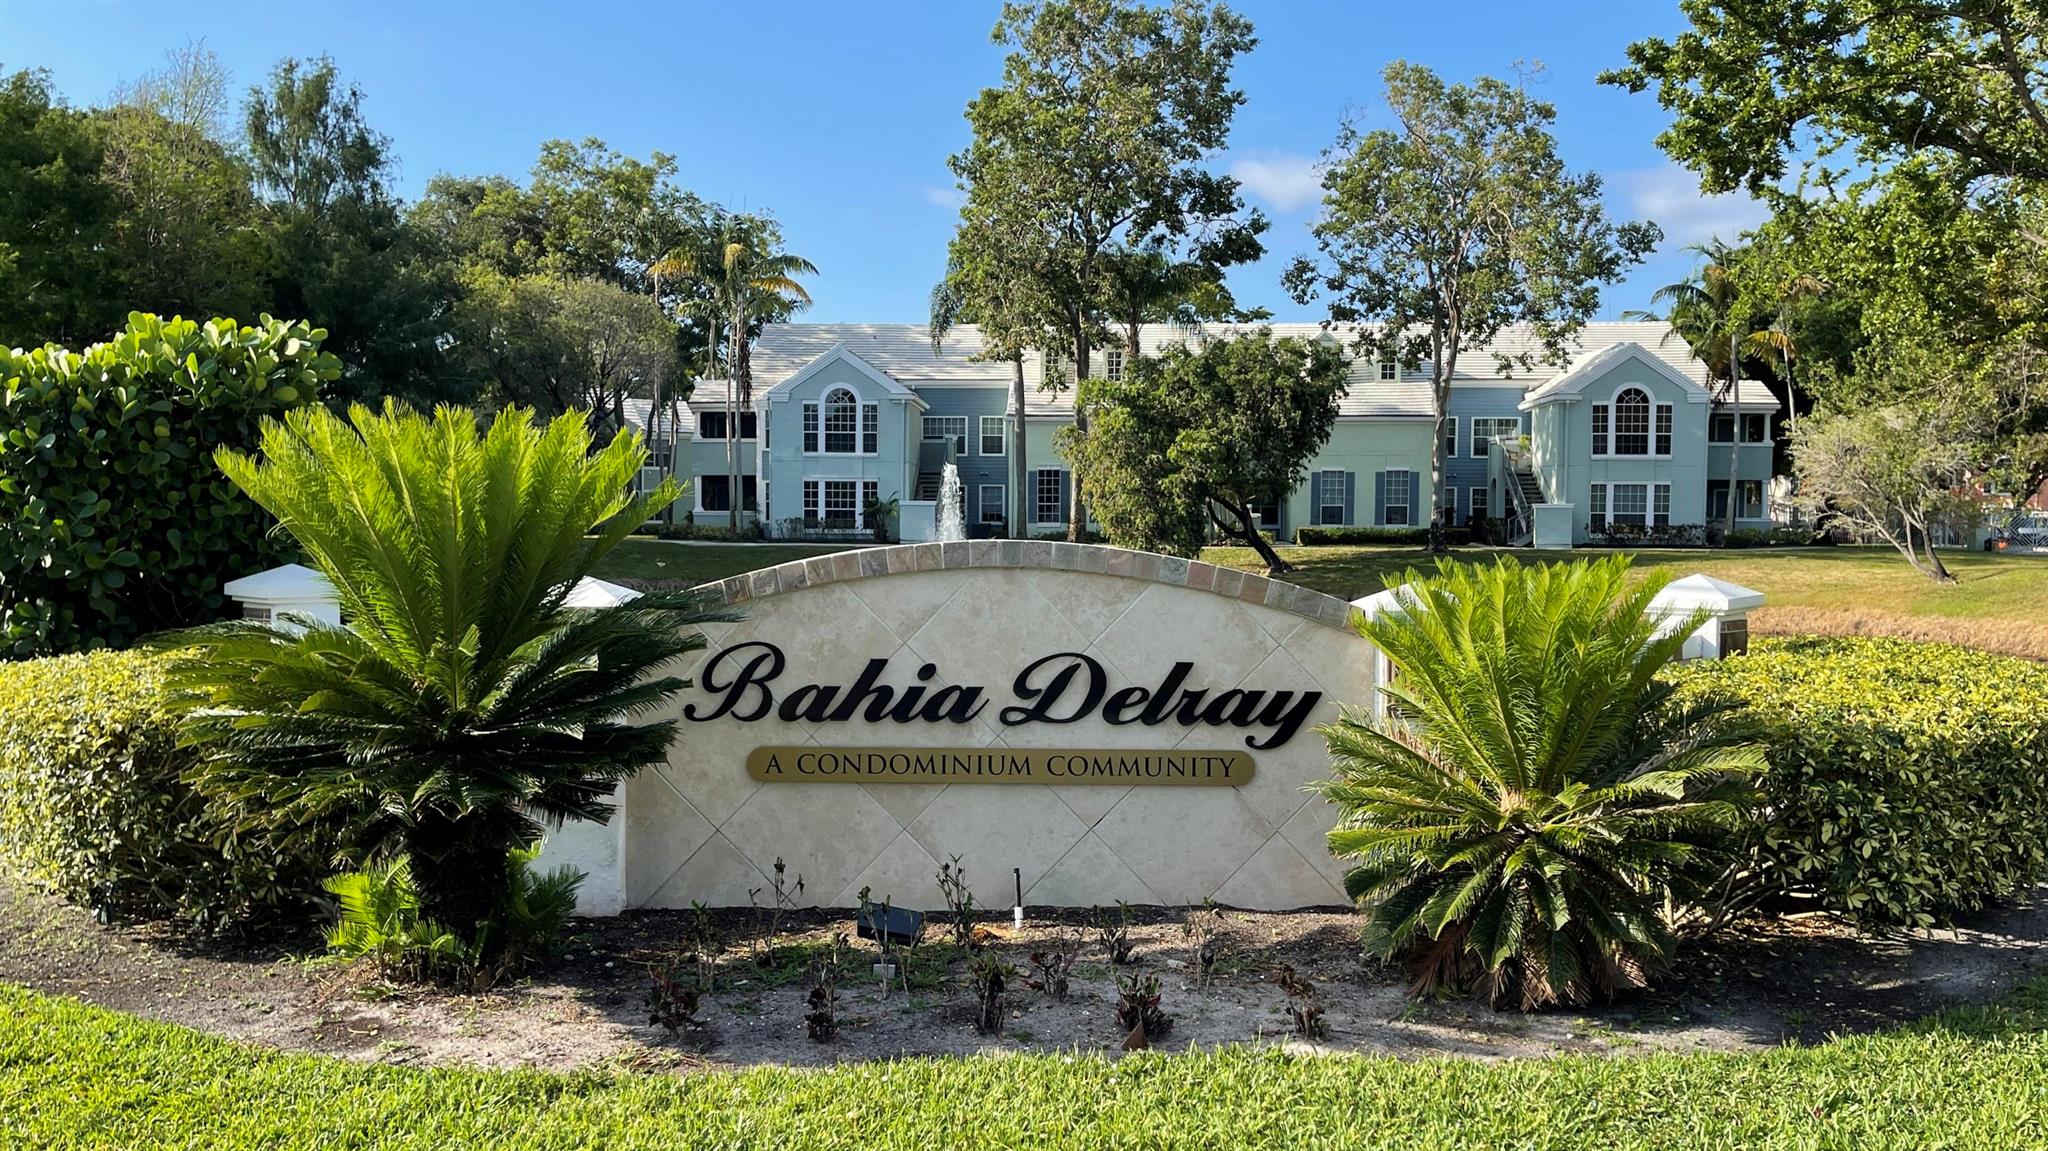
Delray Beach, FL Investment Properties for Sale
Browse homes for sale and investment properties in Delray Beach, FL. Refine your search by price, property type, or more.
Best cash flowing properties in Delray Beach, FL
Active
$179,000
2
bds
|
2
ba
|
1,728
sqft
|
built
1985
7509 Glendevon Ln, Delray Beach, FL 33446
$-260
Cash flow
-7.6%
Cash-on-Cash Return
4.5%
Cap rate
1.5%
Rent to Value Ratio
Active
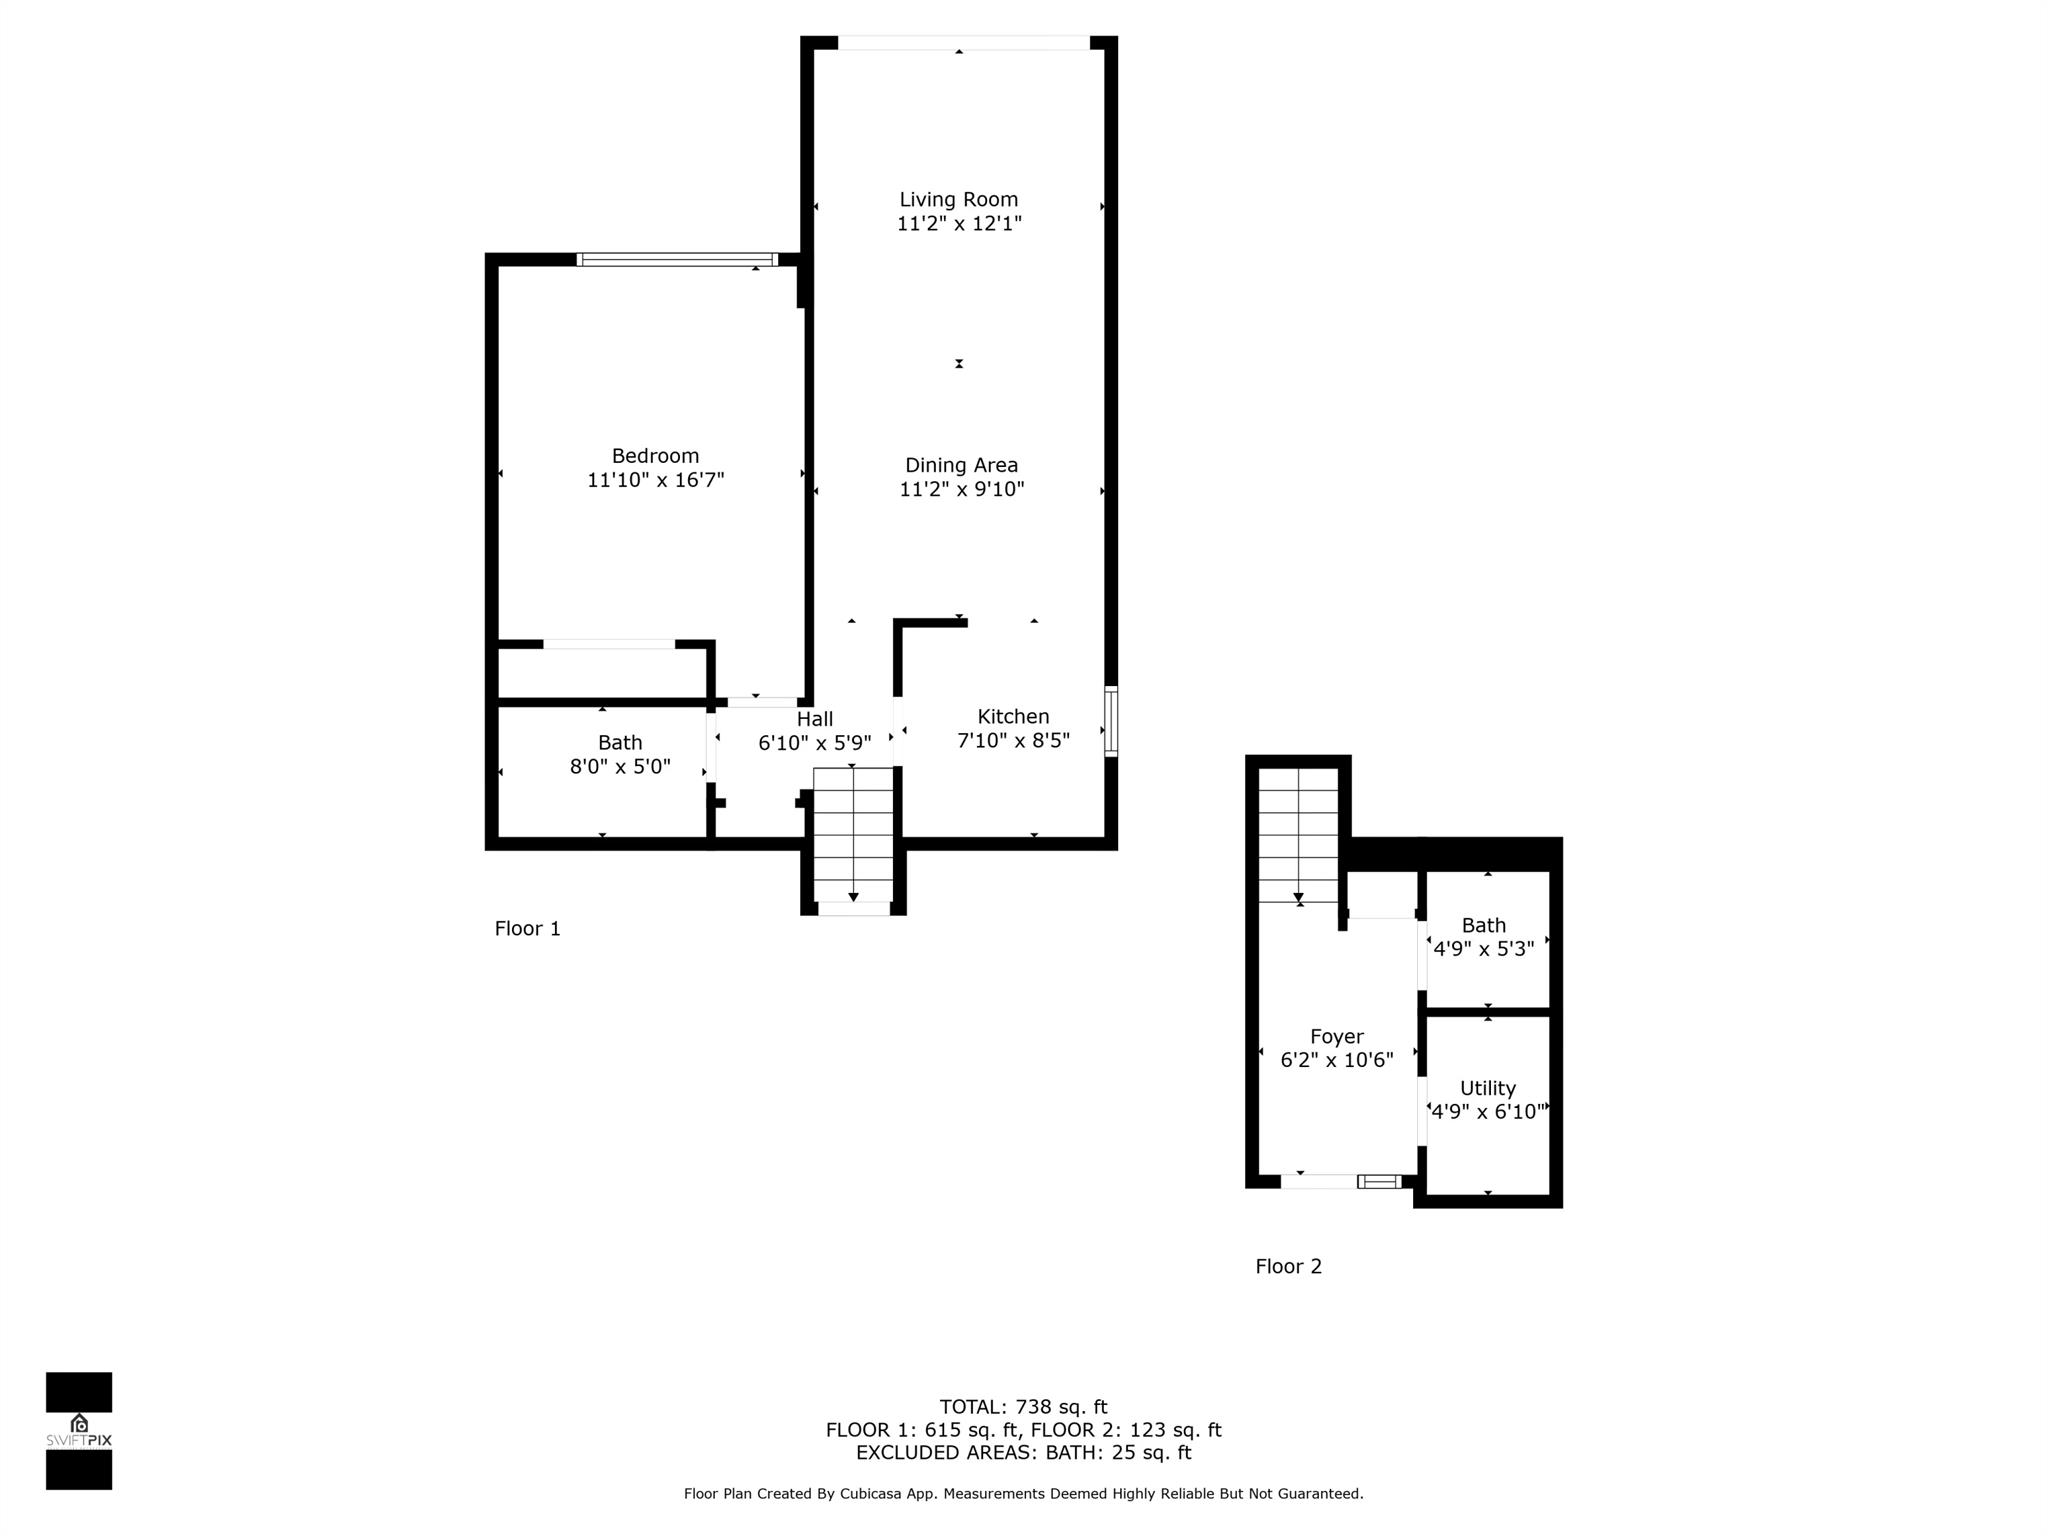
$215,000
1
bds
|
1
ba
|
560
sqft
|
built
1989
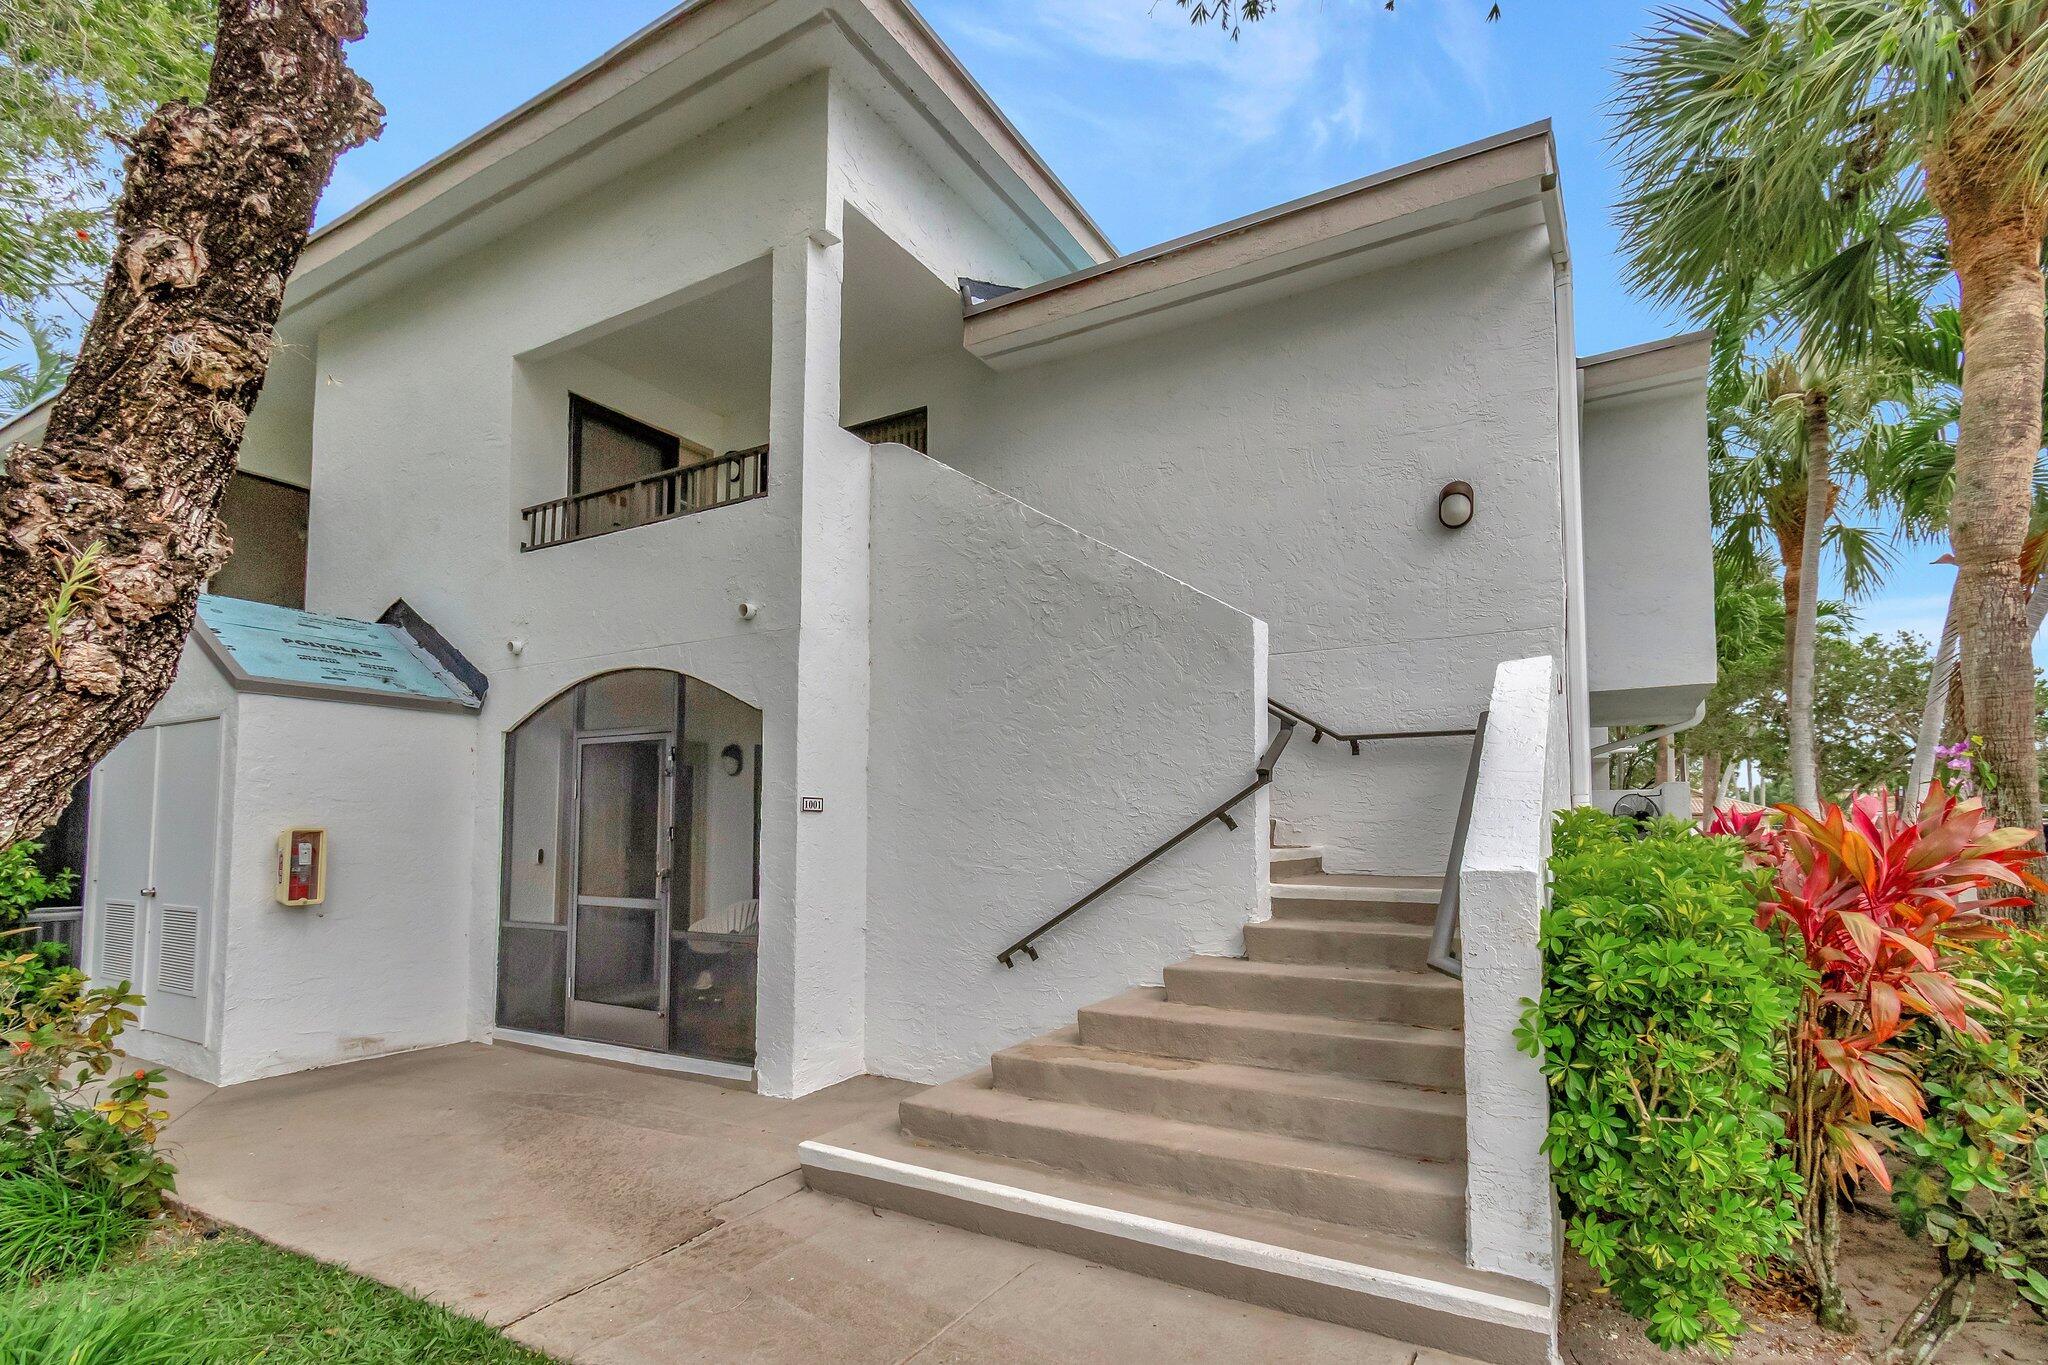
1050 Crystal Way, Delray Beach, FL 33444
$-398
Cash flow
-9.7%
Cash-on-Cash Return
4.1%
Cap rate
0.9%
Rent to Value Ratio
642 out of 740 properties for sale in Delray Beach, FL
Limited Results Shown
Create a free account, or log in to reveal all property listings and enjoy the complete experience.
Active
$629,000
3
bds
|
2
ba
|
2,035
sqft
|
built
1992
5040 Alencia Ct, Delray Beach, FL 33484
$-1,066
Cash flow
-8.8%
Cash-on-Cash Return
4.3%
Cap rate
0.7%
Rent to Value Ratio
Active
$775,000
3
bds
|
3
ba
|
1,680
sqft
|
built
1995
710 Clearbrook Park Cir, Delray Beach, FL 33445
$-1,930
Cash flow
-13.0%
Cash-on-Cash Return
3.3%
Cap rate
0.5%
Rent to Value Ratio
Active
$1,575,000
6
bds
|
5
ba
|
3,477
sqft
|
built
2020
7650 Francisca Club Ln, Delray Beach, FL 33446
$-5,313
Cash flow
-17.6%
Cash-on-Cash Return
2.2%
Cap rate
0.4%
Rent to Value Ratio
Active
$4,550,000
5
bds
|
7
ba
|
7,728
sqft
|
built
2007
8417 Del Prado Dr, Delray Beach, FL 33446
$-18,165
Cash flow
-20.8%
Cash-on-Cash Return
1.5%
Cap rate
0.3%
Rent to Value Ratio
Active
$215,000
1
bds
|
1
ba
|
560
sqft
|
built
1989
1050 Crystal Way, Delray Beach, FL 33444
$-398
Cash flow
-9.7%
Cash-on-Cash Return
4.1%
Cap rate
0.9%
Rent to Value Ratio
Active
$1,475,000
4
bds
|
4
ba
|
3,537
sqft
|
built
2014
16794 Bridge Crossing Cir, Delray Beach, FL 33446
$-3,680
Cash flow
-13.0%
Cash-on-Cash Return
3.3%
Cap rate
0.6%
Rent to Value Ratio
Active
$4,900,000
5
bds
|
5
ba
|
5,350
sqft
|
built
1990
3605 Oakview Ct, Delray Beach, FL 33445
$-20,446
Cash flow
-21.8%
Cash-on-Cash Return
1.3%
Cap rate
0.2%
Rent to Value Ratio
Active
$465,000
3
bds
|
3
ba
|
1,632
sqft
|
built
2001
336 W Coral Trace Cir, Delray Beach, FL 33445
$-950
Cash flow
-10.7%
Cash-on-Cash Return
3.8%
Cap rate
0.7%
Rent to Value Ratio
Active
$1,399,000
3
bds
|
3
ba
|
2,013
sqft
|
built
1989
702 Enfield Rd, Delray Beach, FL 33444
$-5,590
Cash flow
-20.8%
Cash-on-Cash Return
1.5%
Cap rate
0.3%
Rent to Value Ratio
Active
$690,000
3
bds
|
2
ba
|
2,165
sqft
|
built
1973
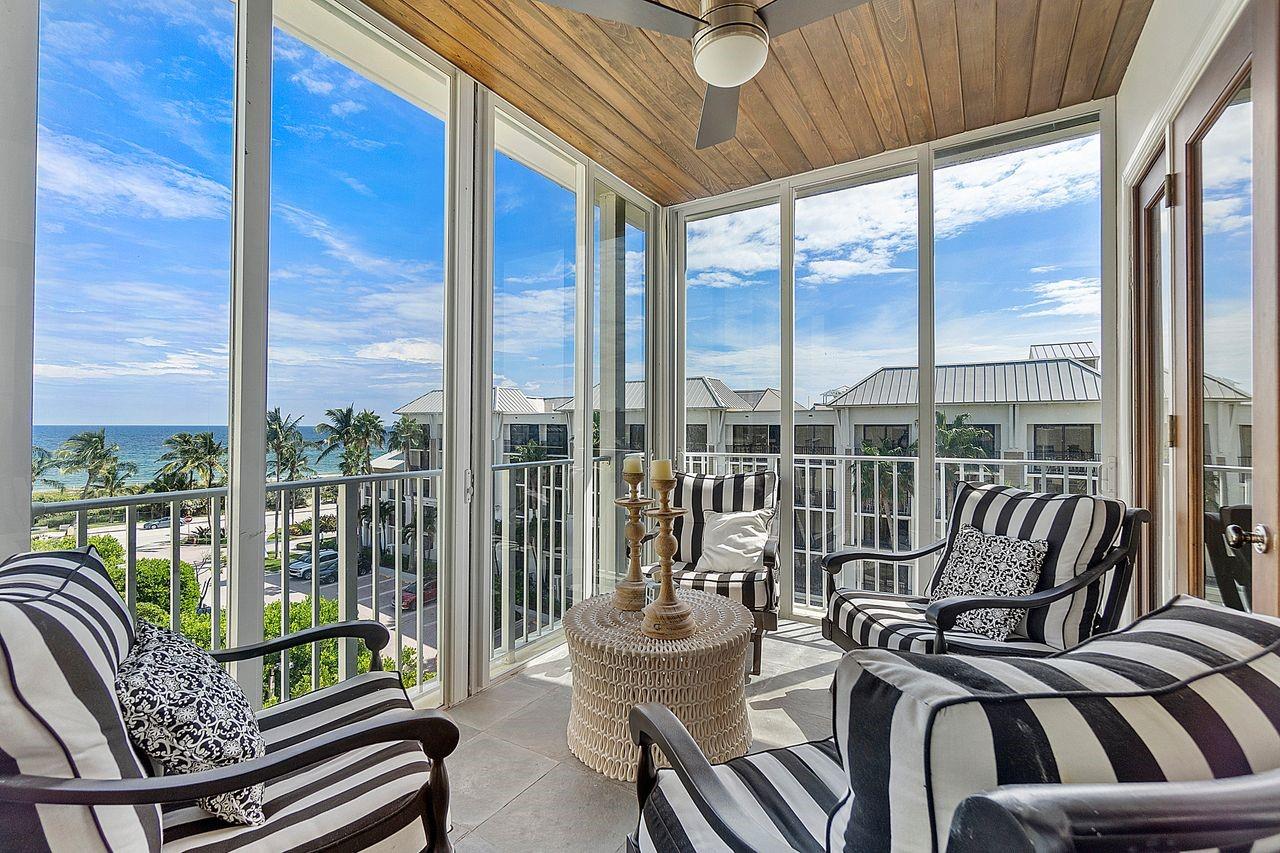
2000 S Ocean Blvd, Delray Beach, FL 33483
$-1,736
Cash flow
-13.1%
Cash-on-Cash Return
3.3%
Cap rate
0.9%
Rent to Value Ratio
Active
$329,000
2
bds
|
2
ba
|
1,272
sqft
|
built
1982
825 Egret Cir, Delray Beach, FL 33444
$-1,324
Cash flow
-21.0%
Cash-on-Cash Return
1.5%
Cap rate
0.8%
Rent to Value Ratio
Active
$599,000
3
bds
|
3
ba
|
2,110
sqft
|
built
1997
16927 Isle Of Palms Dr, Delray Beach, FL 33484
$-1,792
Cash flow
-15.6%
Cash-on-Cash Return
2.7%
Cap rate
0.6%
Rent to Value Ratio
Active
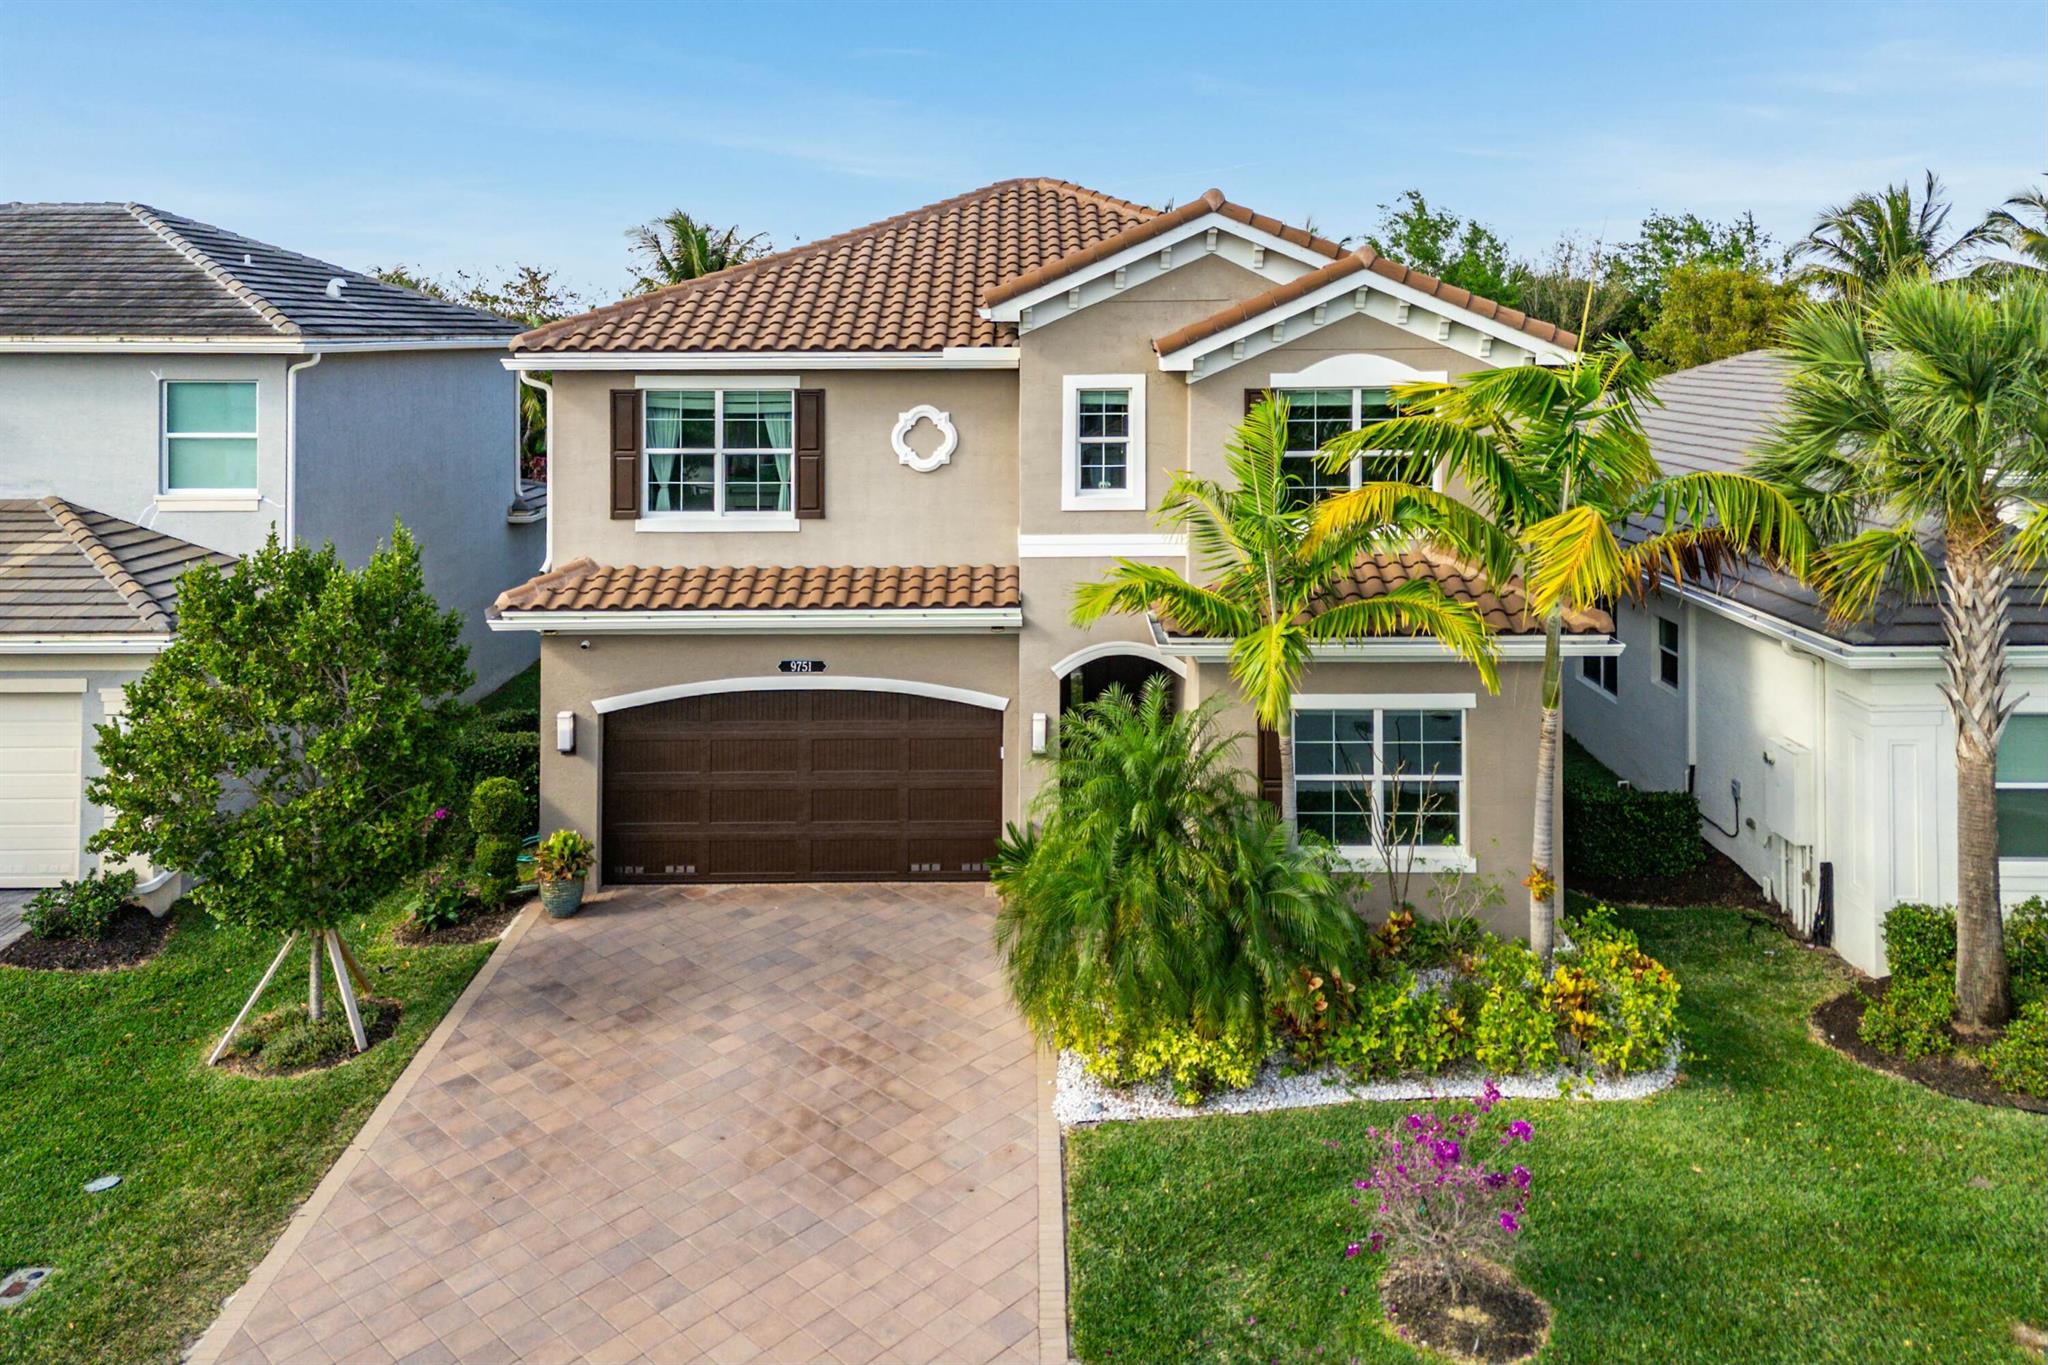
$1,250,000
4
bds
|
3
ba
|
2,656
sqft
|
built
2019
9751 Salty Bay Dr, Delray Beach, FL 33446
$-1,587
Cash flow
-6.6%
Cash-on-Cash Return
4.8%
Cap rate
0.7%
Rent to Value Ratio
Active
$310,000
2
bds
|
2
ba
|
1,175
sqft
|
built
1981
450 Egret Cir, Delray Beach, FL 33444
$-1,043
Cash flow
-17.6%
Cash-on-Cash Return
2.2%
Cap rate
0.8%
Rent to Value Ratio
Active
$615,000
3
bds
|
2
ba
|
1,655
sqft
|
built
1979
2462 Sundy Ave, Delray Beach, FL 33444
$-1,116
Cash flow
-9.5%
Cash-on-Cash Return
4.1%
Cap rate
0.5%
Rent to Value Ratio
Active
$205,000
1
bds
|
2
ba
|
758
sqft
|
built
1979
755 Dotterel Rd, Delray Beach, FL 33444
$-482
Cash flow
-12.3%
Cash-on-Cash Return
3.5%
Cap rate
1.0%
Rent to Value Ratio
Active
$395,000
3
bds
|
1
ba
|
1,008
sqft
|
built
1982
237 SW 11th Ave, Delray Beach, FL 33444
$-555
Cash flow
-7.3%
Cash-on-Cash Return
4.6%
Cap rate
0.7%
Rent to Value Ratio
Pending
$675,000
3
bds
|
4
ba
|
1,628
sqft
|
built
2008
226 N Latitude Cir, Delray Beach, FL 33483
$-1,786
Cash flow
-13.8%
Cash-on-Cash Return
3.1%
Cap rate
0.7%
Rent to Value Ratio
Active
$428,000
2
bds
|
2
ba
|
1,175
sqft
|
built
1993
15136 W Tranquility Lake Dr, Delray Beach, FL 33446
$-974
Cash flow
-11.9%
Cash-on-Cash Return
3.6%
Cap rate
0.6%
Rent to Value Ratio
Active
$329,000
2
bds
|
2
ba
|
1,728
sqft
|
built
1989
7290 Clunie Pl, Delray Beach, FL 33446
$-497
Cash flow
-7.9%
Cash-on-Cash Return
4.5%
Cap rate
0.9%
Rent to Value Ratio
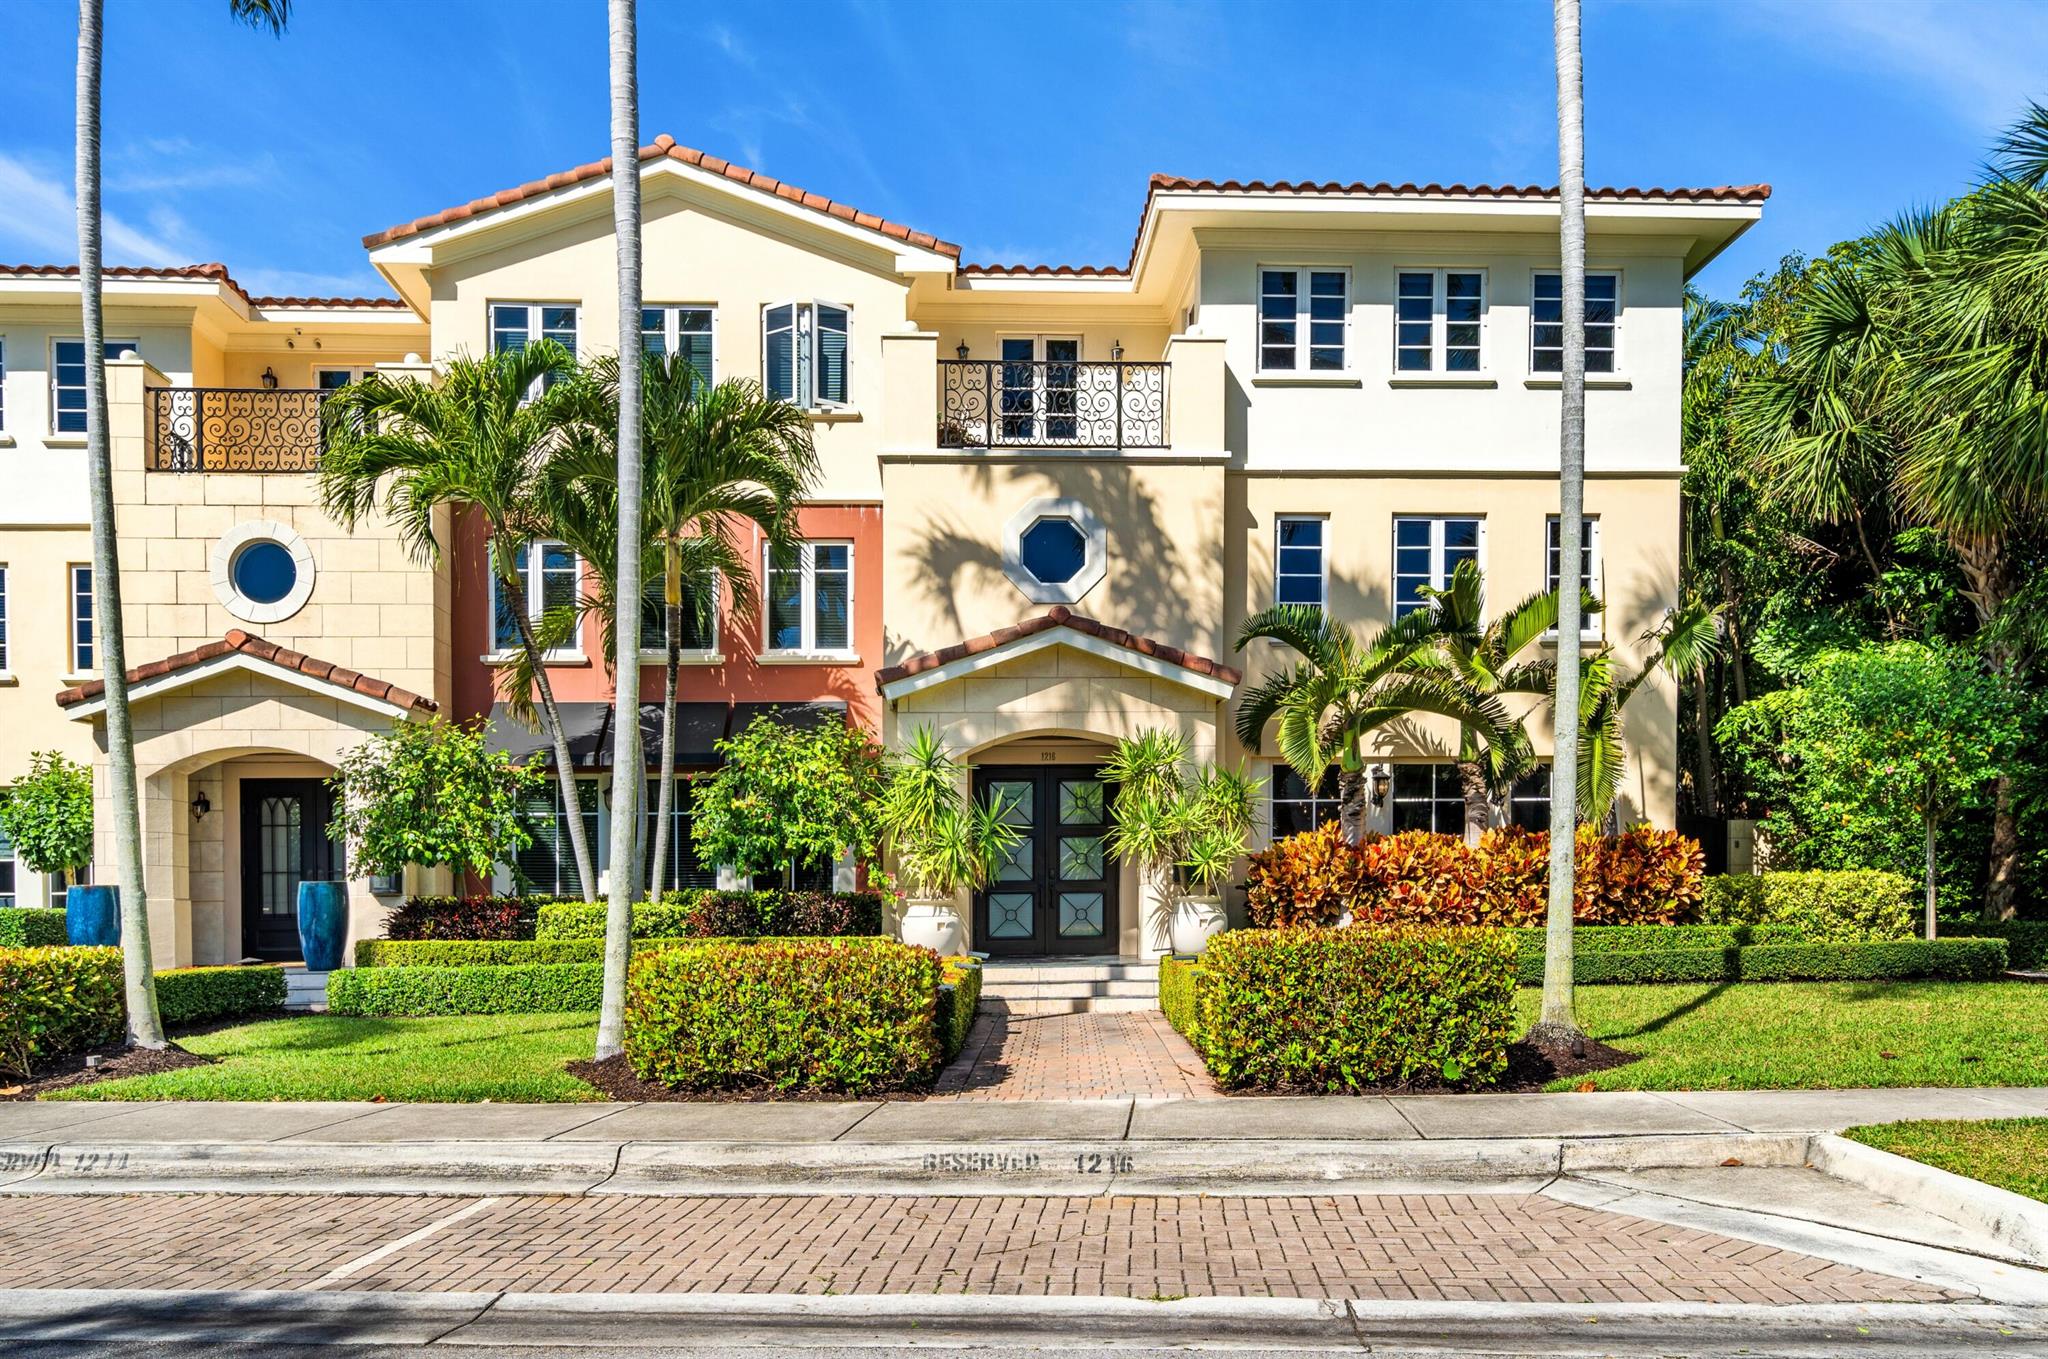
Active
$3,795,000
5
bds
|
7
ba
|
6,245
sqft
|
built
2010
1216 Palm Trl, Delray Beach, FL 33483
$-19,503
Cash flow
-26.8%
Cash-on-Cash Return
0.1%
Cap rate
0.2%
Rent to Value Ratio
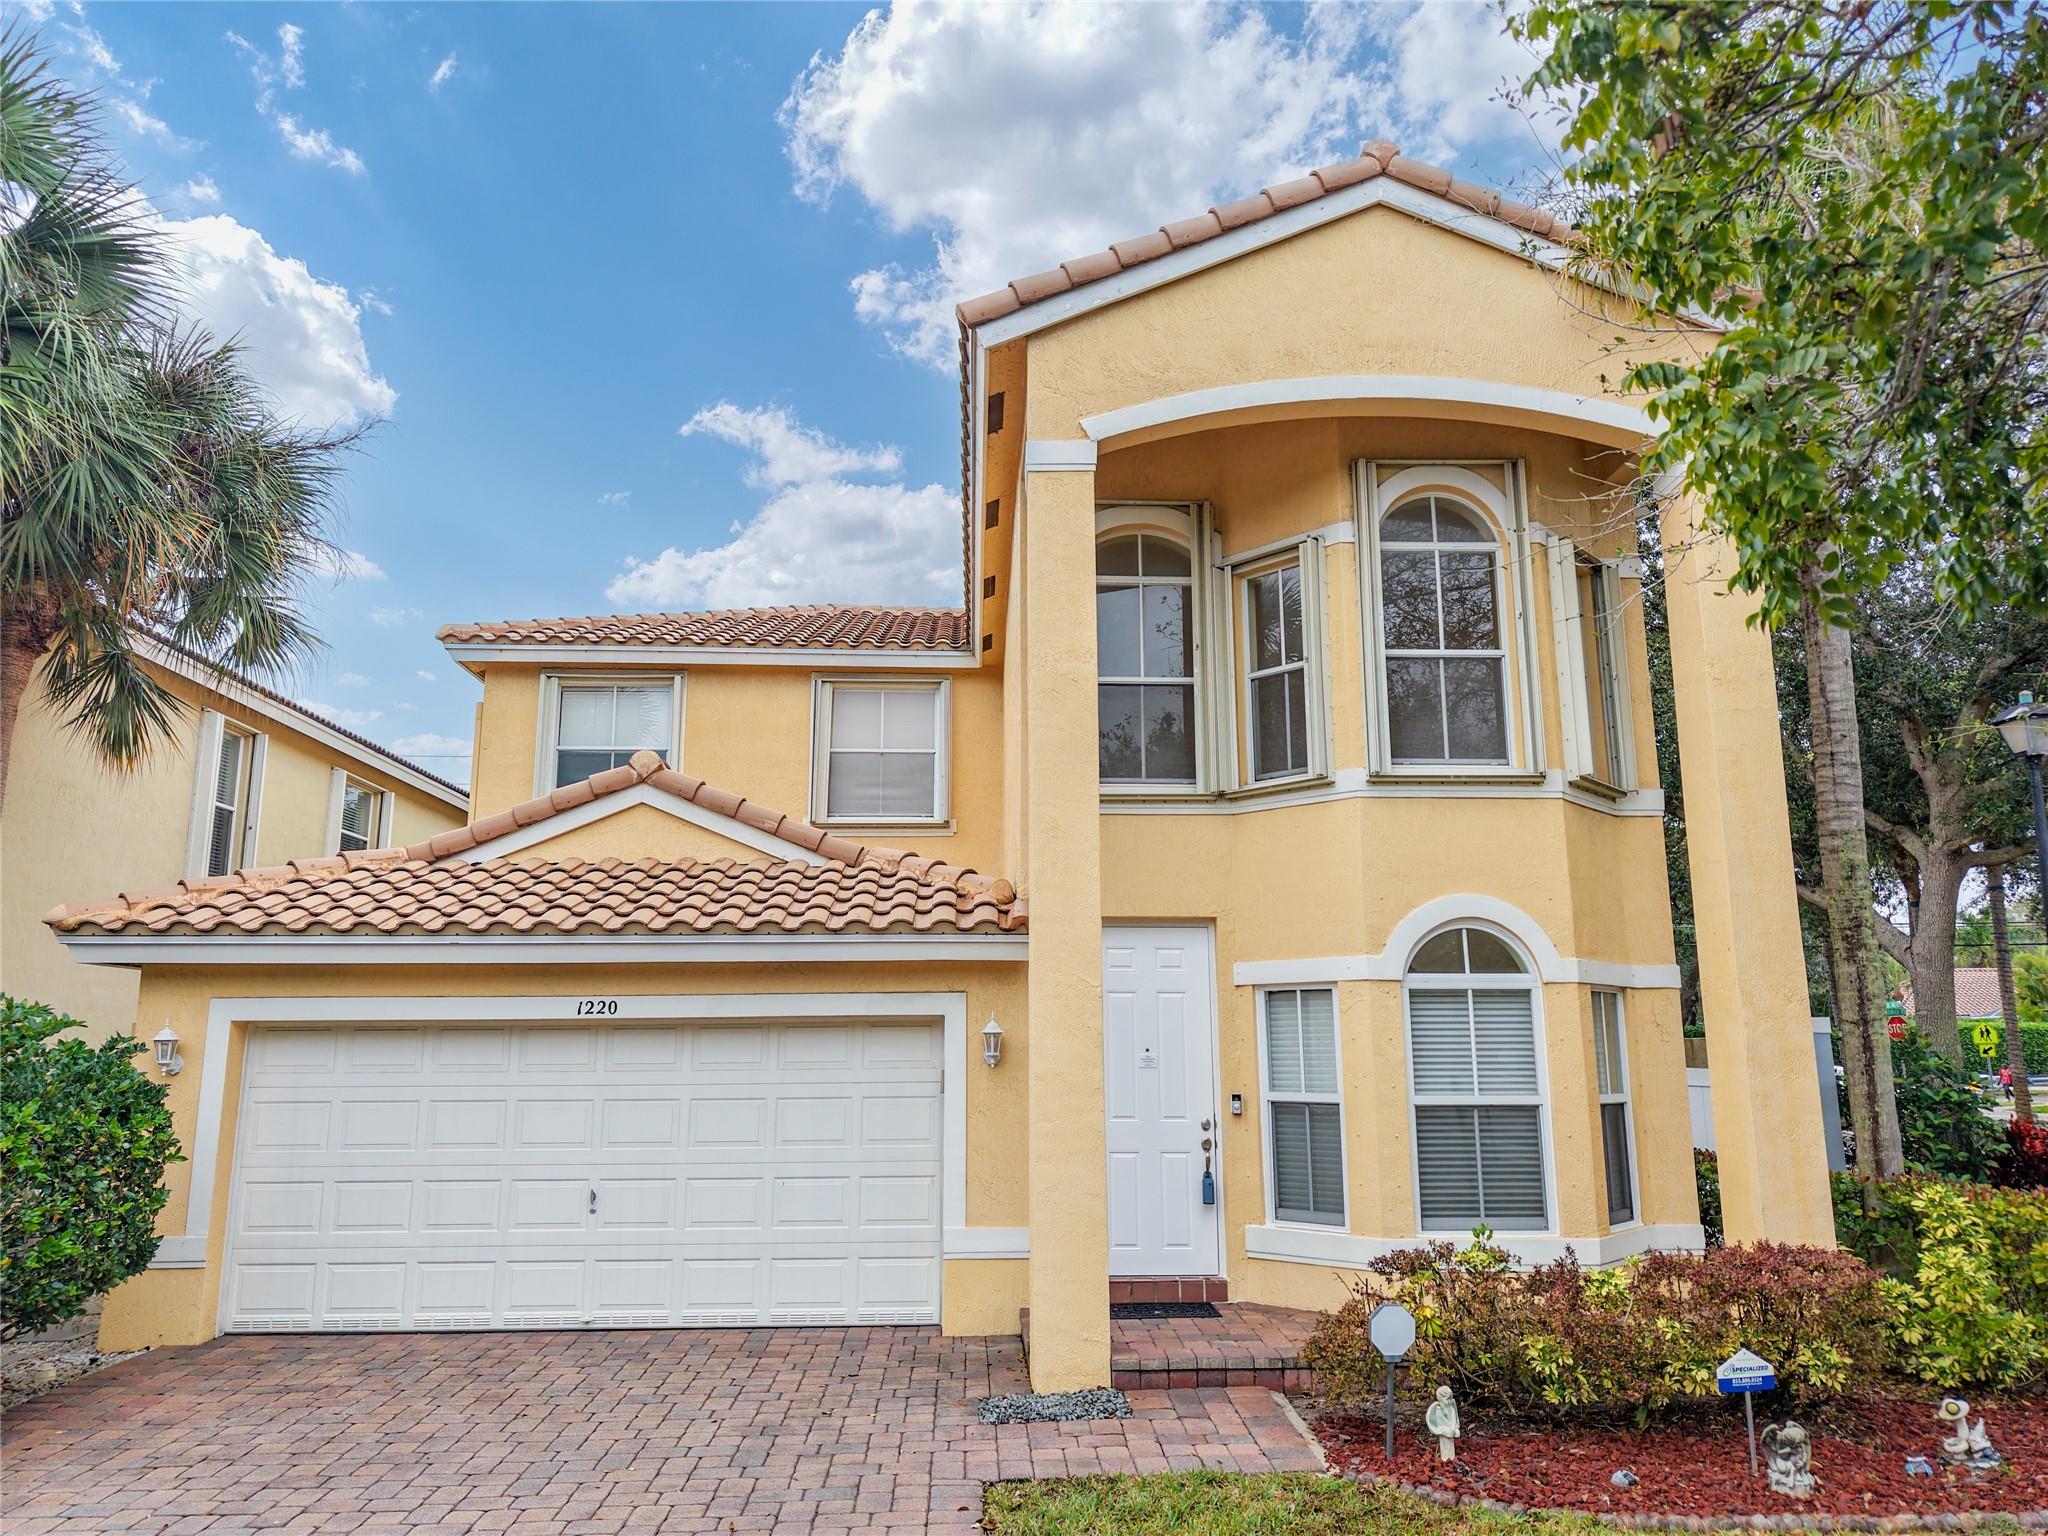
Active
$625,000
4
bds
|
3
ba
|
2,187
sqft
|
built
2004
1220 W Magnolia Cir, Delray Beach, FL 33445
$-884
Cash flow
-7.4%
Cash-on-Cash Return
4.6%
Cap rate
0.7%
Rent to Value Ratio
Active
$585,000
4
bds
|
3
ba
|
1,825
sqft
|
built
1965
5161 Buchanan Rd, Delray Beach, FL 33484
$-1,339
Cash flow
-11.9%
Cash-on-Cash Return
3.5%
Cap rate
0.5%
Rent to Value Ratio
Active
$1,830,000
3
bds
|
3
ba
|
1,594
sqft
|
built
1957
100 N Ocean Blvd, Delray Beach, FL 33483
$-5,598
Cash flow
-16.0%
Cash-on-Cash Return
2.6%
Cap rate
0.5%
Rent to Value Ratio
Active
$2,195,000
5
bds
|
4
ba
|
2,682
sqft
|
built
2008
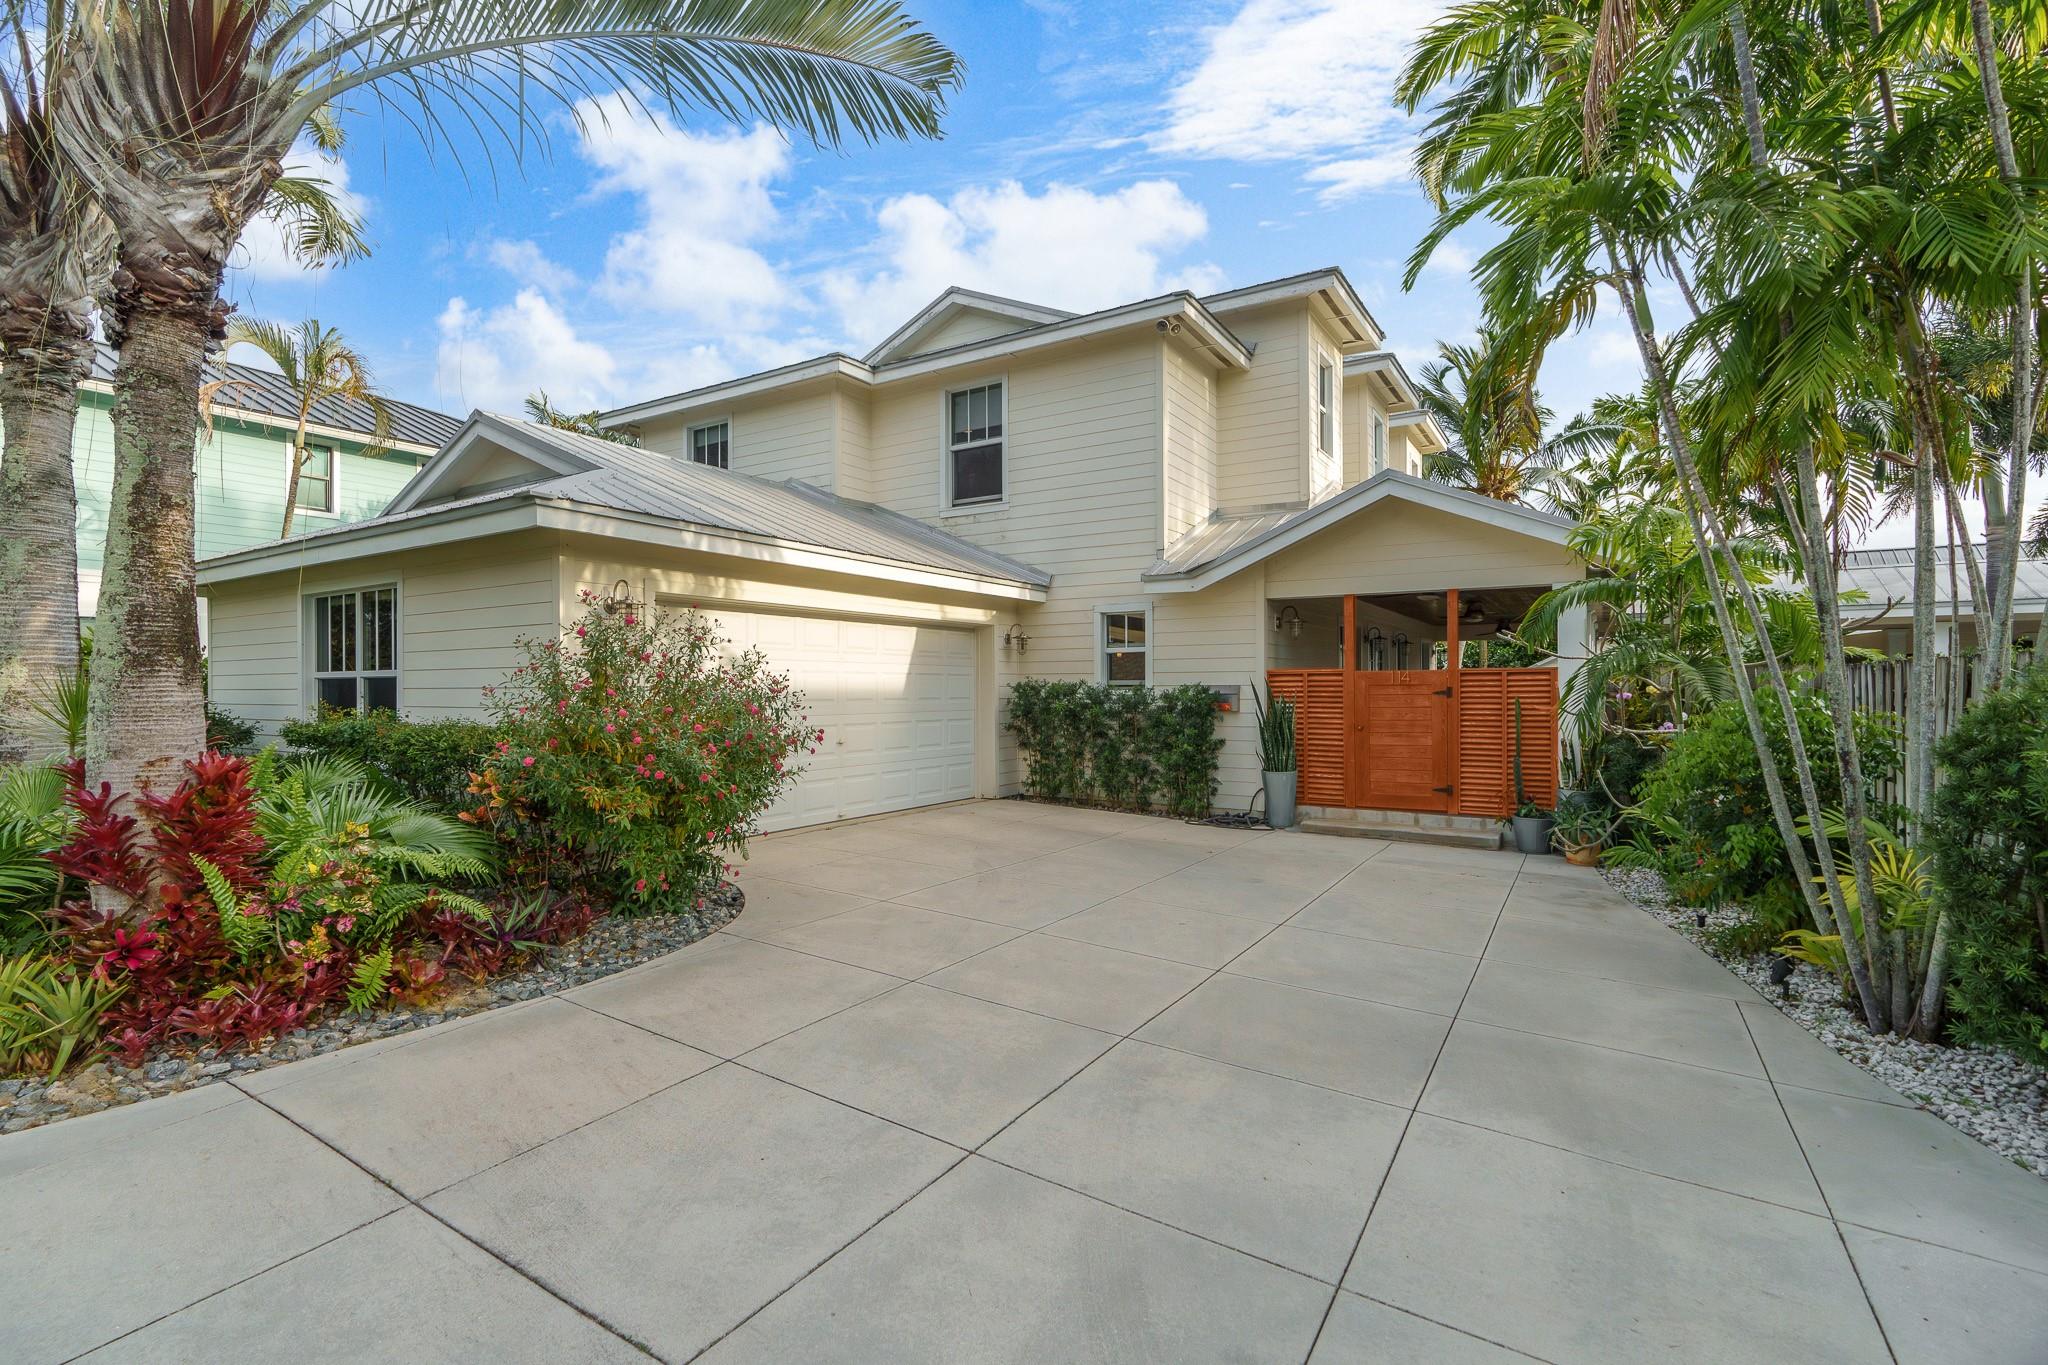
114 NE 10th St, Delray Beach, FL 33444
$-7,308
Cash flow
-17.4%
Cash-on-Cash Return
2.3%
Cap rate
0.3%
Rent to Value Ratio

Active
$890,000
2
bds
|
3
ba
|
1,512
sqft
|
built
1987
240 Captains Walk, Delray Beach, FL 33483
$-3,446
Cash flow
-20.2%
Cash-on-Cash Return
1.6%
Cap rate
0.6%
Rent to Value Ratio
Active
$179,000
2
bds
|
2
ba
|
1,728
sqft
|
built
1985
7509 Glendevon Ln, Delray Beach, FL 33446
$-260
Cash flow
-7.6%
Cash-on-Cash Return
4.5%
Cap rate
1.5%
Rent to Value Ratio
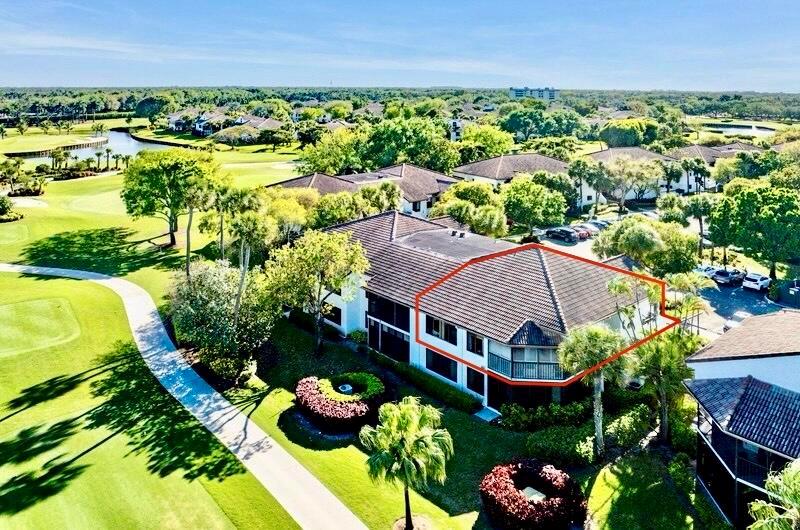
Active
$675,000
3
bds
|
2
ba
|
2,346
sqft
|
built
1997
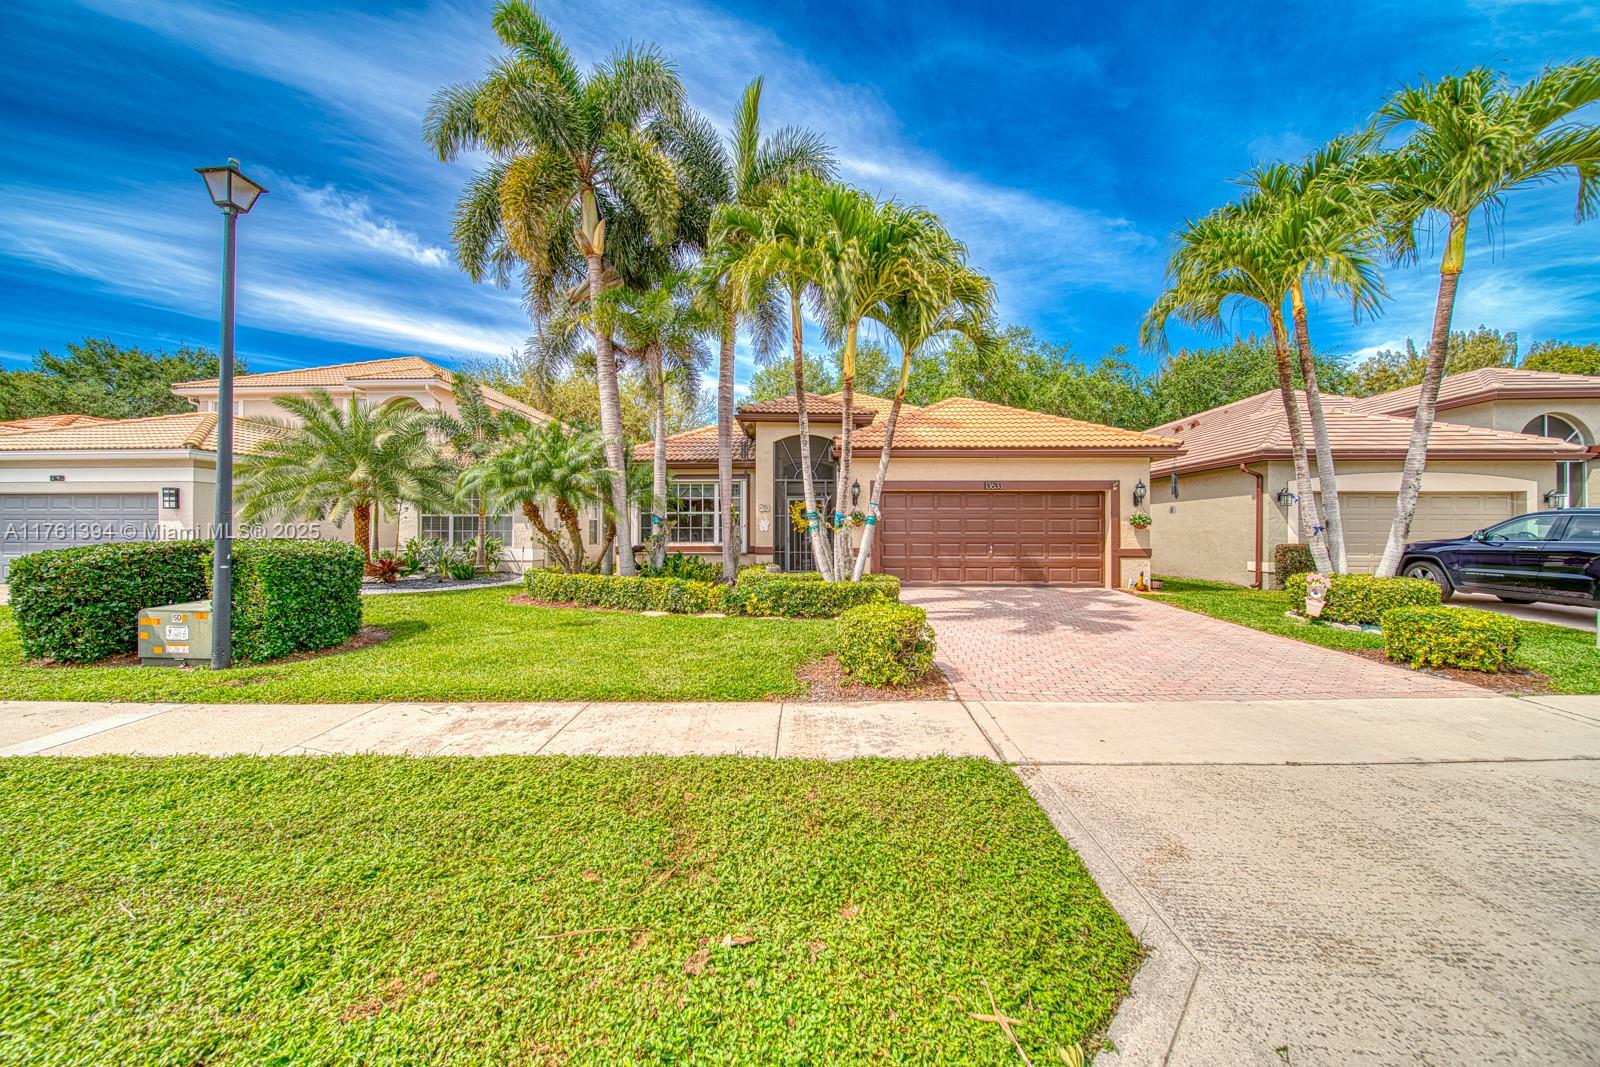
13633 Kiltie Ct, Delray Beach, FL 33446
$-1,560
Cash flow
-12.1%
Cash-on-Cash Return
3.5%
Cap rate
0.7%
Rent to Value Ratio
Active
$235,000
2
bds
|
2
ba
|
1,023
sqft
|
built
1979
2700 Fiore Way, Delray Beach, FL 33445
$-723
Cash flow
-16.1%
Cash-on-Cash Return
2.6%
Cap rate
0.9%
Rent to Value Ratio
Active
$2,249,000
4
bds
|
3
ba
|
2,565
sqft
|
built
1961
425 NW 18th St, Delray Beach, FL 33444
$-5,594
Cash flow
-13.0%
Cash-on-Cash Return
3.3%
Cap rate
0.5%
Rent to Value Ratio
Active
$849,900
2
bds
|
2
ba
|
1,482
sqft
|
built
1970
2200 S Ocean Blvd, Delray Beach, FL 33483
$-3,937
Cash flow
-24.2%
Cash-on-Cash Return
0.7%
Cap rate
0.4%
Rent to Value Ratio
Active
$4,258,000
5
bds
|
5
ba
|
4,100
sqft
|
built
1993
8387 Sawpine Rd, Delray Beach, FL 33446
$-17,383
Cash flow
-21.3%
Cash-on-Cash Return
1.4%
Cap rate
0.2%
Rent to Value Ratio
Active
$264,900
2
bds
|
2
ba
|
978
sqft
|
built
1989
1050 Crystal Way, Delray Beach, FL 33444
$-666
Cash flow
-13.1%
Cash-on-Cash Return
3.3%
Cap rate
0.9%
Rent to Value Ratio
Active
$445,000
3
bds
|
3
ba
|
1,500
sqft
|
built
2021
1350 Crystal Way, Delray Beach, FL 33444
$-1,316
Cash flow
-15.4%
Cash-on-Cash Return
2.7%
Cap rate
0.8%
Rent to Value Ratio
Active
$1,190,000
4
bds
|
4
ba
|
3,292
sqft
|
built
2002
3934 Sherwood Blvd, Delray Beach, FL 33445
$-2,748
Cash flow
-12.0%
Cash-on-Cash Return
3.5%
Cap rate
0.5%
Rent to Value Ratio
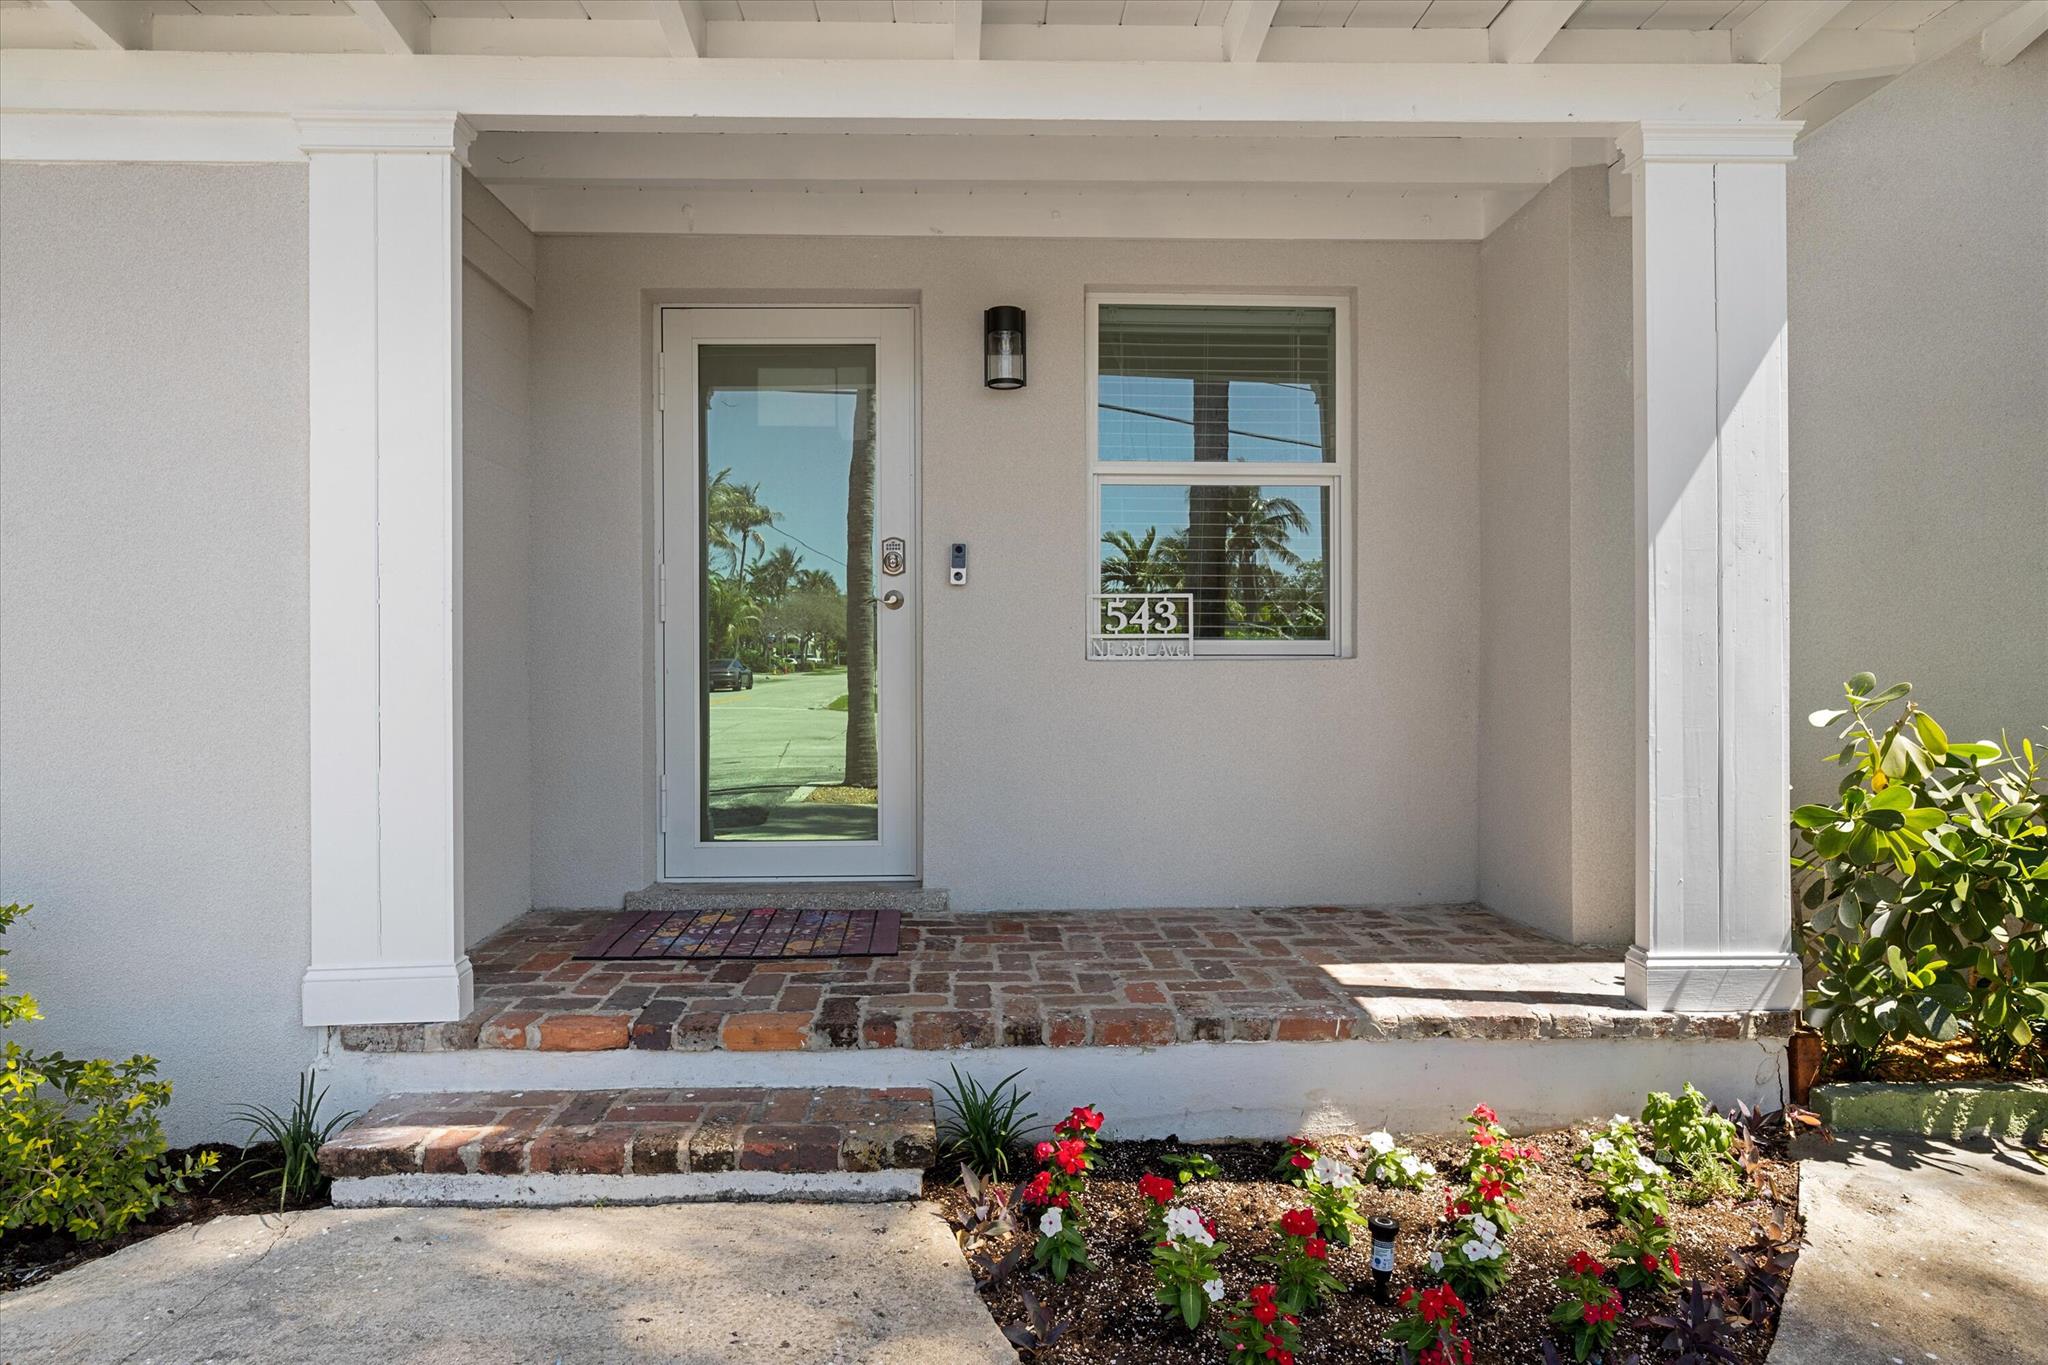
Active
$1,025,000
4
bds
|
2
ba
|
1,200
sqft
|
built
1961
543 NE 3rd Ave, Delray Beach, FL 33444
$-3,362
Cash flow
-17.1%
Cash-on-Cash Return
2.3%
Cap rate
0.4%
Rent to Value Ratio
Active
$1,495,000
4
bds
|
3
ba
|
1,983
sqft
|
built
1949
108 NW 4th Ave, Delray Beach, FL 33444
$-6,368
Cash flow
-22.2%
Cash-on-Cash Return
1.2%
Cap rate
0.2%
Rent to Value Ratio
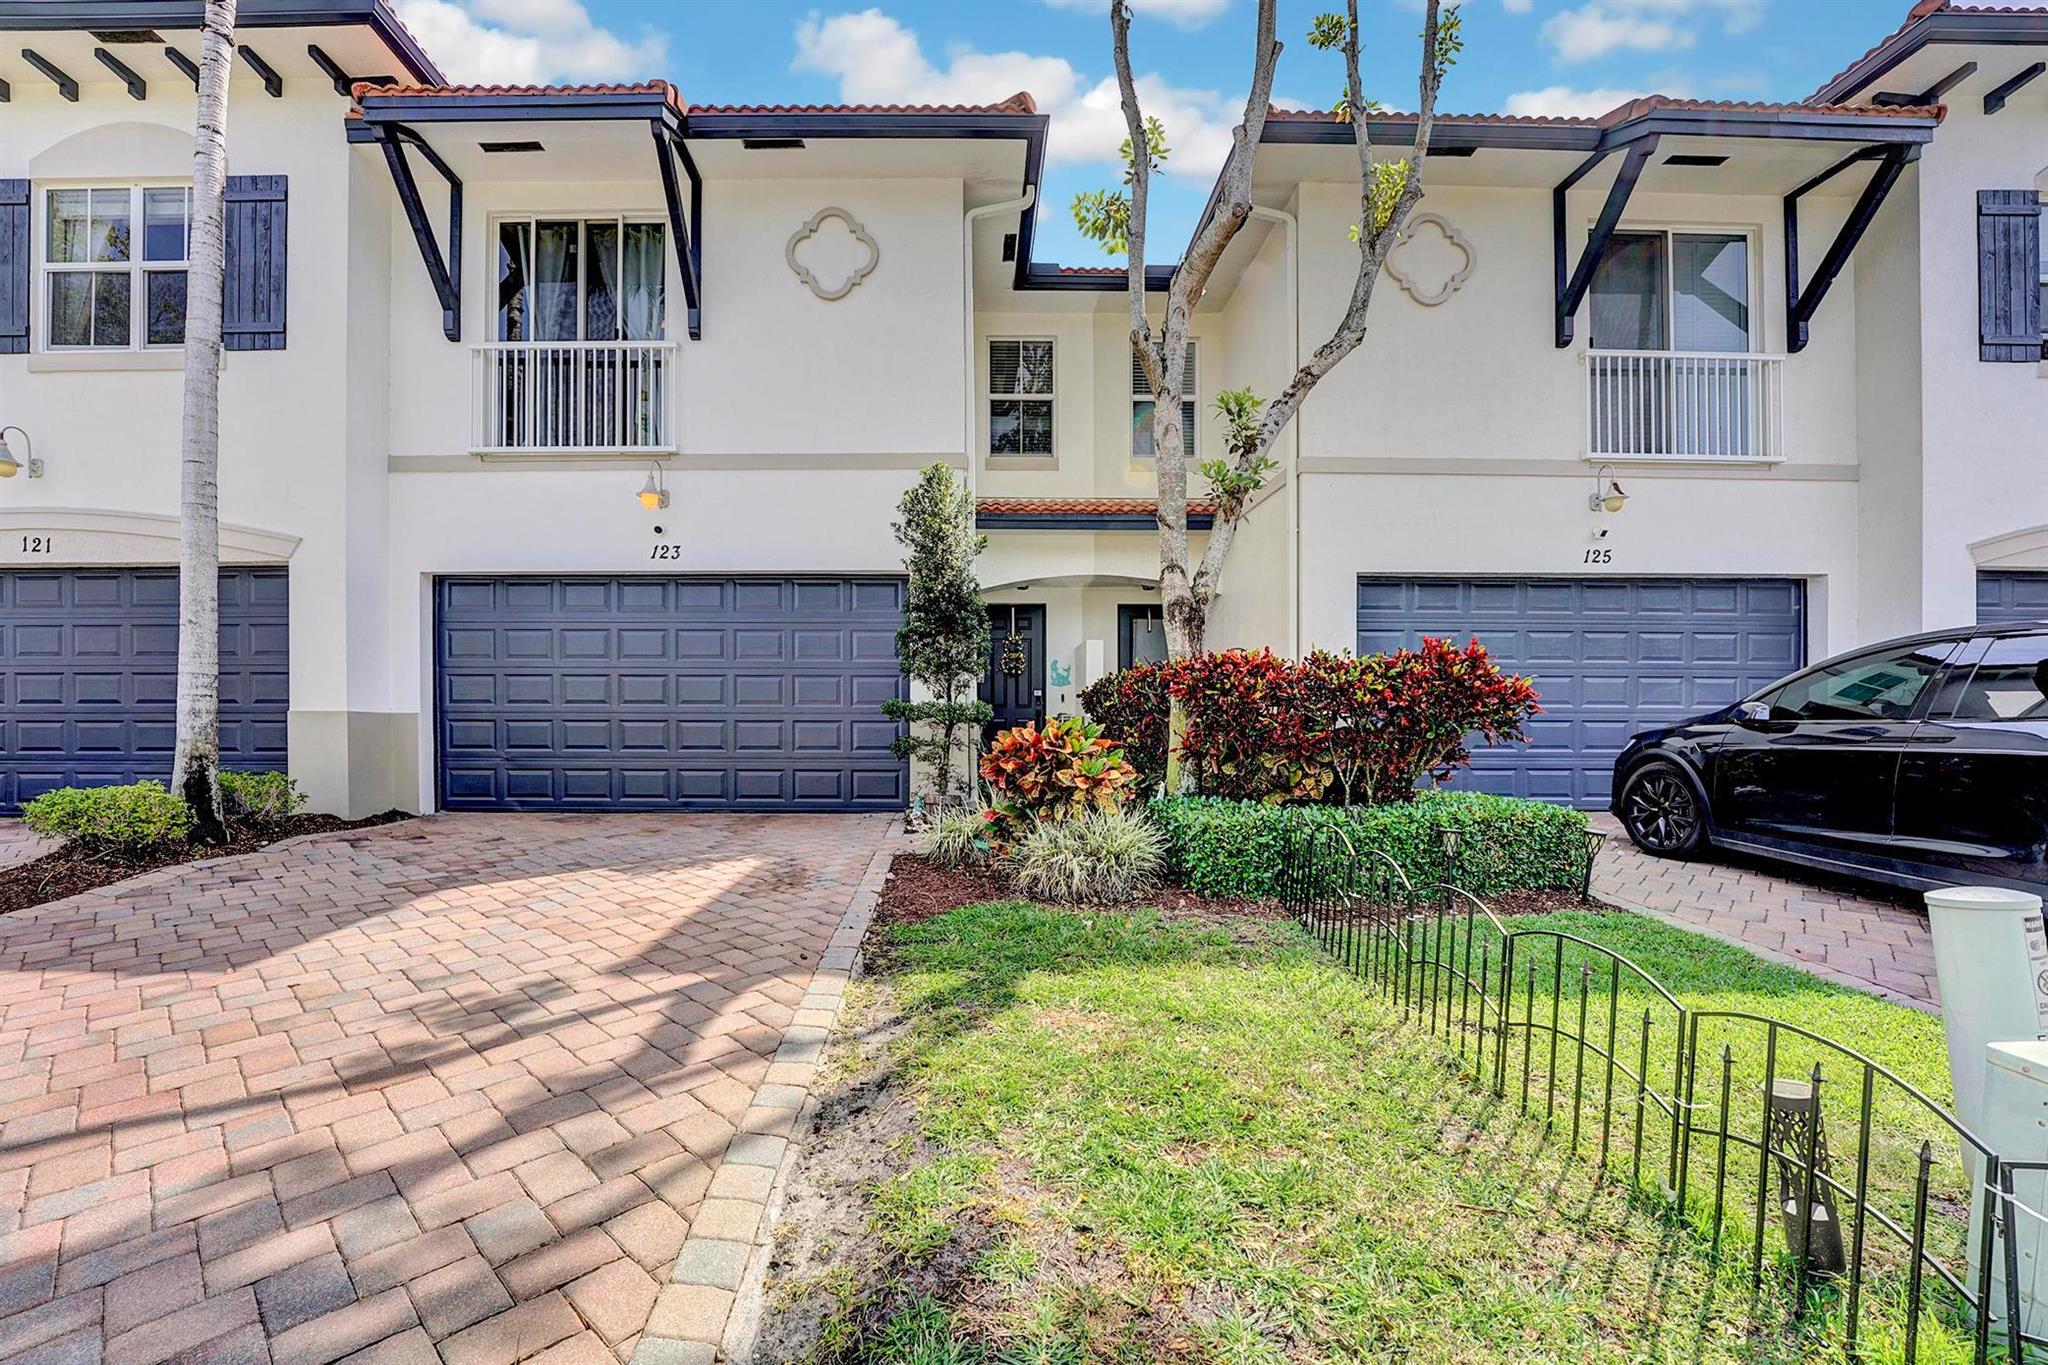
Active
$618,000
3
bds
|
3
ba
|
1,846
sqft
|
built
2012
123 E Prive Cir, Delray Beach, FL 33445
$-1,352
Cash flow
-11.4%
Cash-on-Cash Return
3.7%
Cap rate
0.6%
Rent to Value Ratio
Active
$2,175,000
3
bds
|
3
ba
|
2,215
sqft
|
built
1957
801 NW 4th Ave, Delray Beach, FL 33444
$-8,229
Cash flow
-19.7%
Cash-on-Cash Return
1.7%
Cap rate
0.3%
Rent to Value Ratio
Active
$1,499,000
3
bds
|
3
ba
|
2,122
sqft
|
built
2006
200 NE 2nd Ave, Delray Beach, FL 33444
$-6,594
Cash flow
-23.0%
Cash-on-Cash Return
1.0%
Cap rate
0.4%
Rent to Value Ratio