Delray Beach, FL Investment Properties for Sale
Browse homes for sale and investment properties in Delray Beach, FL. Refine your search by price, property type, or more.
Best cash flowing properties in Delray Beach, FL
Active
$189,000
2
bds
|
2
ba
|
1,311
sqft
|
built
1985
7485 Glendevon Ln, Delray Beach, FL 33446
$370
Cash flow
10.2%
Cash-on-Cash Return
8.5%
Cap rate
1.7%
Rent to Value Ratio
Active
$529,900
1
bds
|
1
ba
|
570
sqft
|
built
1950
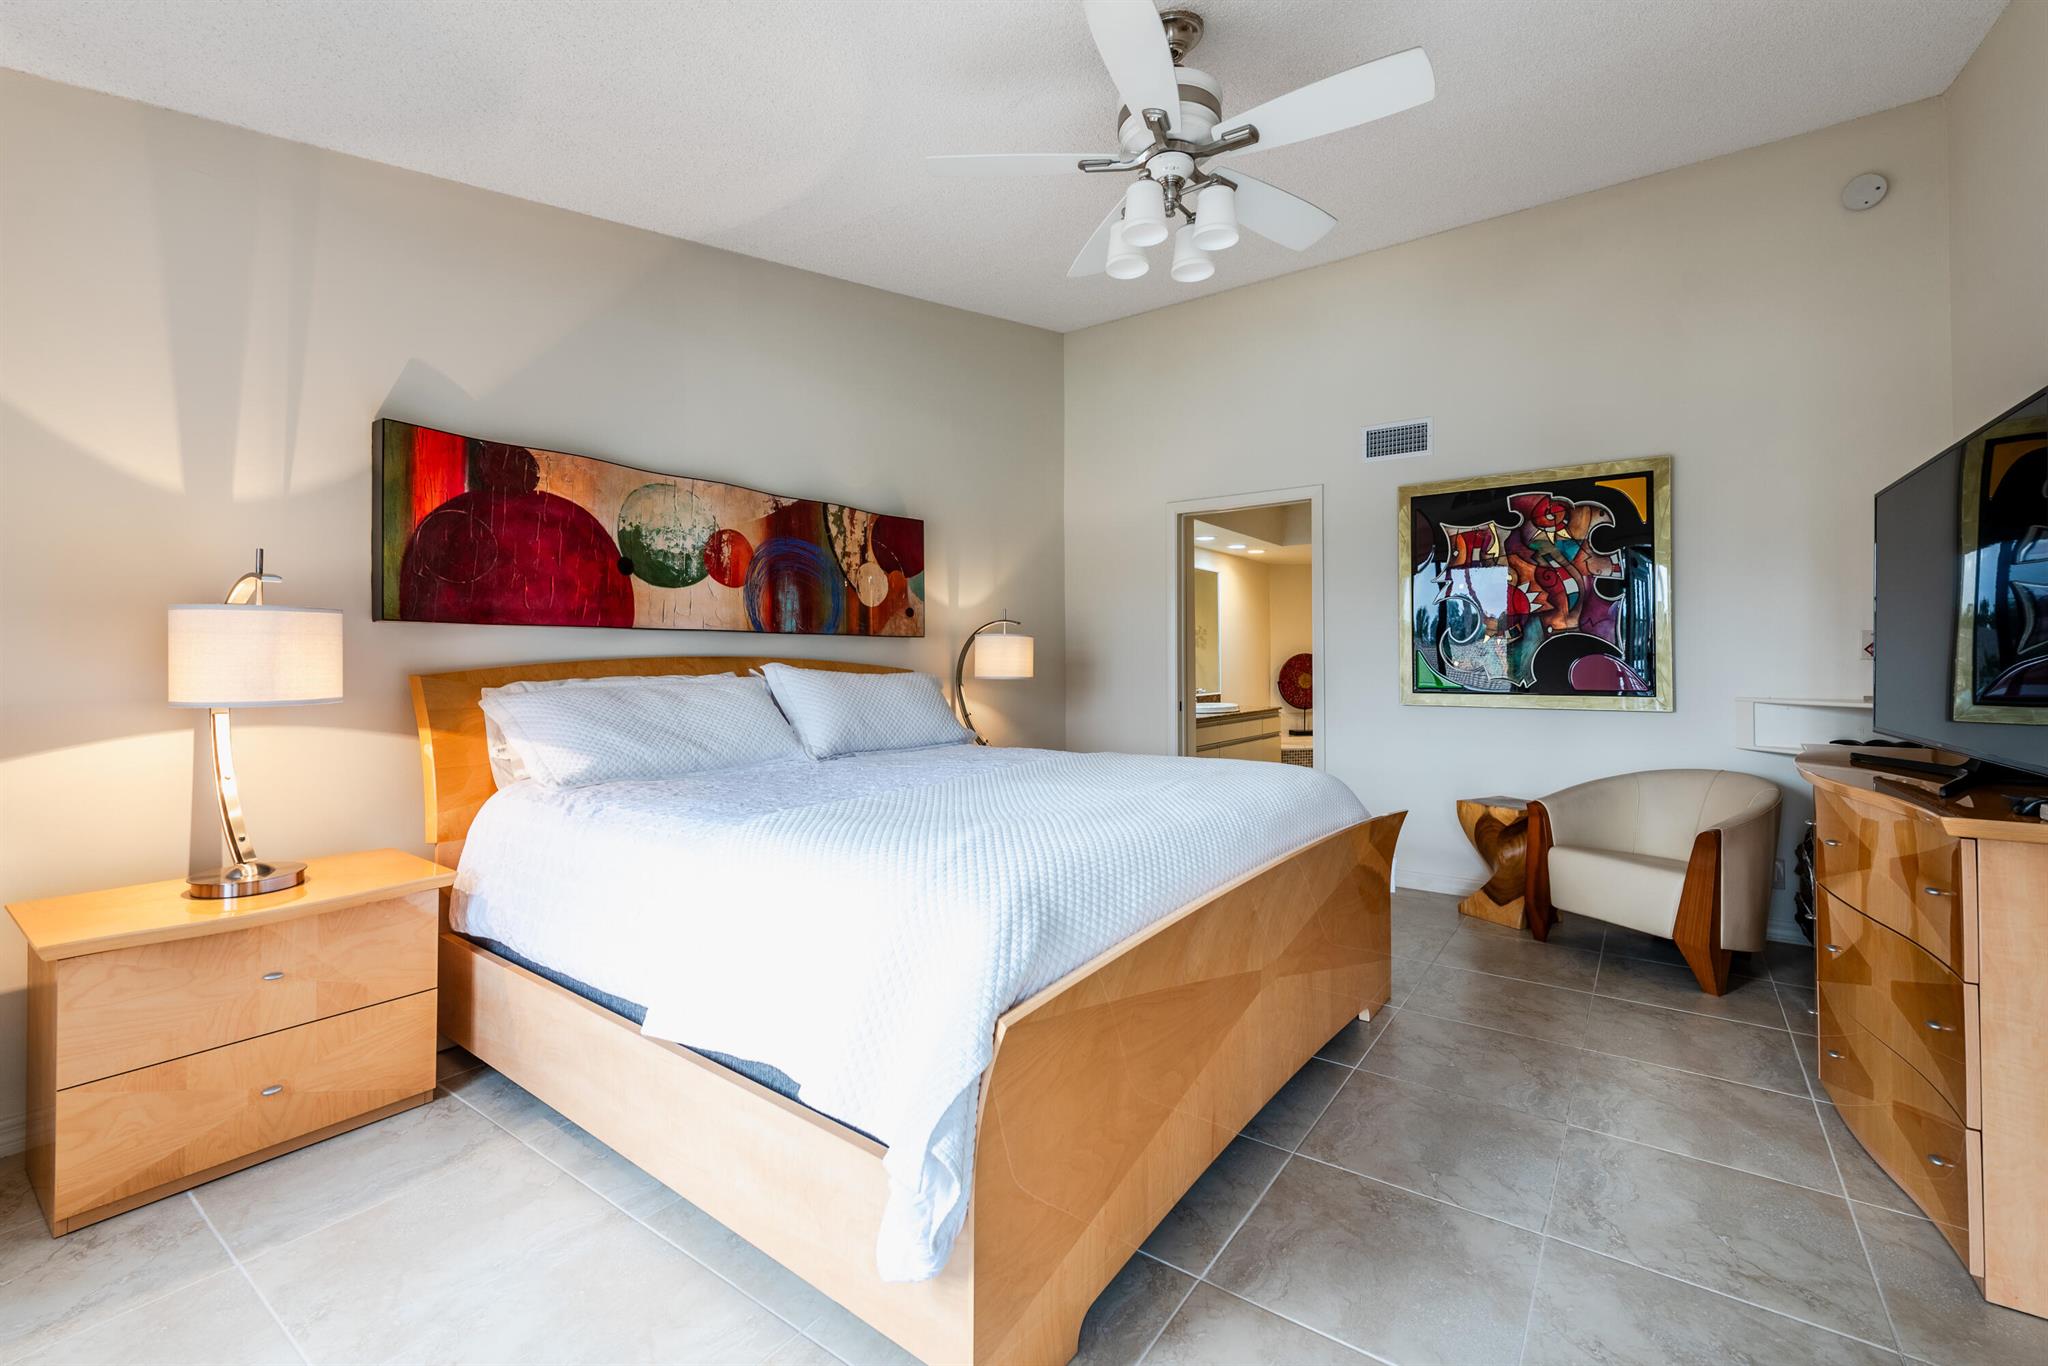
1006 Casuarina Rd, Delray Beach, FL 33483
$-145
Cash flow
-1.4%
Cash-on-Cash Return
5.8%
Cap rate
1.0%
Rent to Value Ratio
638 out of 736 properties for sale in Delray Beach, FL
Limited Results Shown
Create a free account, or log in to reveal all property listings and enjoy the complete experience.
Active
$1,390,000
3
bds
|
2
ba
|
1,605
sqft
|
built
1970
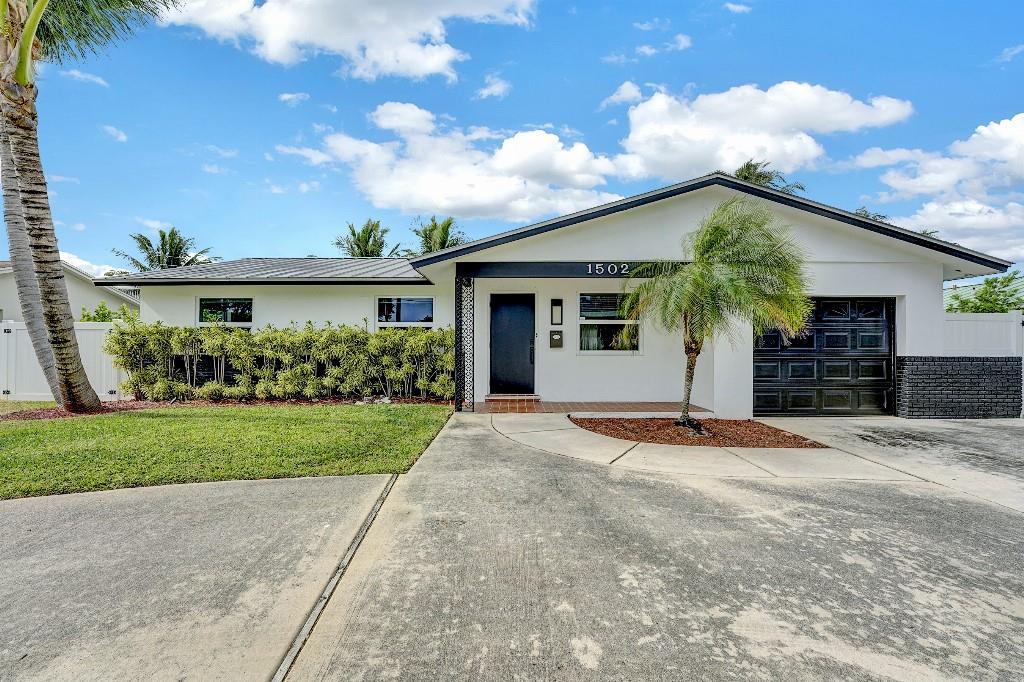
1502 NW 4th Ave, Delray Beach, FL 33444
$-3,761
Cash flow
-14.1%
Cash-on-Cash Return
2.9%
Cap rate
0.5%
Rent to Value Ratio
Active
$1,875,000
3
bds
|
3
ba
|
2,100
sqft
|
built
1956
2122 Northridge Rd, Delray Beach, FL 33444
$-4,839
Cash flow
-13.5%
Cash-on-Cash Return
3.1%
Cap rate
0.5%
Rent to Value Ratio
Active
$7,600,000
3
bds
|
4
ba
|
3,481
sqft
|
built
2012
975 Banyan Dr, Delray Beach, FL 33483
$-38,780
Cash flow
-26.6%
Cash-on-Cash Return
0.0%
Cap rate
0.1%
Rent to Value Ratio
Active
$337,700
1
bds
|
2
ba
|
1,100
sqft
|
built
1973
2525 Florida Blvd, Delray Beach, FL 33483
$-738
Cash flow
-11.4%
Cash-on-Cash Return
3.5%
Cap rate
0.8%
Rent to Value Ratio
Active
$2,800,000
5
bds
|
5
ba
|
4,257
sqft
|
built
1981
4246 Live Oak Blvd, Delray Beach, FL 33445
$-8,214
Cash flow
-15.3%
Cash-on-Cash Return
2.6%
Cap rate
0.4%
Rent to Value Ratio
Active
$799,000
3
bds
|
2
ba
|
1,655
sqft
|
built
1979
2482 Sundy Ave, Delray Beach, FL 33444
$-749
Cash flow
-4.9%
Cash-on-Cash Return
5.0%
Cap rate
0.7%
Rent to Value Ratio
Active
$980,000
2
bds
|
1
ba
|
951
sqft
|
built
1957
621 NE 3rd Ave, Delray Beach, FL 33444
$-4,142
Cash flow
-22.1%
Cash-on-Cash Return
1.1%
Cap rate
0.2%
Rent to Value Ratio
Active
$189,000
2
bds
|
2
ba
|
1,311
sqft
|
built
1985
7485 Glendevon Ln, Delray Beach, FL 33446
$370
Cash flow
10.2%
Cash-on-Cash Return
8.5%
Cap rate
1.7%
Rent to Value Ratio
Active
$1,800,000
2
bds
|
2
ba
|
1,476
sqft
|
built
1952
2610 Seacrest Blvd, Delray Beach, FL 33444
$-4,440
Cash flow
-12.9%
Cash-on-Cash Return
3.2%
Cap rate
0.4%
Rent to Value Ratio
Active
$1,350,000
3
bds
|
2
ba
|
1,813
sqft
|
built
1958
8 NE 17th St, Delray Beach, FL 33444
$-3,538
Cash flow
-13.7%
Cash-on-Cash Return
3.0%
Cap rate
0.5%
Rent to Value Ratio
Active
$949,000
3
bds
|
3
ba
|
2,026
sqft
|
built
1986
3501 Harbor Cir, Delray Beach, FL 33483
$-2,071
Cash flow
-11.4%
Cash-on-Cash Return
3.5%
Cap rate
0.6%
Rent to Value Ratio
Active
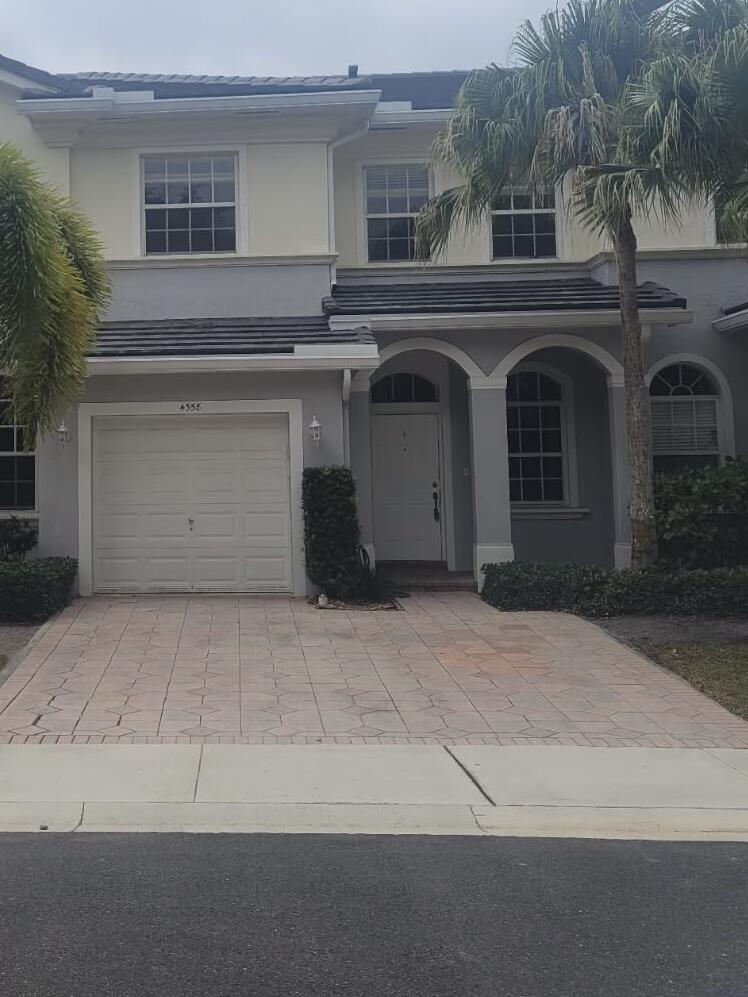
$455,000
3
bds
|
3
ba
|
1,584
sqft
|
built
2003
4358 Legacy Ct, Delray Beach, FL 33445
$-1,003
Cash flow
-11.5%
Cash-on-Cash Return
3.5%
Cap rate
0.7%
Rent to Value Ratio
Active
$1,675,000
3
bds
|
4
ba
|
3,352
sqft
|
built
2014
16796 Charles River Dr, Delray Beach, FL 33446
$-4,912
Cash flow
-15.3%
Cash-on-Cash Return
2.6%
Cap rate
0.5%
Rent to Value Ratio
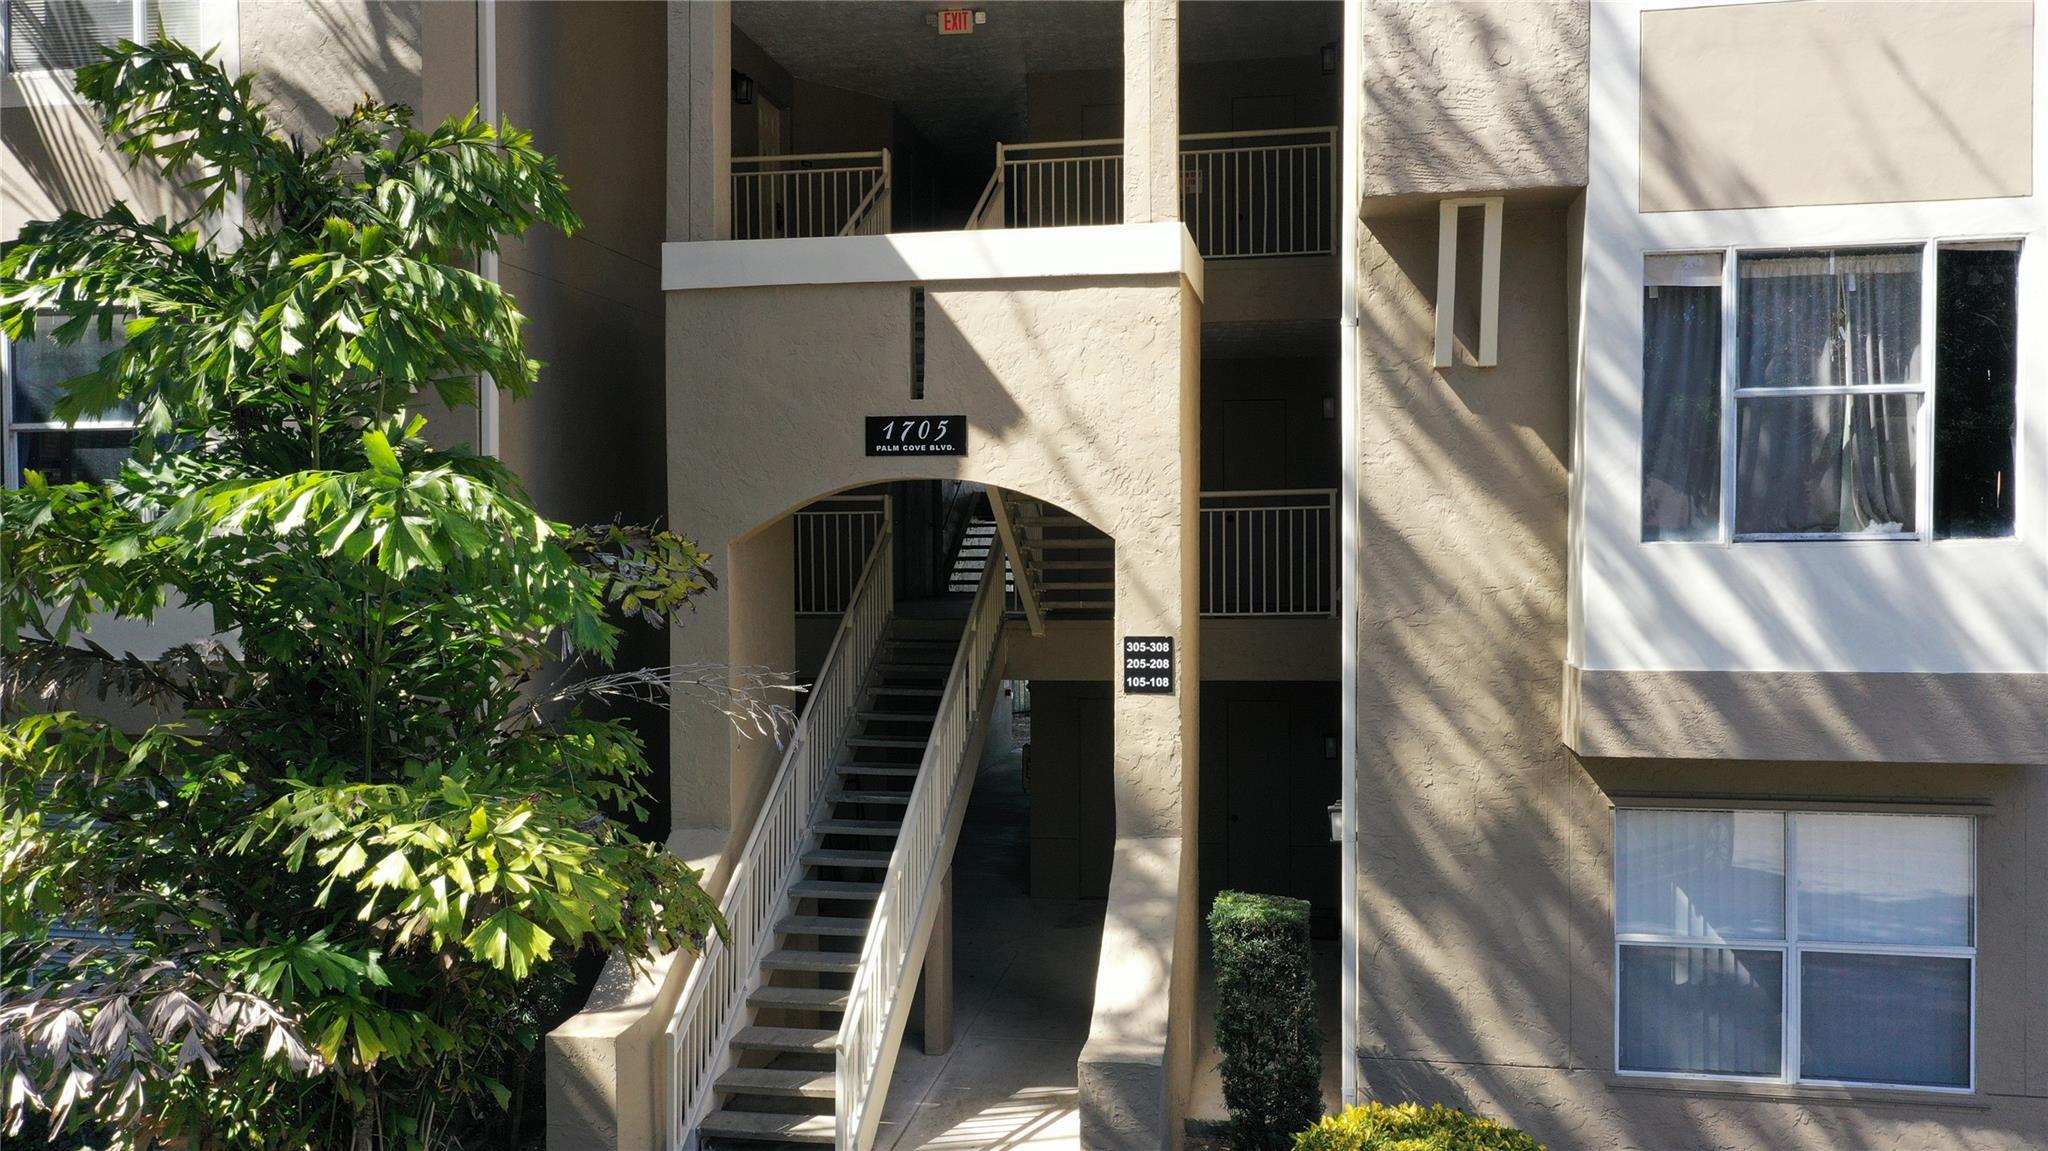
Active
$264,900
2
bds
|
2
ba
|
1,009
sqft
|
built
1992
1705 Palm Cove Blvd, Delray Beach, FL 33445
$-783
Cash flow
-15.4%
Cash-on-Cash Return
2.6%
Cap rate
0.8%
Rent to Value Ratio
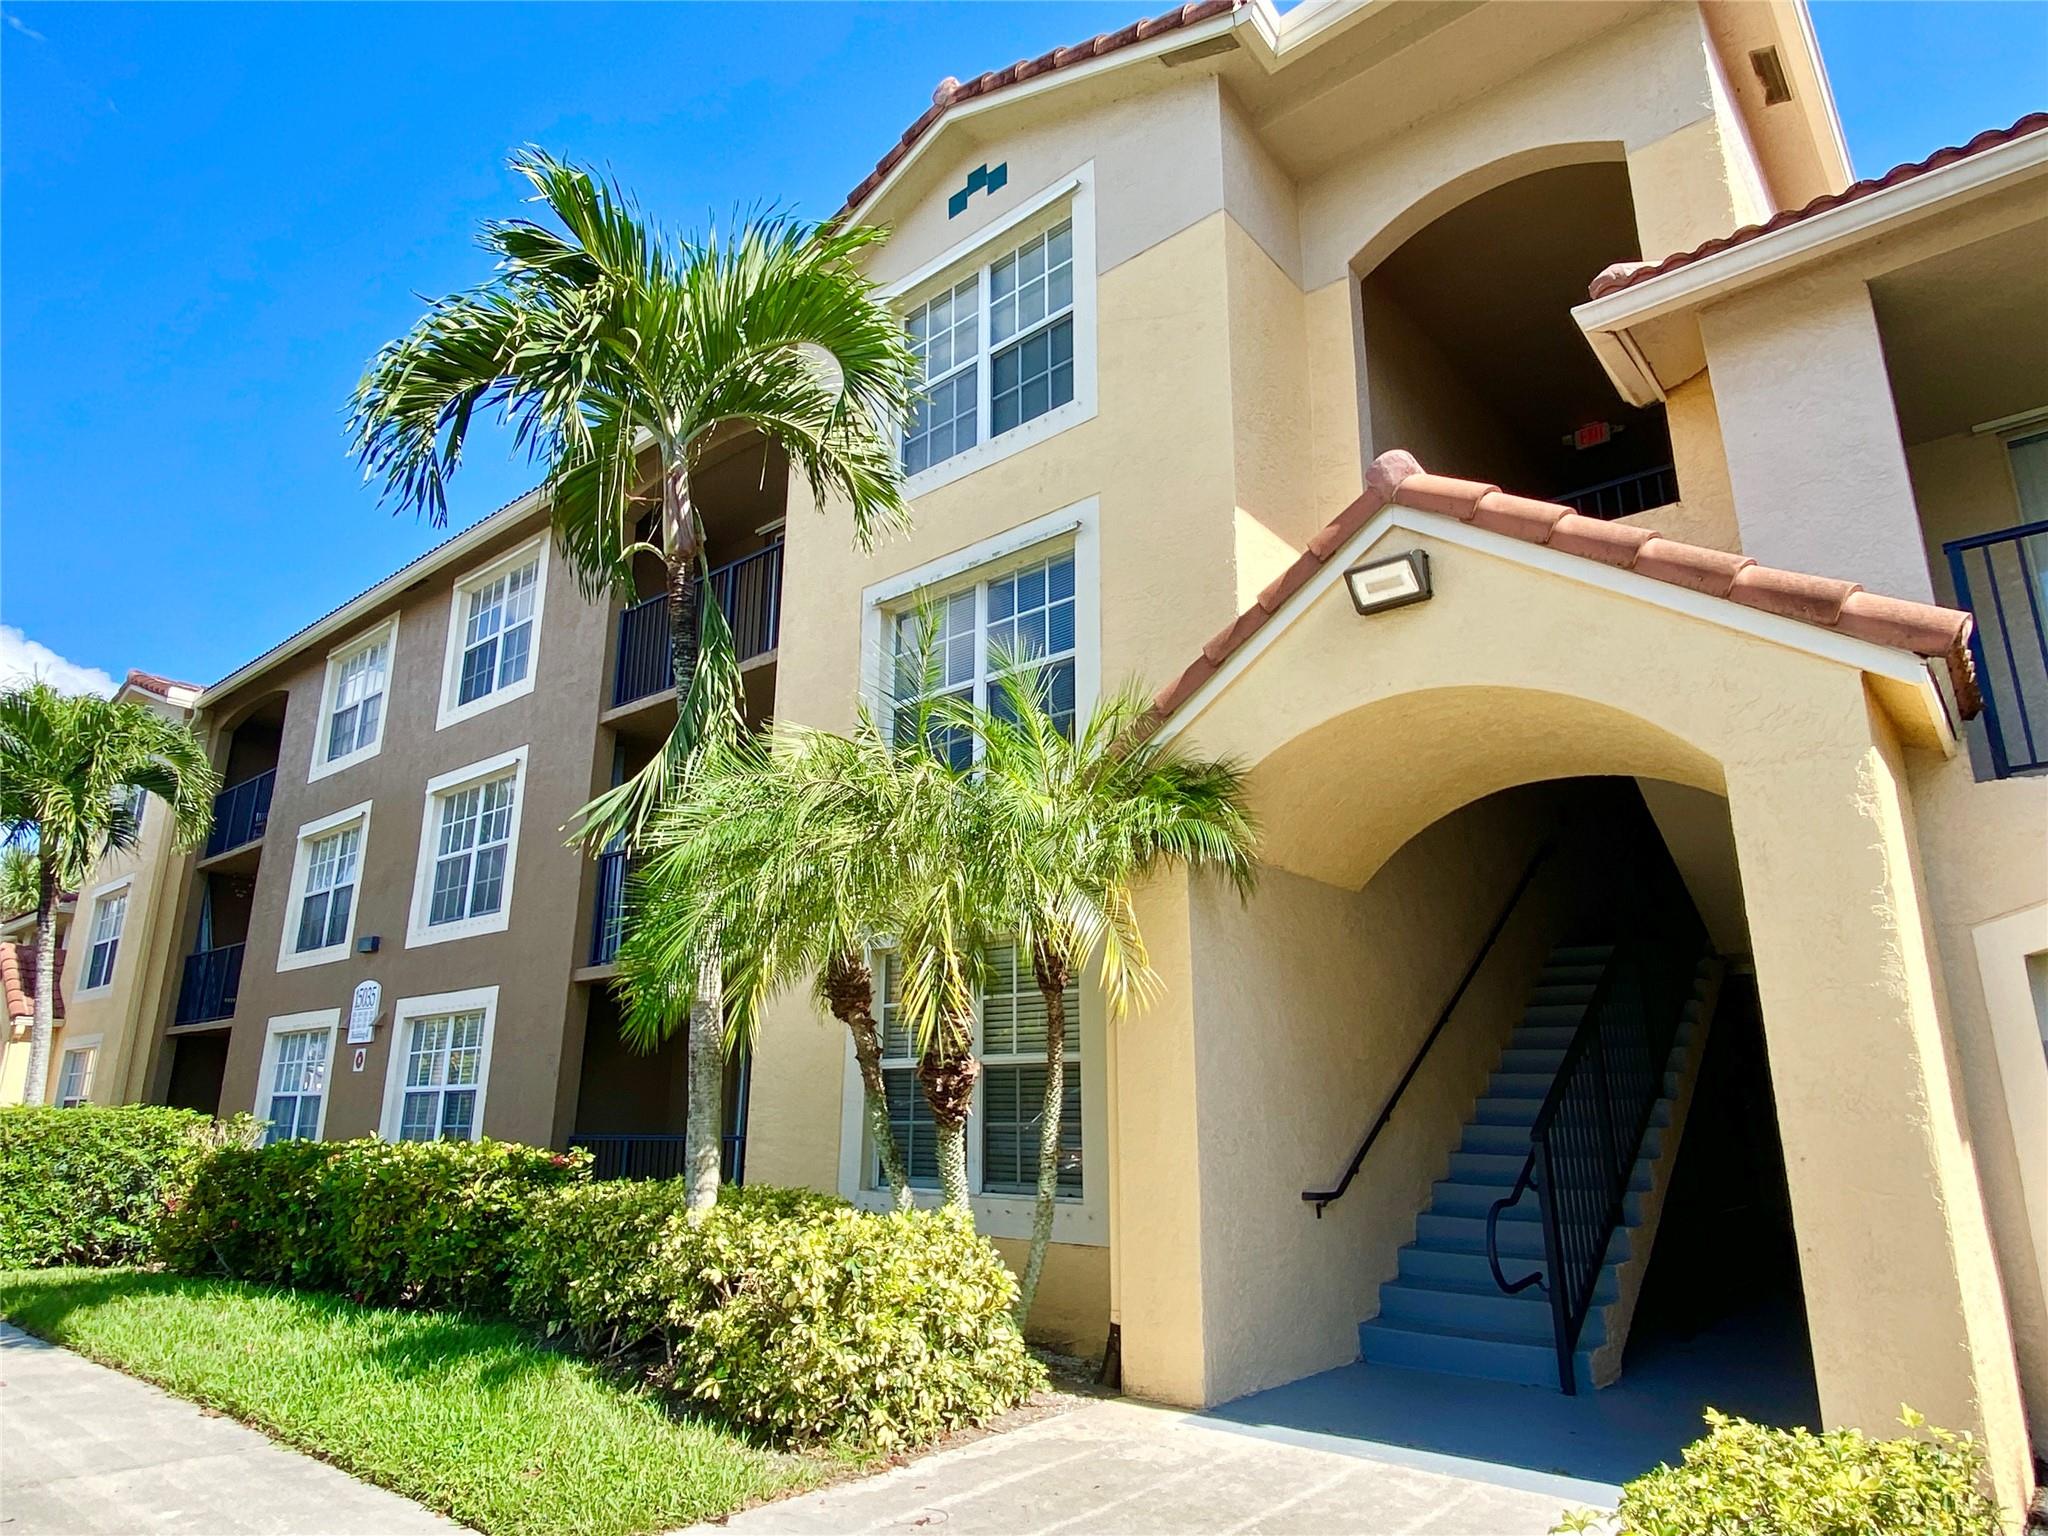
Active
$290,000
2
bds
|
2
ba
|
1,145
sqft
|
built
2001
15095 Michelangelo Blvd, Delray Beach, FL 33446
$-536
Cash flow
-9.6%
Cash-on-Cash Return
3.9%
Cap rate
0.8%
Rent to Value Ratio
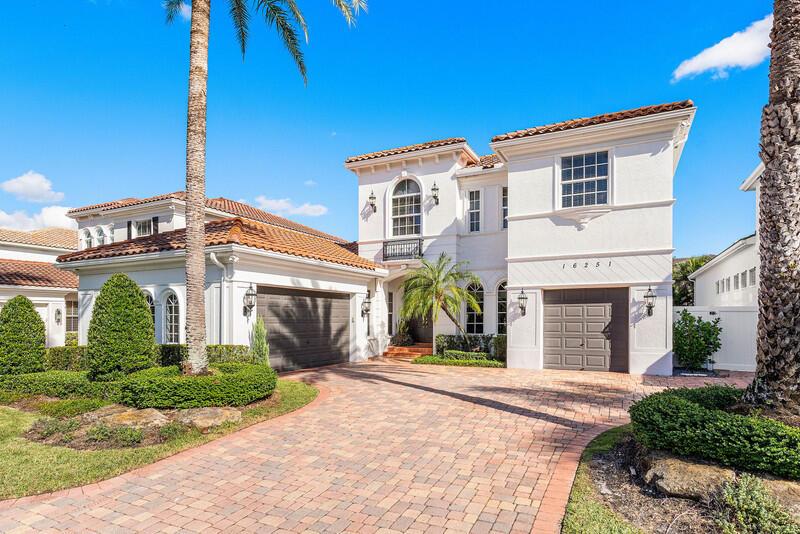
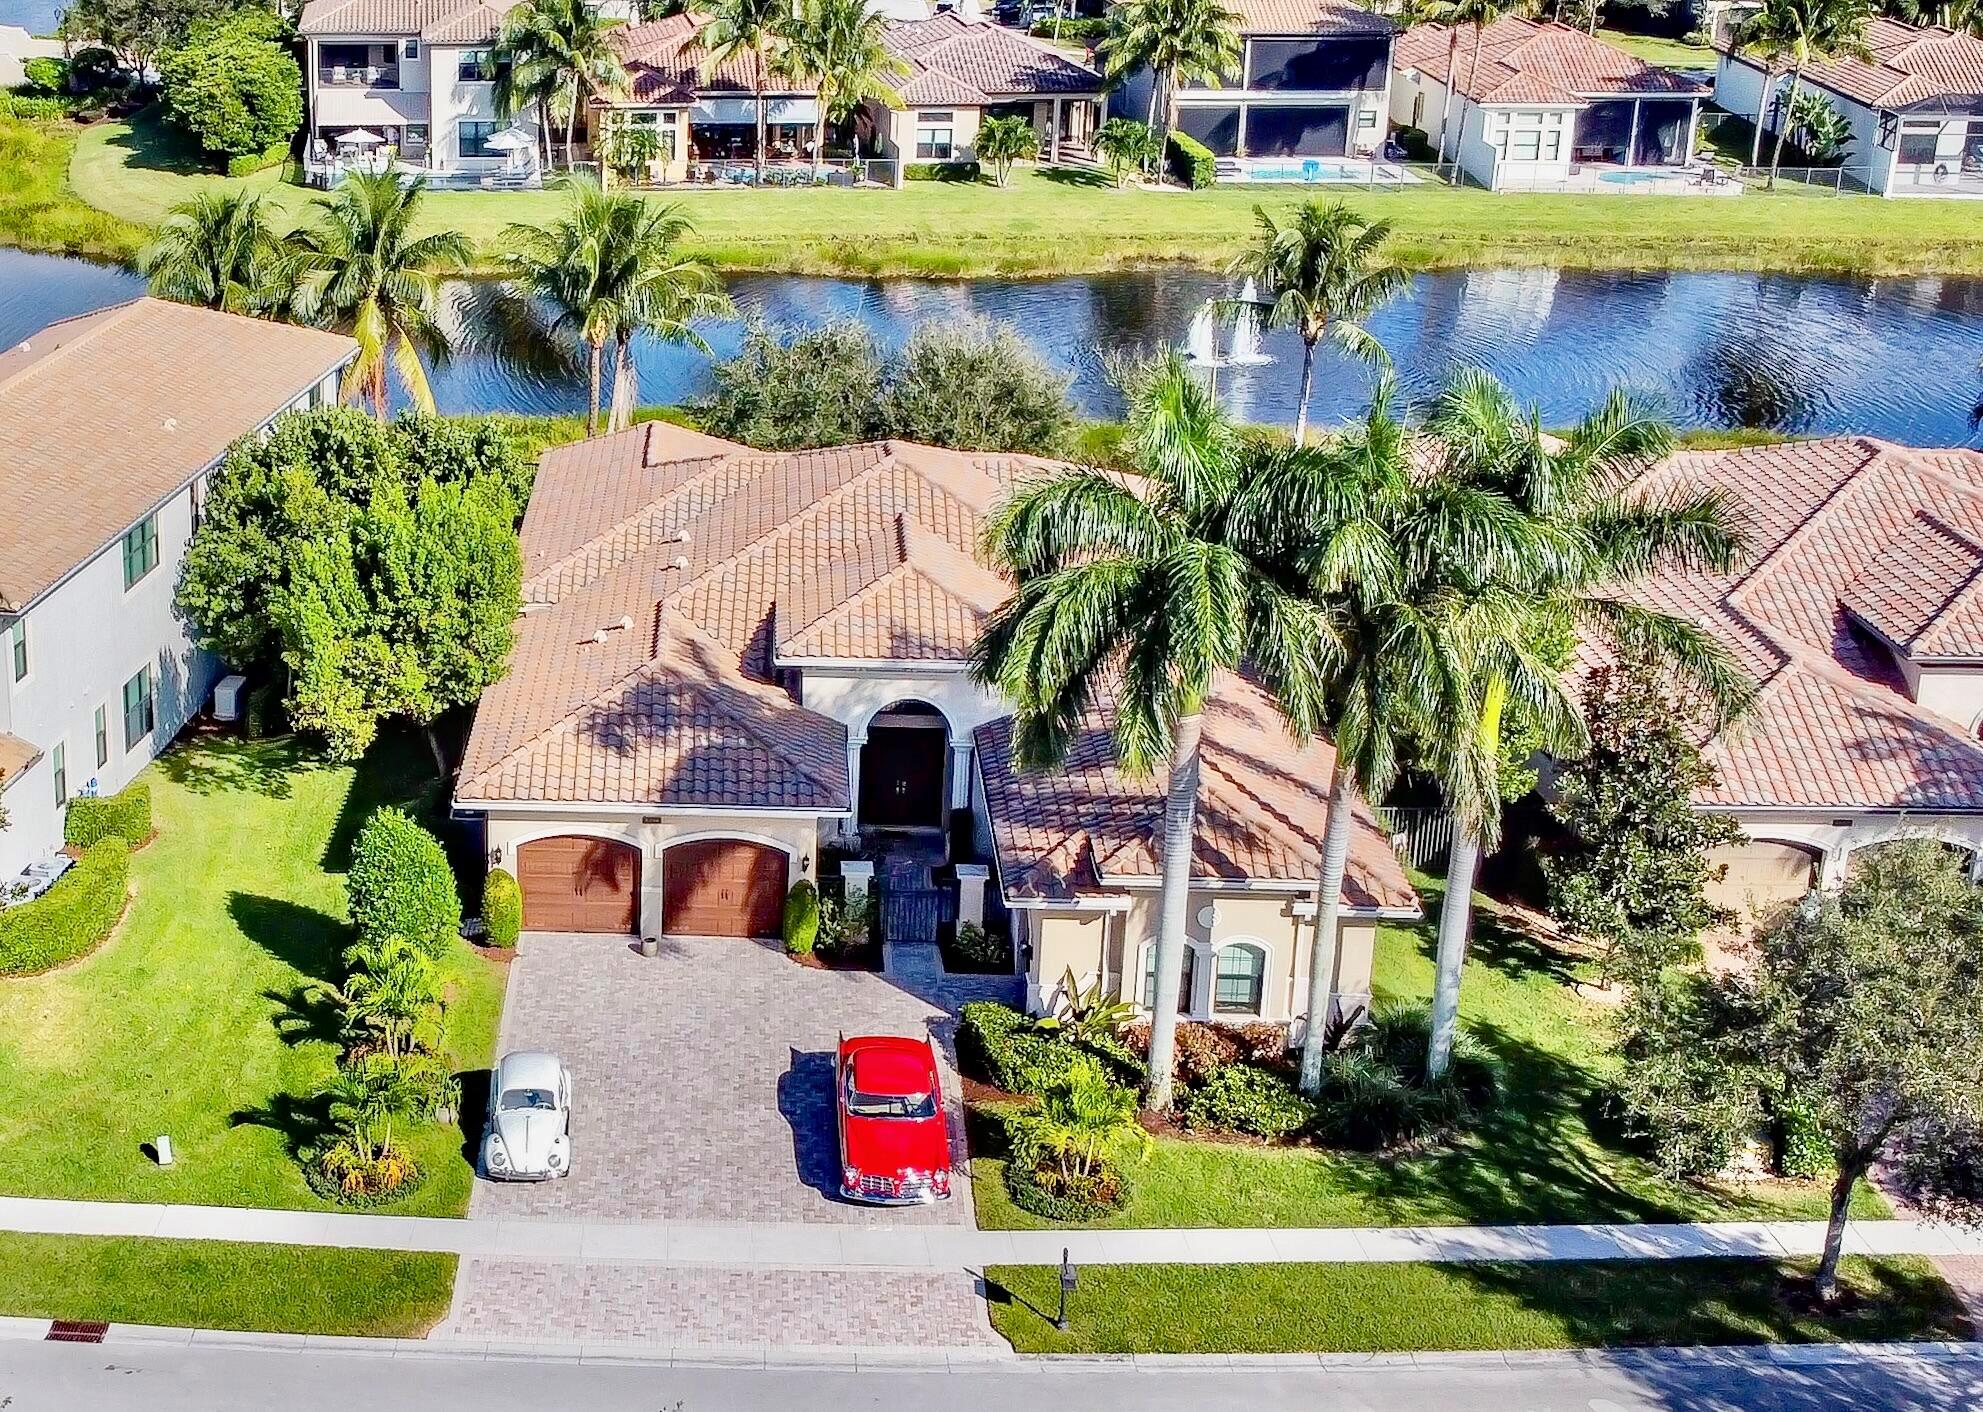
Active
$1,650,000
4
bds
|
5
ba
|
4,040
sqft
|
built
2002
16251 Bristol Pointe Dr, Delray Beach, FL 33446
$-4,113
Cash flow
-13.0%
Cash-on-Cash Return
3.2%
Cap rate
0.5%
Rent to Value Ratio
Active
$174,900
2
bds
|
2
ba
|
1,070
sqft
|
built
1981
14360 Strathmore Ln, Delray Beach, FL 33446
$-707
Cash flow
-21.1%
Cash-on-Cash Return
1.3%
Cap rate
1.0%
Rent to Value Ratio
Active
$309,000
1
bds
|
1
ba
|
934
sqft
|
built
2002
2058 Alta Meadows Ln, Delray Beach, FL 33444
$-667
Cash flow
-11.3%
Cash-on-Cash Return
3.6%
Cap rate
0.7%
Rent to Value Ratio
Active
$949,000
2
bds
|
2
ba
|
1,262
sqft
|
built
2006
200 NE 2nd Ave, Delray Beach, FL 33444
$-2,596
Cash flow
-14.3%
Cash-on-Cash Return
2.9%
Cap rate
0.6%
Rent to Value Ratio
Active
$4,795,000
6
bds
|
9
ba
|
7,869
sqft
|
built
2018
9544 Balenciaga Ct, Delray Beach, FL 33446
$-20,293
Cash flow
-22.1%
Cash-on-Cash Return
1.1%
Cap rate
0.2%
Rent to Value Ratio
Active
$645,000
3
bds
|
2
ba
|
1,711
sqft
|
built
2000
4784 Blossom Dr, Delray Beach, FL 33445
$-1,691
Cash flow
-13.7%
Cash-on-Cash Return
3.0%
Cap rate
0.6%
Rent to Value Ratio
Active
$3,250,000
6
bds
|
6
ba
|
7,303
sqft
|
built
2002
16140 Rio Rodeo, Delray Beach, FL 33446
$-12,773
Cash flow
-20.5%
Cash-on-Cash Return
1.4%
Cap rate
0.3%
Rent to Value Ratio
Active
$1,625,000
3
bds
|
4
ba
|
2,138
sqft
|
built
2014
147 N Cannery Row Cir, Delray Beach, FL 33444
$-4,730
Cash flow
-15.2%
Cash-on-Cash Return
2.7%
Cap rate
0.5%
Rent to Value Ratio
Active
$675,000
2
bds
|
2
ba
|
1,482
sqft
|
built
1970
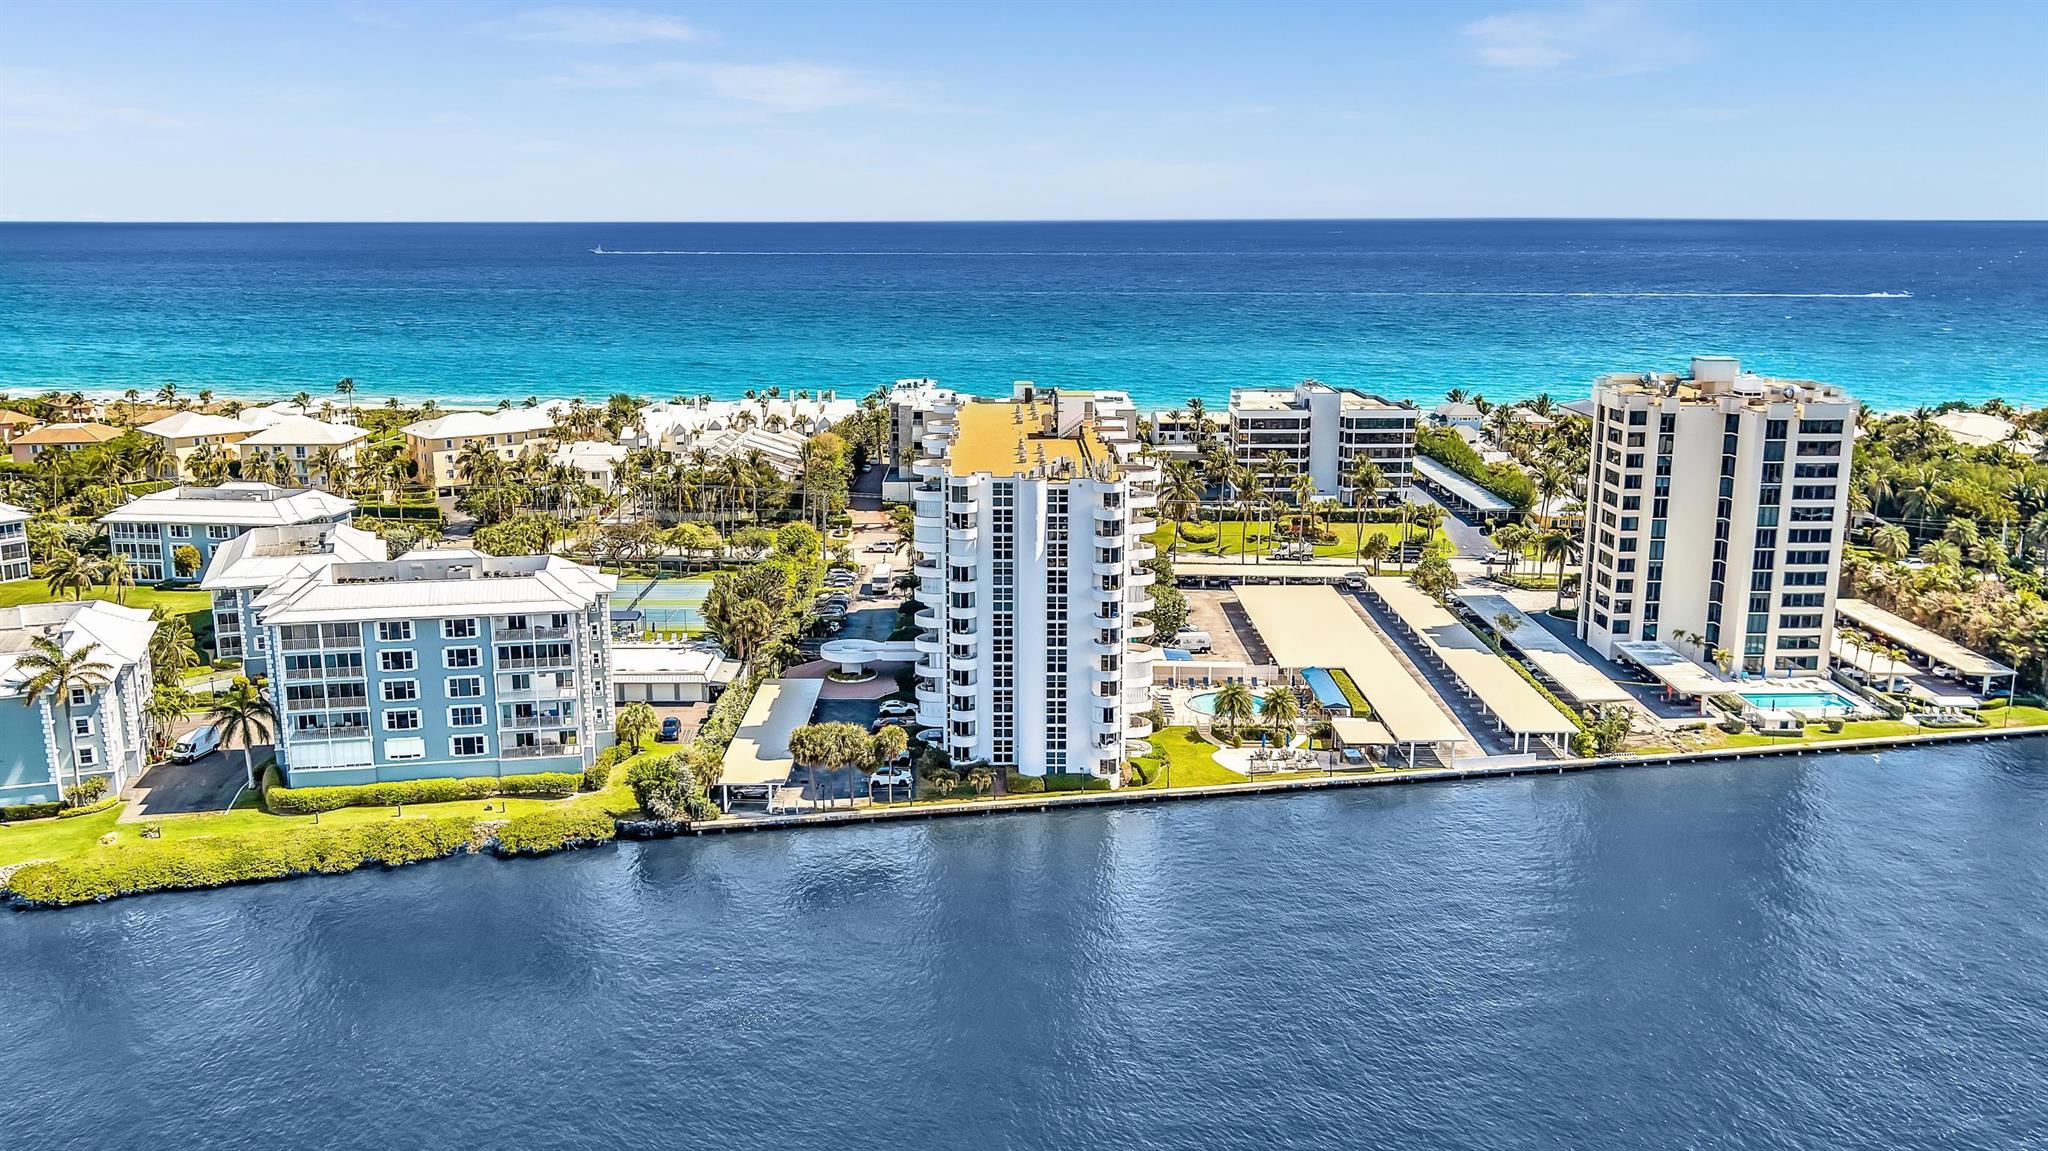
2200 S Ocean Blvd, Delray Beach, FL 33483
$-2,048
Cash flow
-15.8%
Cash-on-Cash Return
2.5%
Cap rate
0.7%
Rent to Value Ratio
Active
$649,000
1
bds
|
1
ba
|
759
sqft
|
built
1971
3851 N Ocean Blvd, Delray Beach, FL 33483
$-2,266
Cash flow
-18.2%
Cash-on-Cash Return
2.0%
Cap rate
0.5%
Rent to Value Ratio
Active
$599,999
3
bds
|
2
ba
|
1,482
sqft
|
built
1990
124 NW 8th Ave, Delray Beach, FL 33444
$-666
Cash flow
-5.8%
Cash-on-Cash Return
4.8%
Cap rate
0.6%
Rent to Value Ratio
Active
$529,900
1
bds
|
1
ba
|
570
sqft
|
built
1950
1006 Casuarina Rd, Delray Beach, FL 33483
$-145
Cash flow
-1.4%
Cash-on-Cash Return
5.8%
Cap rate
1.0%
Rent to Value Ratio
Active
$219,900
2
bds
|
2
ba
|
1,133
sqft
|
built
1984
2825 Casita Way, Delray Beach, FL 33445
$-363
Cash flow
-8.6%
Cash-on-Cash Return
4.2%
Cap rate
1.0%
Rent to Value Ratio
Pending
$7,395,000
4
bds
|
4
ba
|
3,997
sqft
|
built
1994
1026 Seasage Dr, Delray Beach, FL 33483
$-34,067
Cash flow
-24.0%
Cash-on-Cash Return
0.6%
Cap rate
0.1%
Rent to Value Ratio
Active
$275,000
2
bds
|
2
ba
|
960
sqft
|
built
1988
2320 Germantown Rd, Delray Beach, FL 33445
$-809
Cash flow
-15.3%
Cash-on-Cash Return
2.6%
Cap rate
0.8%
Rent to Value Ratio
Active
$339,900
2
bds
|
2
ba
|
1,300
sqft
|
built
1983
555 Banyan Tree Ln, Delray Beach, FL 33483
$-912
Cash flow
-14.0%
Cash-on-Cash Return
2.9%
Cap rate
0.7%
Rent to Value Ratio

Active
$765,000
4
bds
|
3
ba
|
2,730
sqft
|
built
2004
4795 S Classical Blvd, Delray Beach, FL 33445
$-2,028
Cash flow
-13.8%
Cash-on-Cash Return
3.0%
Cap rate
0.6%
Rent to Value Ratio
Active
$699,900
3
bds
|
2
ba
|
1,637
sqft
|
built
1992
5625 Aspen Ridge Cir, Delray Beach, FL 33484
$-1,252
Cash flow
-9.3%
Cash-on-Cash Return
4.0%
Cap rate
0.6%
Rent to Value Ratio
Active
$315,000
2
bds
|
2
ba
|
1,088
sqft
|
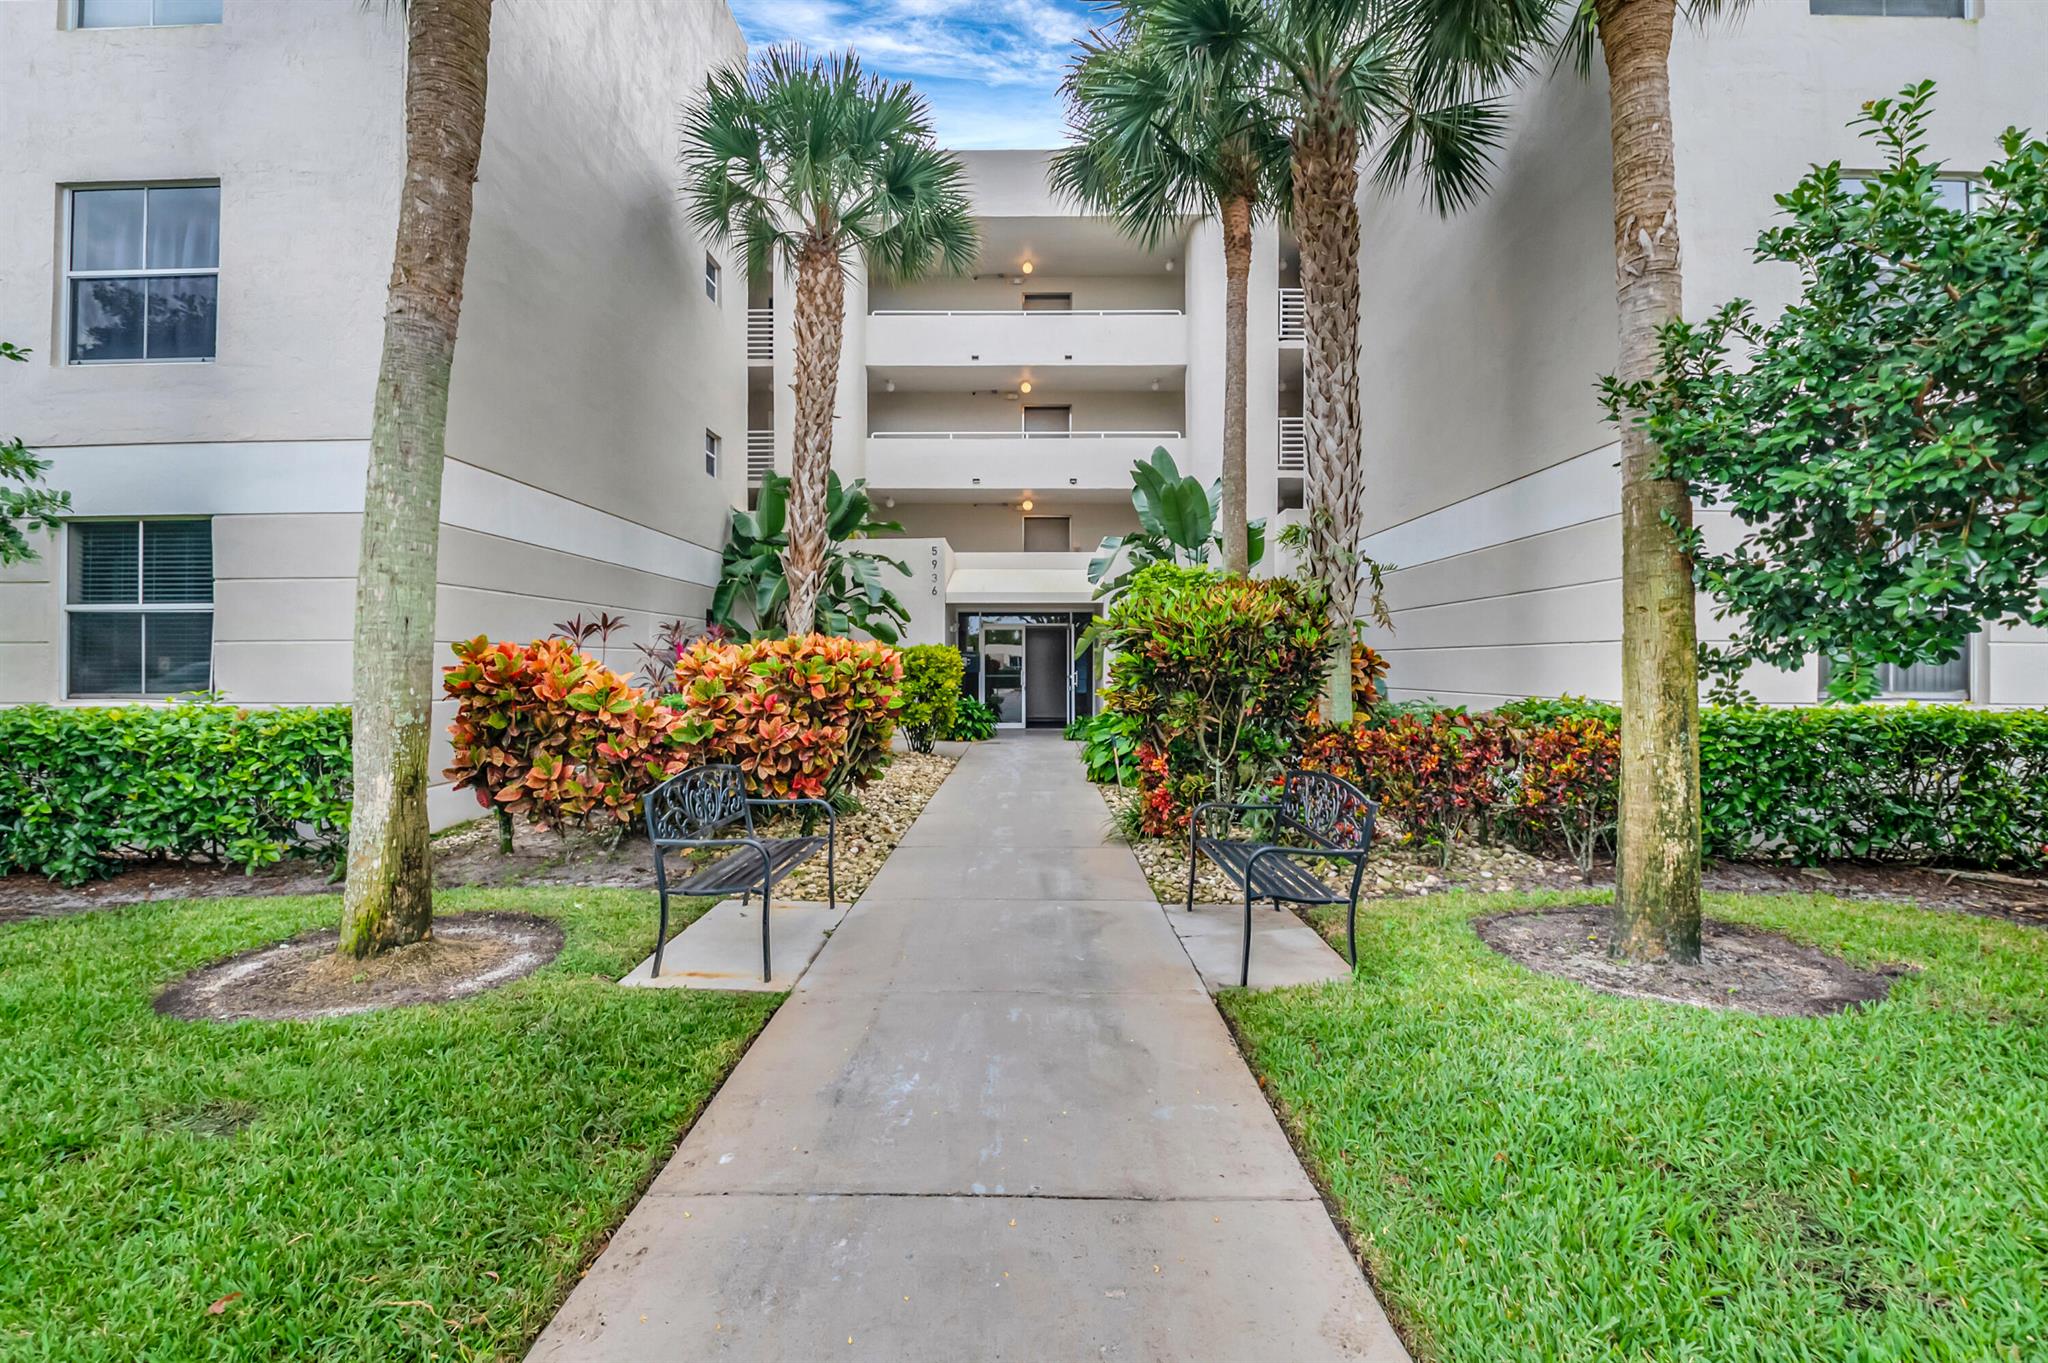
built
1992
5936 Morningstar Cir, Delray Beach, FL 33484
$-574
Cash flow
-9.5%
Cash-on-Cash Return
4.0%
Cap rate
0.8%
Rent to Value Ratio
Active
$349,000
3
bds
|
3
ba
|
1,326
sqft
|
built
1989
3900 Village Dr, Delray Beach, FL 33445
$-711
Cash flow
-10.6%
Cash-on-Cash Return
3.7%
Cap rate
0.8%
Rent to Value Ratio

Active
$1,899,000
5
bds
|
6
ba
|
4,248
sqft
|
built
2015
16969 Pavilion Way, Delray Beach, FL 33446
$-6,197
Cash flow
-17.0%
Cash-on-Cash Return
2.2%
Cap rate
0.5%
Rent to Value Ratio
Active
$2,895,000
3
bds
|
4
ba
|
3,317
sqft
|
built
2001
1583 Estuary Trl, Delray Beach, FL 33483
$-10,593
Cash flow
-19.1%
Cash-on-Cash Return
1.8%
Cap rate
0.3%
Rent to Value Ratio
Active
$449,000
3
bds
|
1
ba
|
956
sqft
|
built
1964
214 NW 7th Ave, Delray Beach, FL 33444
$-733
Cash flow
-8.5%
Cash-on-Cash Return
4.2%
Cap rate
0.7%
Rent to Value Ratio
Active
$749,900
2
bds
|
2
ba
|
1,482
sqft
|
built
1970
2200 S Ocean Blvd, Delray Beach, FL 33483
$-2,922
Cash flow
-20.3%
Cash-on-Cash Return
1.5%
Cap rate
0.6%
Rent to Value Ratio
Active
$725,000
2
bds
|
2
ba
|
1,160
sqft
|
built
1965
1015 Ingraham Ave, Delray Beach, FL 33483
$-2,506
Cash flow
-18.0%
Cash-on-Cash Return
2.0%
Cap rate
0.6%
Rent to Value Ratio