Delray Beach, FL Investment Properties for Sale
Browse homes for sale and investment properties in Delray Beach, FL. Refine your search by price, property type, or more.
Best cash flowing properties in Delray Beach, FL
Active
$175,000
2
bds
|
2
ba
|
1,007
sqft
|
built
1985
2259 Linton Ridge Cir, Delray Beach, FL 33444
$-210
Cash flow
-6.3%
Cash-on-Cash Return
4.7%
Cap rate
1.1%
Rent to Value Ratio
Active
$200,000
2
bds
|
2
ba
|
848
sqft
|
built
1985
2339 Linton Ridge Cir, Delray Beach, FL 33444
$-310
Cash flow
-8.1%
Cash-on-Cash Return
4.3%
Cap rate
1.0%
Rent to Value Ratio
638 out of 736 properties for sale in Delray Beach, FL
Limited Results Shown
Create a free account, or log in to reveal all property listings and enjoy the complete experience.
Active
$249,999
2
bds
|
2
ba
|
979
sqft
|
built
1988
13791 Oneida Dr, Delray Beach, FL 33446
$-861
Cash flow
-18.0%
Cash-on-Cash Return
2.0%
Cap rate
0.8%
Rent to Value Ratio
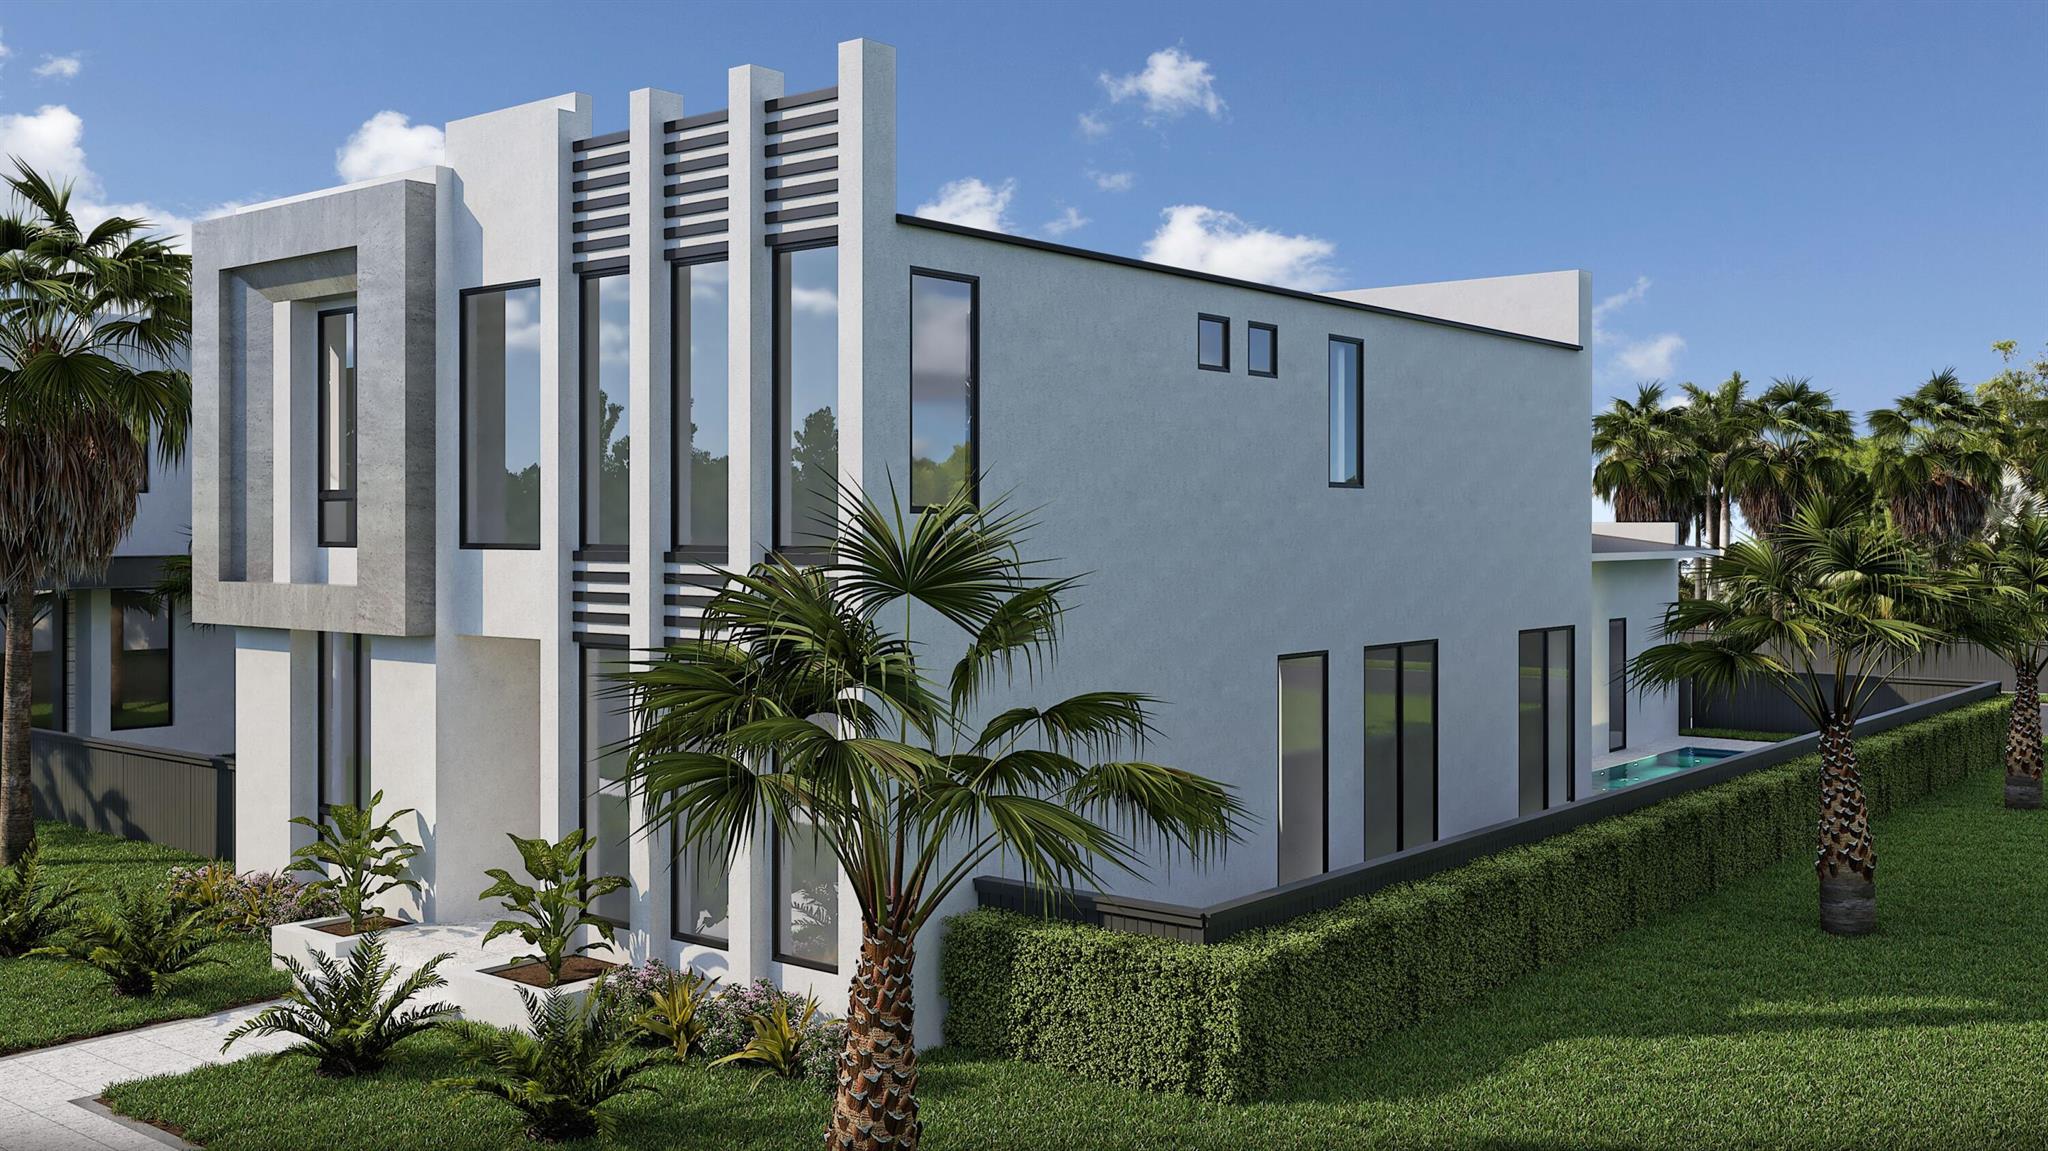
Active
$2,500,000
4
bds
|
4
ba
|
2,245
sqft
|
built
2025
217 Kings Lynn, Delray Beach, FL 33444
$-10,728
Cash flow
-22.4%
Cash-on-Cash Return
1.0%
Cap rate
0.2%
Rent to Value Ratio
Active
$3,295,000
4
bds
|
5
ba
|
3,623
sqft
|
built
2026
731 SE 4th Ave, Delray Beach, FL 33483
$-15,372
Cash flow
-24.3%
Cash-on-Cash Return
0.5%
Cap rate
0.1%
Rent to Value Ratio
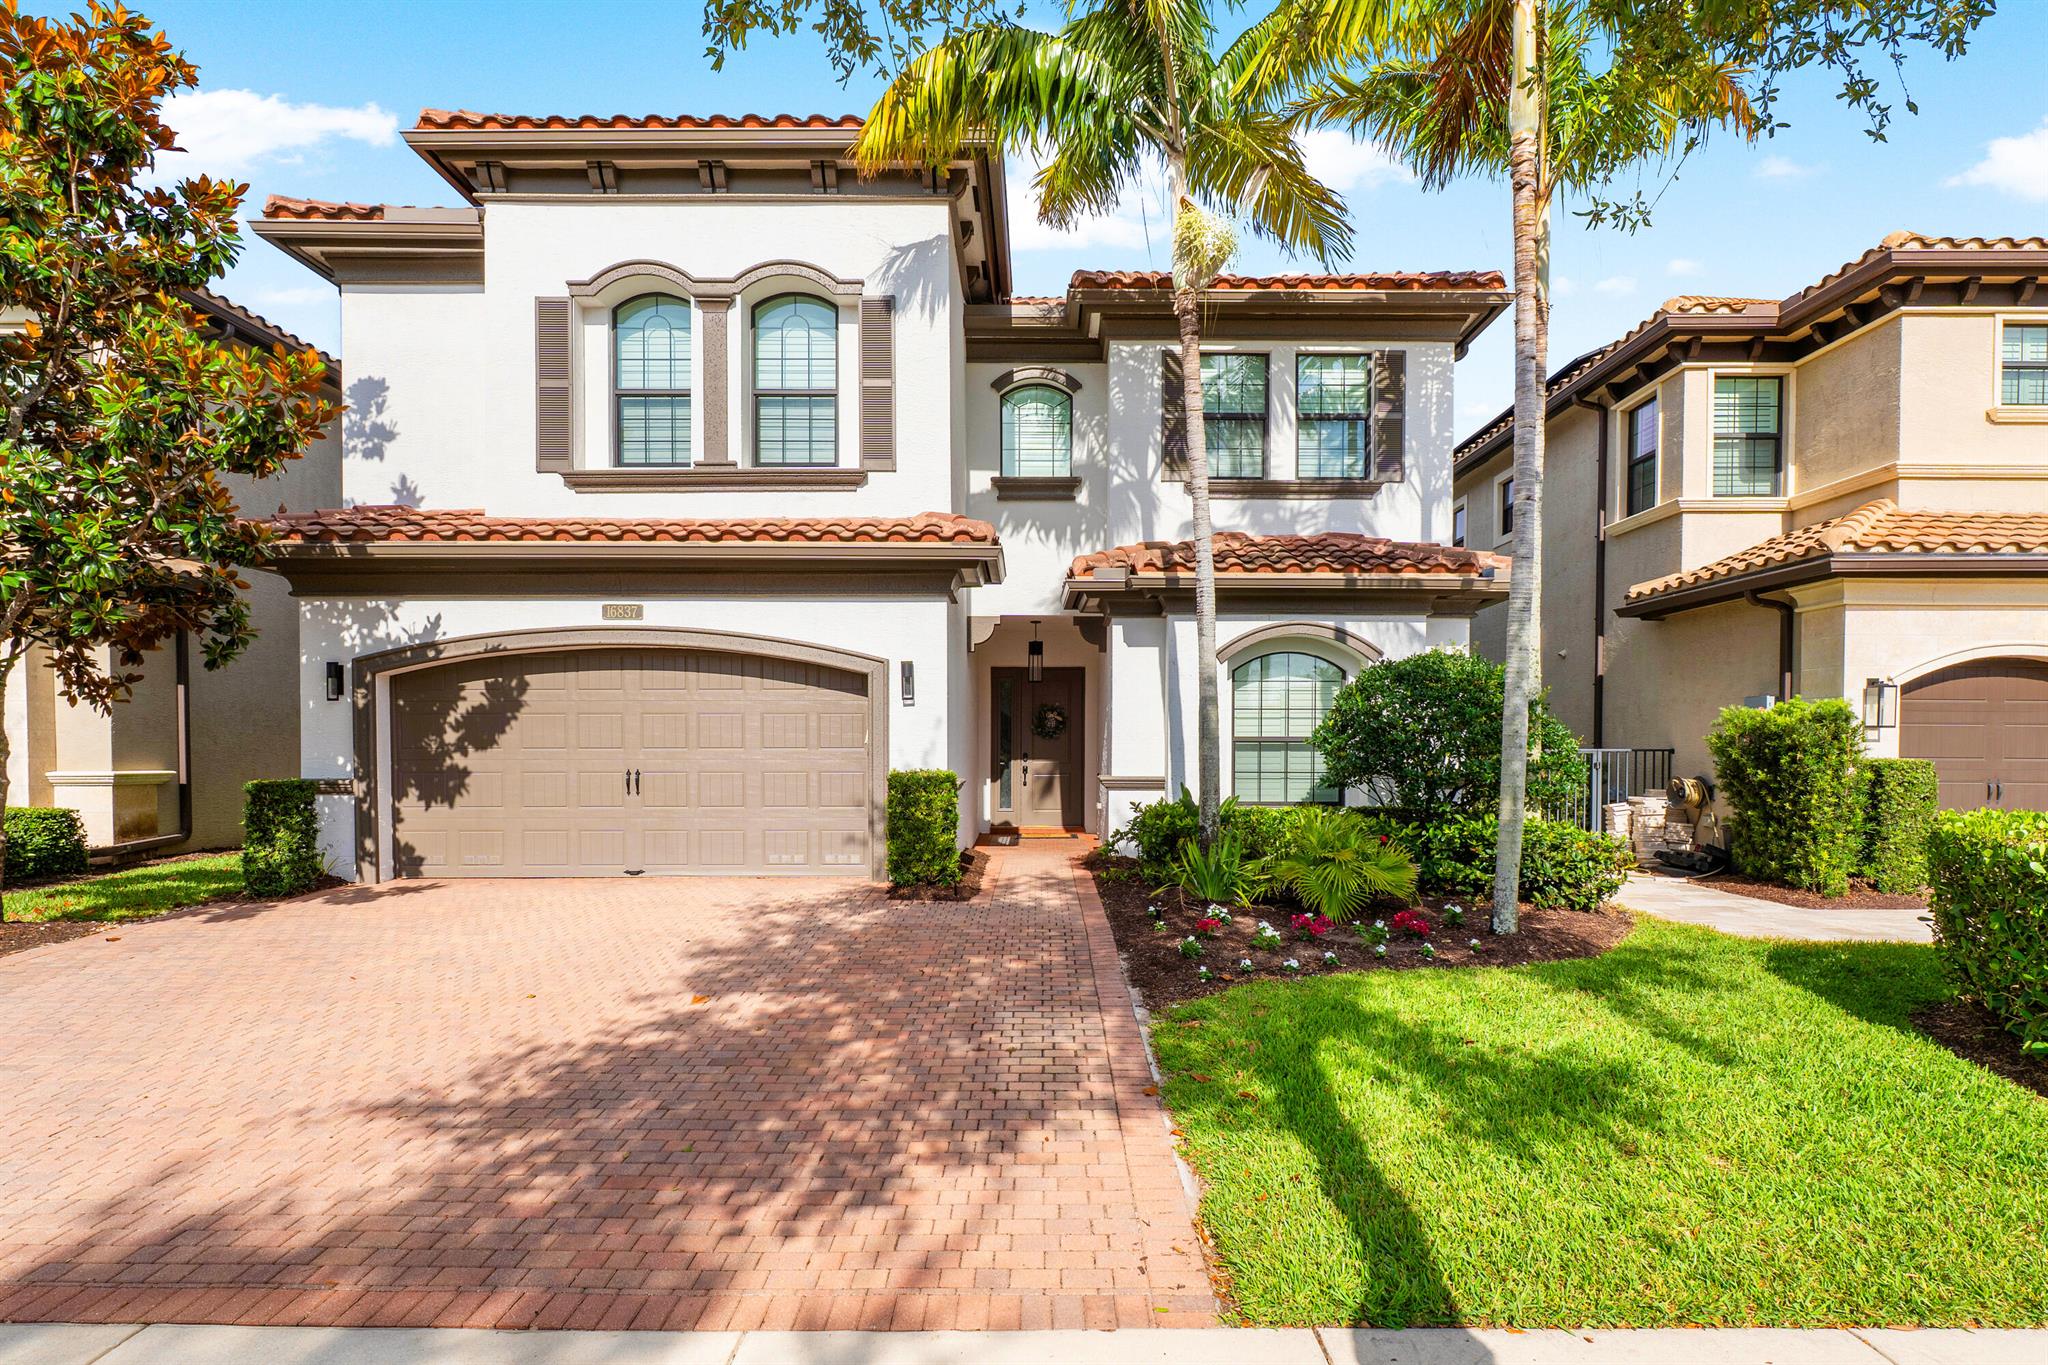
Active
$1,599,000
4
bds
|
4
ba
|
3,537
sqft
|
built
2014
16837 Bridge Crossing Cir, Delray Beach, FL 33446
$-4,466
Cash flow
-14.6%
Cash-on-Cash Return
2.8%
Cap rate
0.6%
Rent to Value Ratio
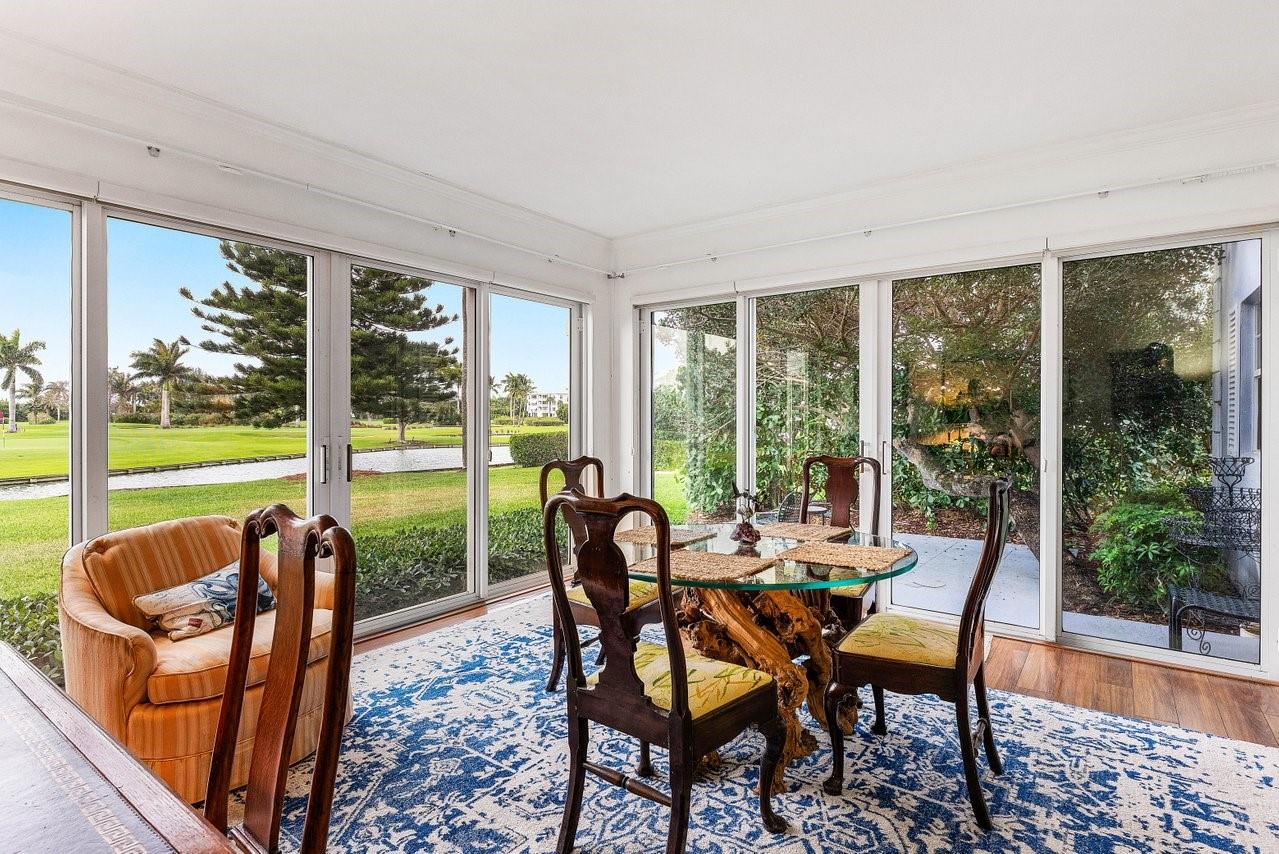
Active
$925,000
2
bds
|
2
ba
|
1,300
sqft
|
built
1973
4475 N Ocean Blvd, Delray Beach, FL 33483
$-4,910
Cash flow
-27.7%
Cash-on-Cash Return
-0.2%
Cap rate
0.5%
Rent to Value Ratio
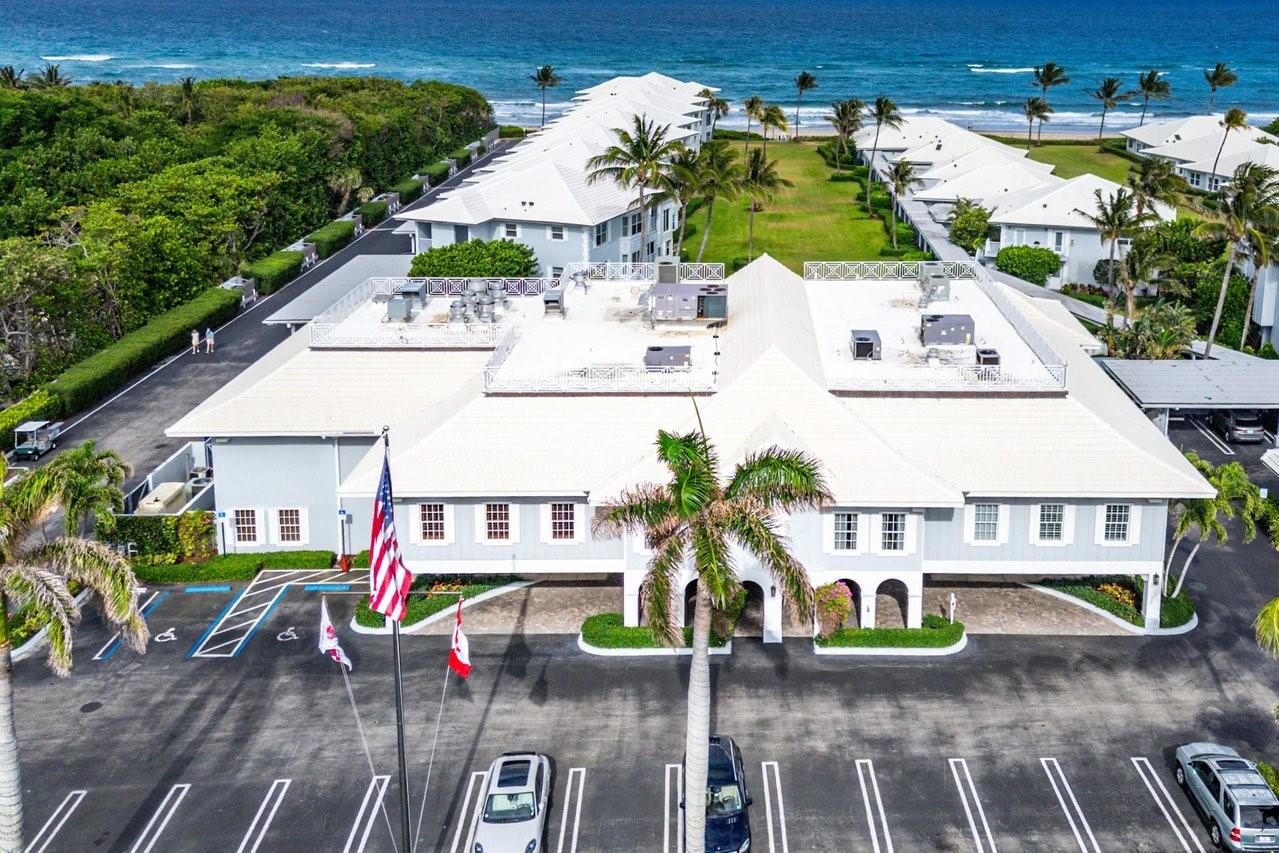
Active
$975,000
2
bds
|
2
ba
|
1,300
sqft
|
built
1973
4475 N Ocean Blvd, Delray Beach, FL 33483
$-5,166
Cash flow
-27.6%
Cash-on-Cash Return
-0.2%
Cap rate
0.5%
Rent to Value Ratio
Active
$435,000
3
bds
|
1
ba
|
1,029
sqft
|
built
1957
5372 Van Buren Rd, Delray Beach, FL 33484
$-842
Cash flow
-10.1%
Cash-on-Cash Return
3.8%
Cap rate
0.6%
Rent to Value Ratio
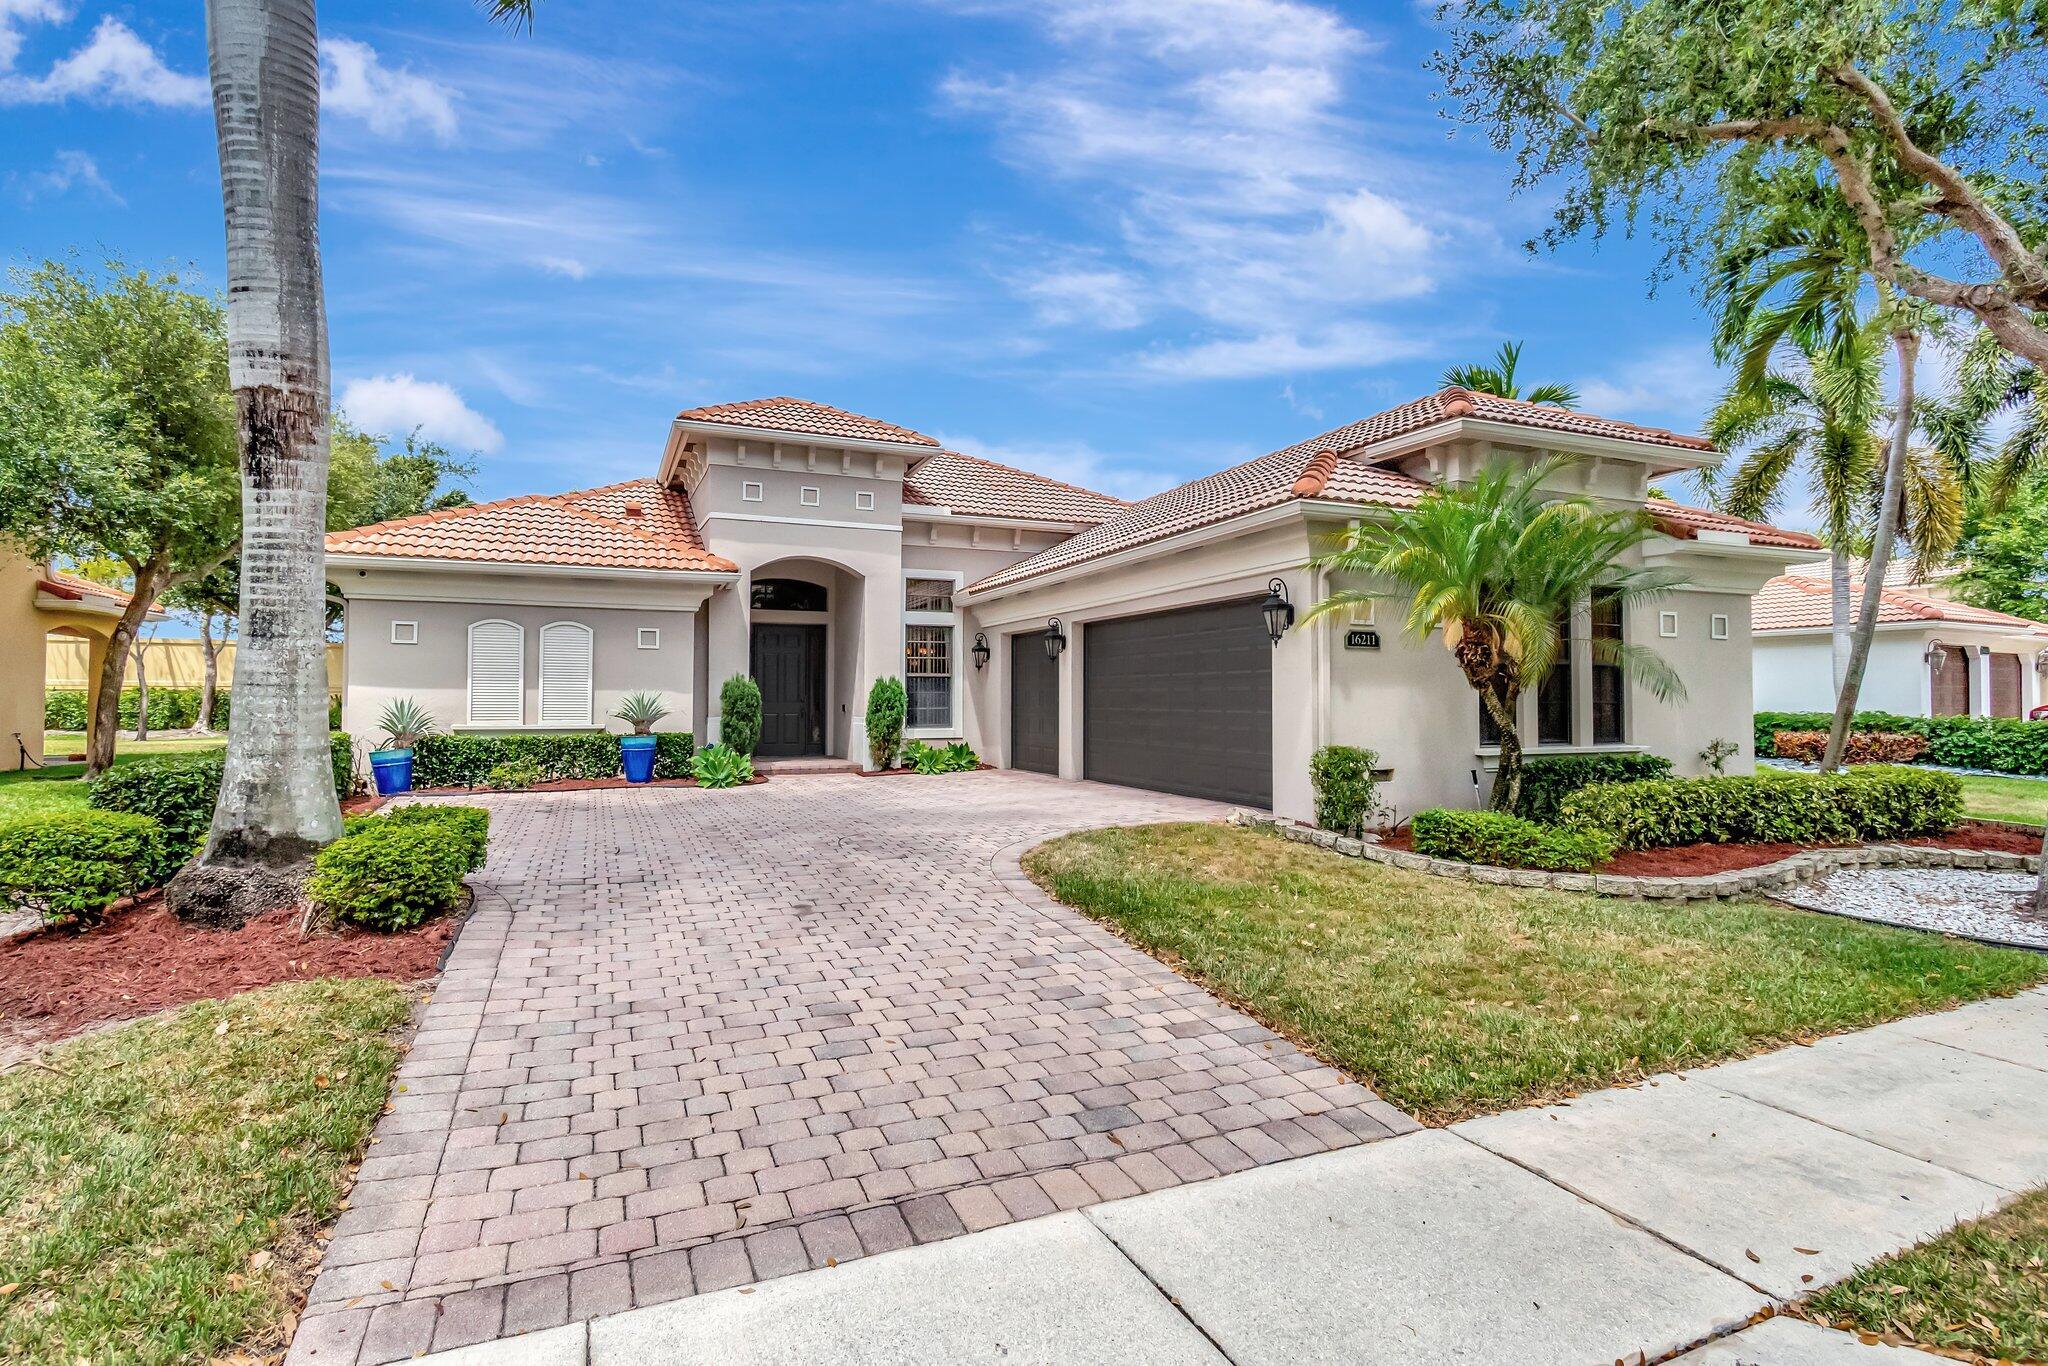
Active
$1,190,000
4
bds
|
3
ba
|
2,772
sqft
|
built
2006
16211 Rosecroft Ter, Delray Beach, FL 33446
$-3,194
Cash flow
-14.0%
Cash-on-Cash Return
2.9%
Cap rate
0.5%
Rent to Value Ratio
Pending
$575,000
2
bds
|
2
ba
|
1,000
sqft
|
built
1968
1910 S Ocean Blvd, Delray Beach, FL 33483
$-2,017
Cash flow
-18.3%
Cash-on-Cash Return
1.9%
Cap rate
0.6%
Rent to Value Ratio
Active under contract
$1,475,000
4
bds
|
4
ba
|
3,074
sqft
|
built
1991
2907 Needham Ct, Delray Beach, FL 33445
$-2,939
Cash flow
-10.4%
Cash-on-Cash Return
3.8%
Cap rate
0.5%
Rent to Value Ratio
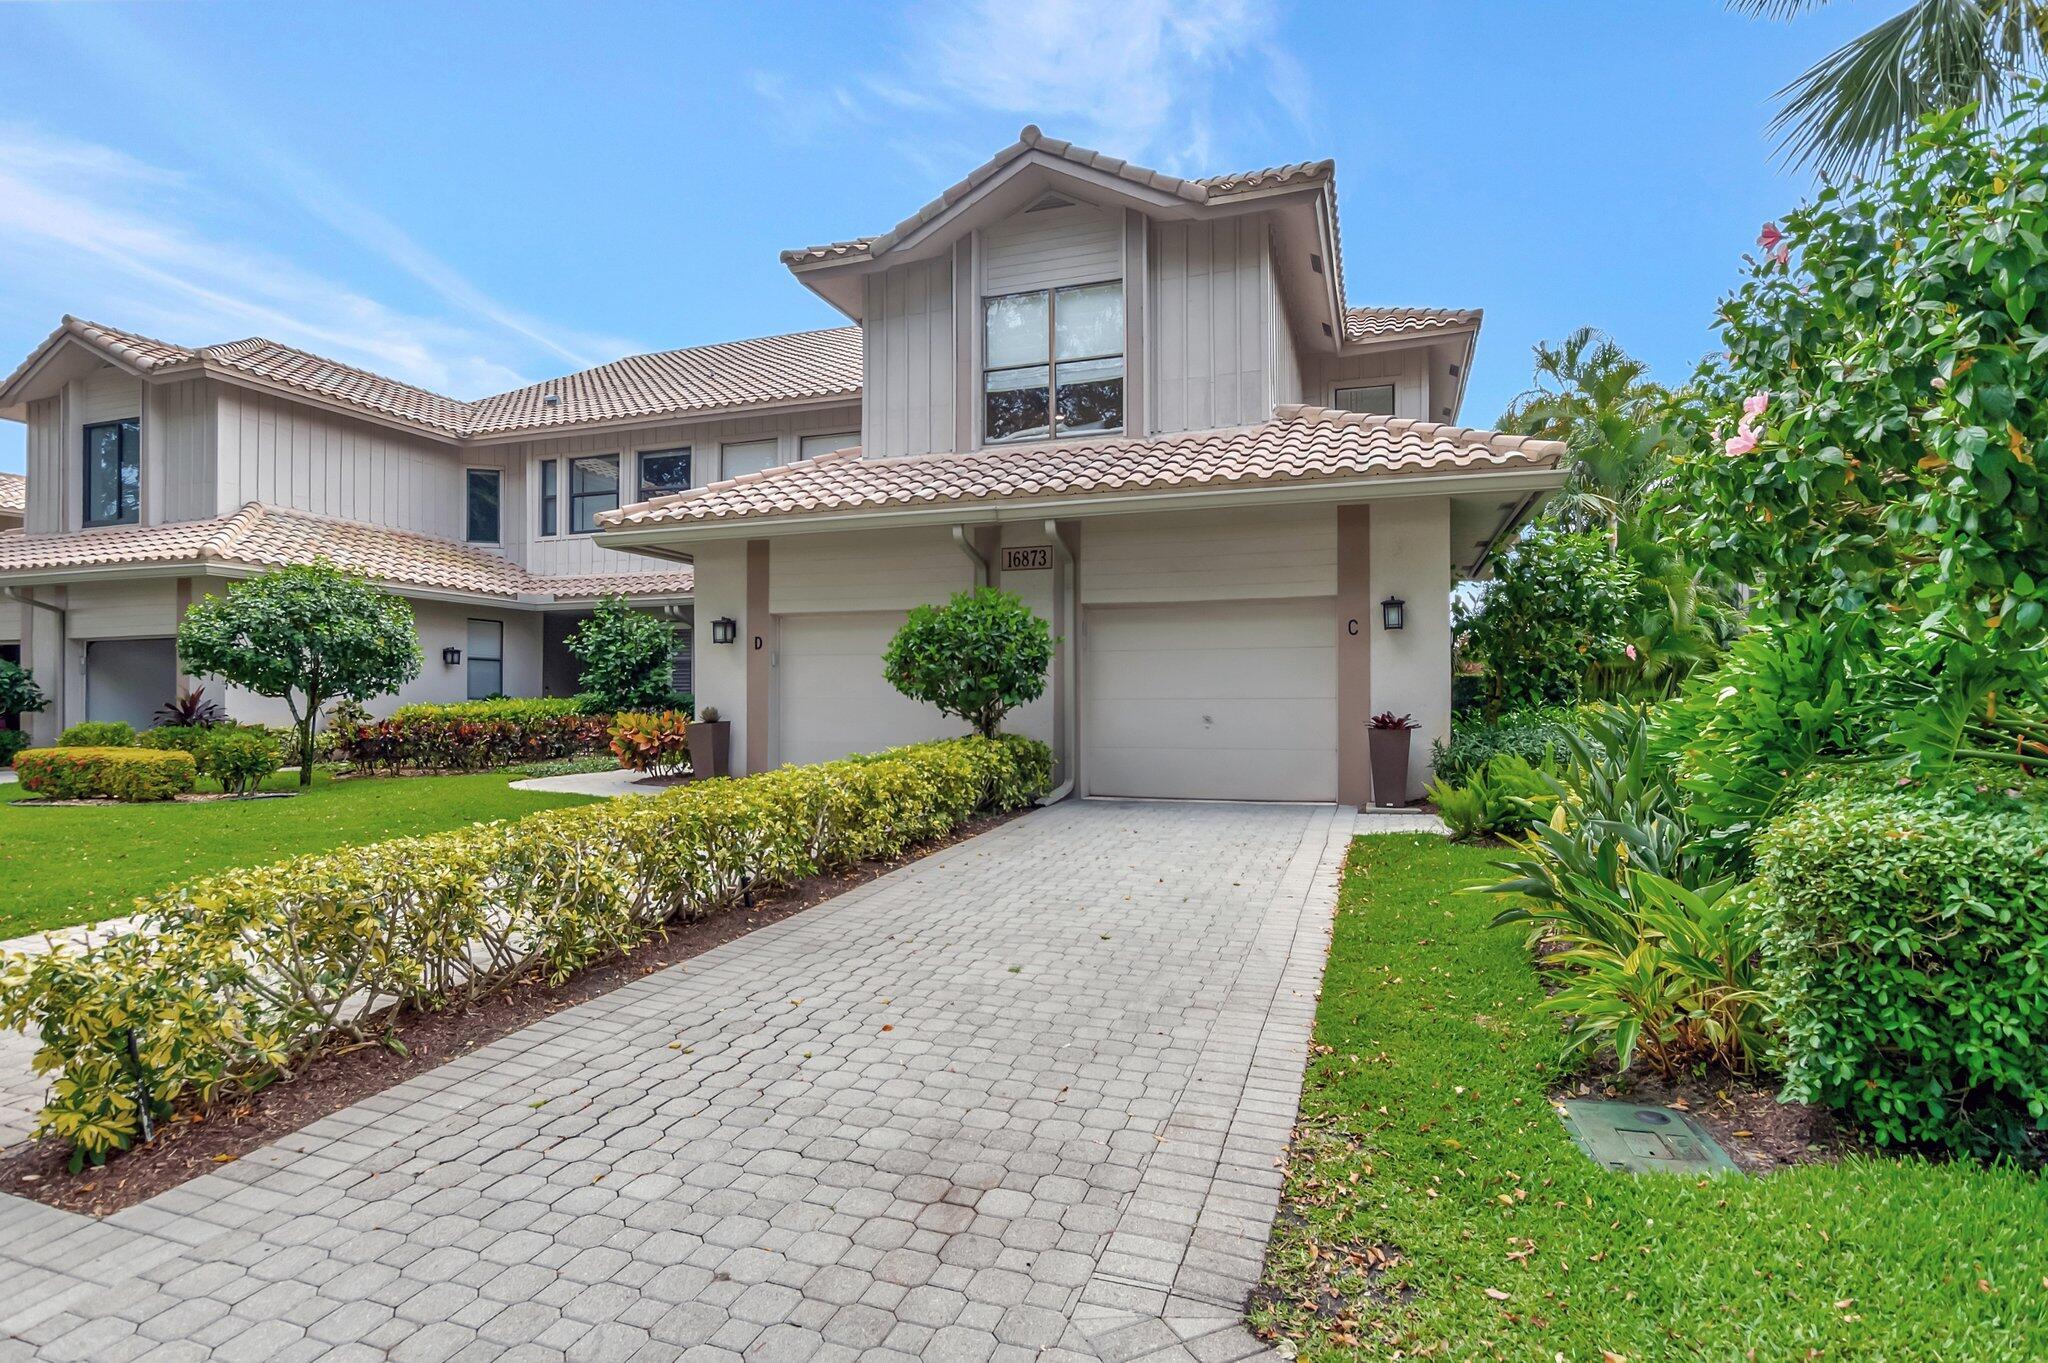
Active
$1,125,000
3
bds
|
3
ba
|
2,612
sqft
|
built
1994
16873 Isle Of Palms Dr, Delray Beach, FL 33484
$-4,667
Cash flow
-21.6%
Cash-on-Cash Return
1.2%
Cap rate
0.3%
Rent to Value Ratio
Active
$3,495,000
3
bds
|
4
ba
|
2,949
sqft
|
built
1988
910 Jasmine Dr, Delray Beach, FL 33483
$-11,916
Cash flow
-17.8%
Cash-on-Cash Return
2.1%
Cap rate
0.3%
Rent to Value Ratio
Active
$2,999,999
3
bds
|
5
ba
|
3,420
sqft
|
built
2023
914 Palm Trl, Delray Beach, FL 33483
$-14,055
Cash flow
-24.4%
Cash-on-Cash Return
0.5%
Cap rate
0.3%
Rent to Value Ratio
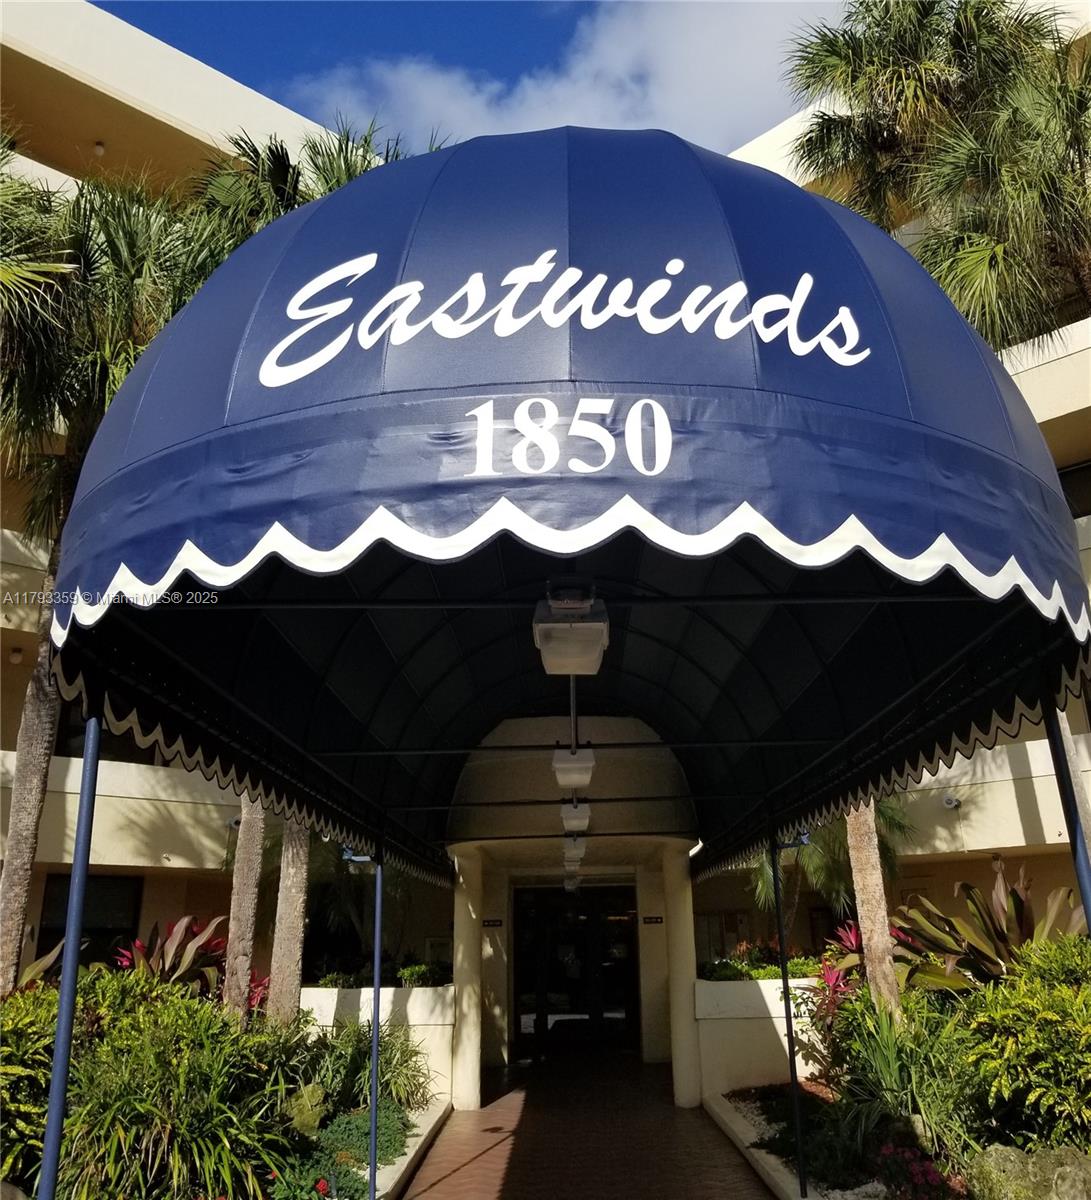
Active
$359,900
3
bds
|
2
ba
|
1,337
sqft
|
built
1984
1850 Homewood Blvd, Delray Beach, FL 33445
$-825
Cash flow
-12.0%
Cash-on-Cash Return
3.4%
Cap rate
0.9%
Rent to Value Ratio
Active
$305,000
2
bds
|
2
ba
|
1,230
sqft
|
built
1981
14475 Strathmore Ln, Delray Beach, FL 33446
$-1,113
Cash flow
-19.0%
Cash-on-Cash Return
1.8%
Cap rate
0.8%
Rent to Value Ratio
Active
$1,100,000
4
bds
|
3
ba
|
2,774
sqft
|
built
1984
3699 Lakeview Blvd, Delray Beach, FL 33445
$-2,853
Cash flow
-13.5%
Cash-on-Cash Return
3.0%
Cap rate
0.5%
Rent to Value Ratio
Active
$755,000
3
bds
|
2
ba
|
1,832
sqft
|
built
1972
729 Heron Dr, Delray Beach, FL 33444
$-774
Cash flow
-5.3%
Cash-on-Cash Return
4.9%
Cap rate
0.7%
Rent to Value Ratio
Closed
$299,000
2
bds
|
2
ba
|
1,160
sqft
|
built
1985
950 Lavers Cir, Delray Beach, FL 33444
$-859
Cash flow
-15.0%
Cash-on-Cash Return
2.7%
Cap rate
0.8%
Rent to Value Ratio
Active
$175,000
2
bds
|
2
ba
|
1,007
sqft
|
built
1985
2259 Linton Ridge Cir, Delray Beach, FL 33444
$-210
Cash flow
-6.3%
Cash-on-Cash Return
4.7%
Cap rate
1.1%
Rent to Value Ratio
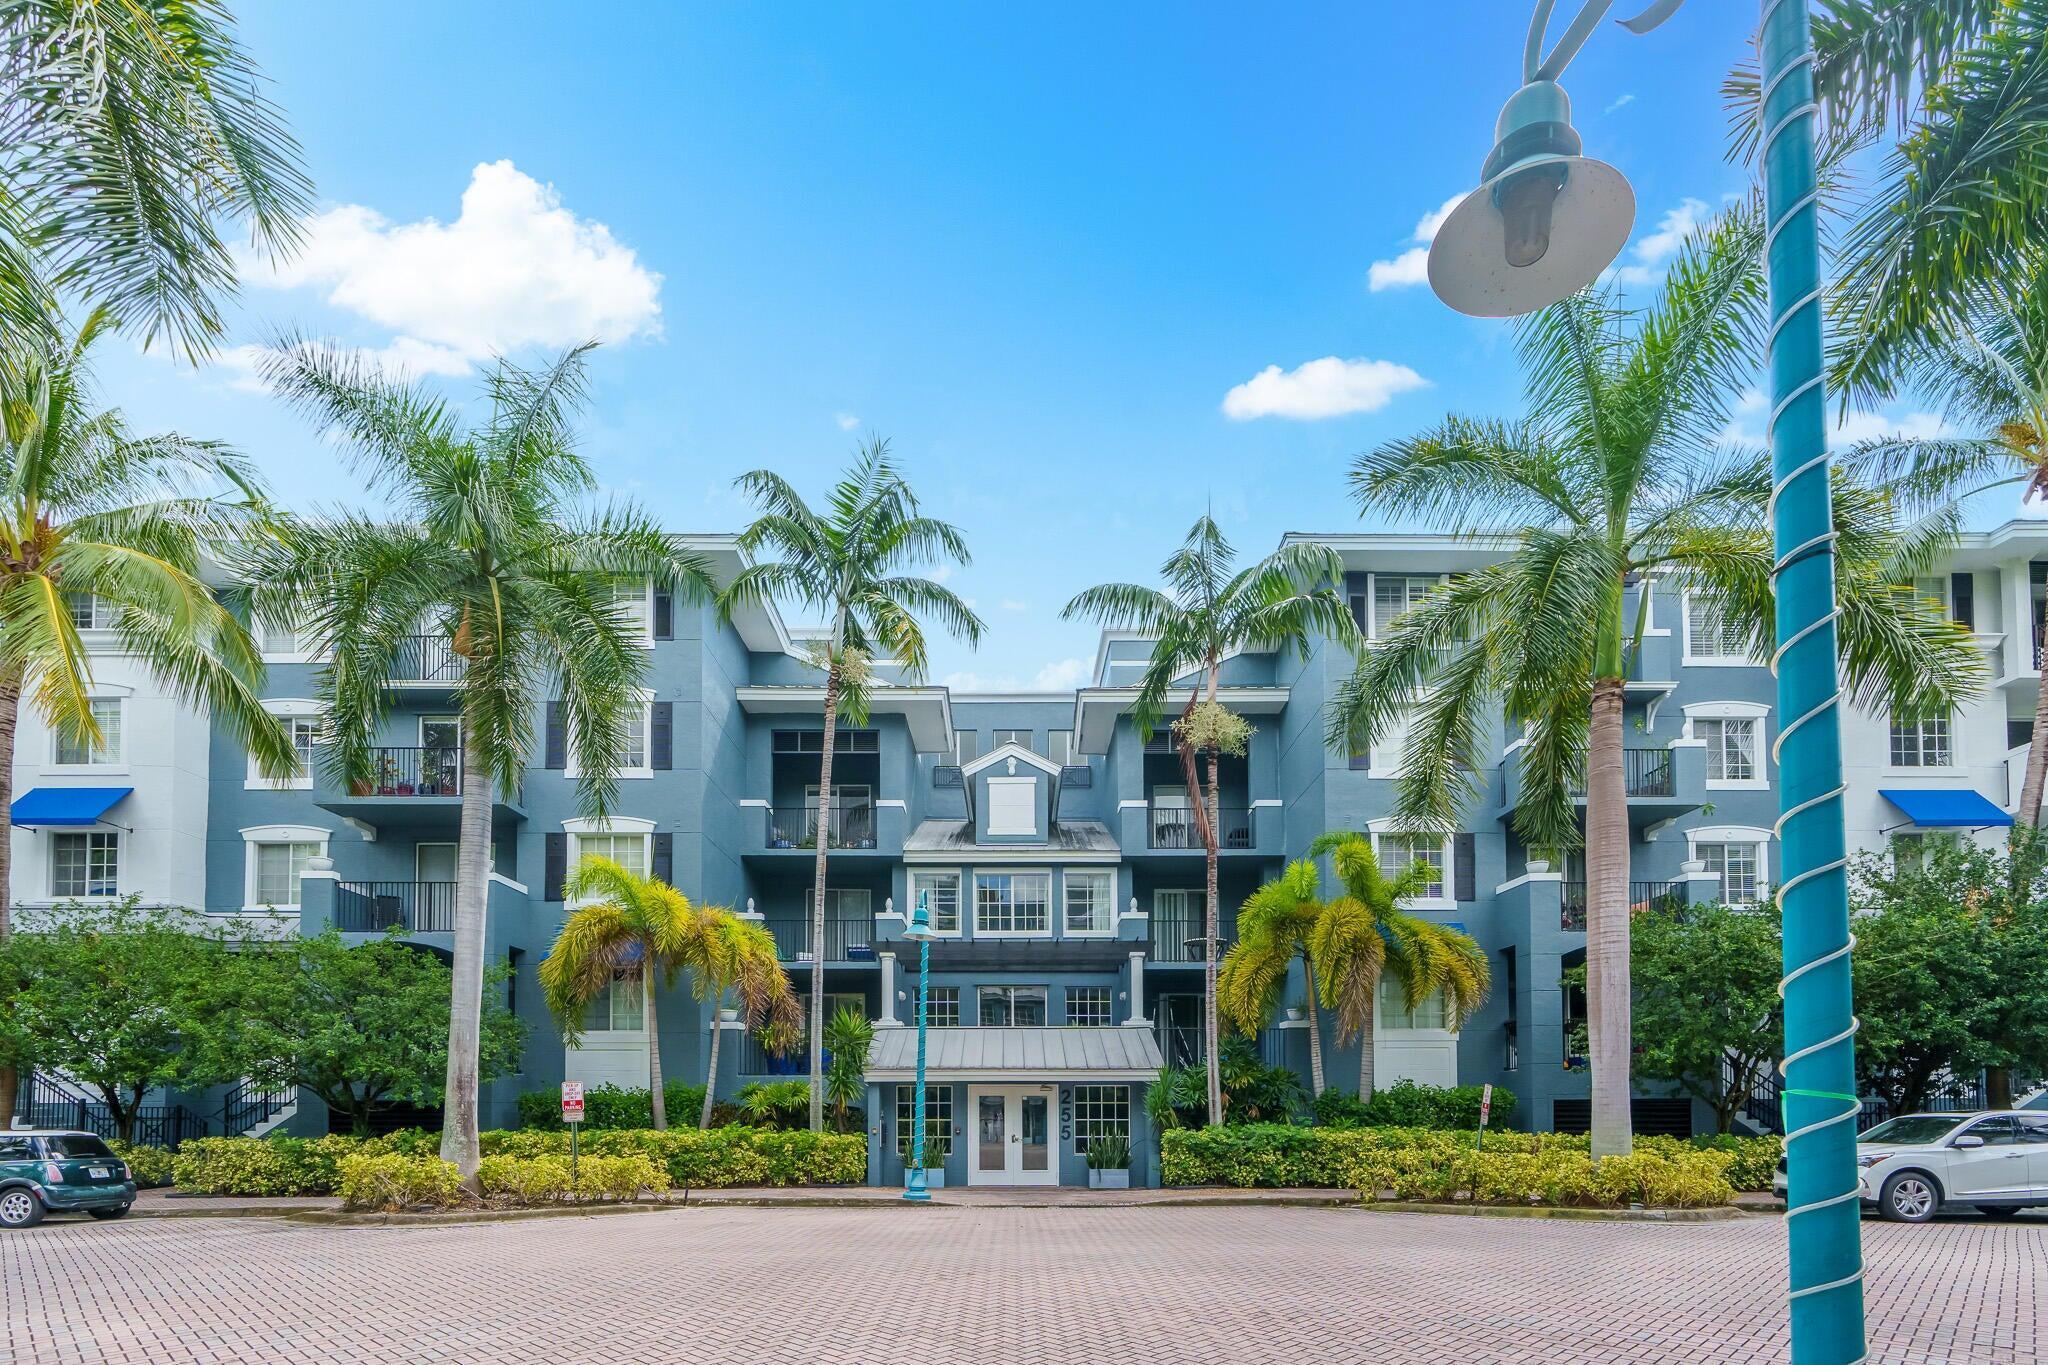
Active
$690,000
2
bds
|
2
ba
|
1,243
sqft
|
built
2004
255 NE 3rd Ave, Delray Beach, FL 33444
$-2,195
Cash flow
-16.6%
Cash-on-Cash Return
2.3%
Cap rate
0.6%
Rent to Value Ratio
Active
$4,599,000
4
bds
|
5
ba
|
4,617
sqft
|
built
2000
5784 Vintage Oaks Cir, Delray Beach, FL 33484
$-17,599
Cash flow
-20.0%
Cash-on-Cash Return
1.6%
Cap rate
0.2%
Rent to Value Ratio
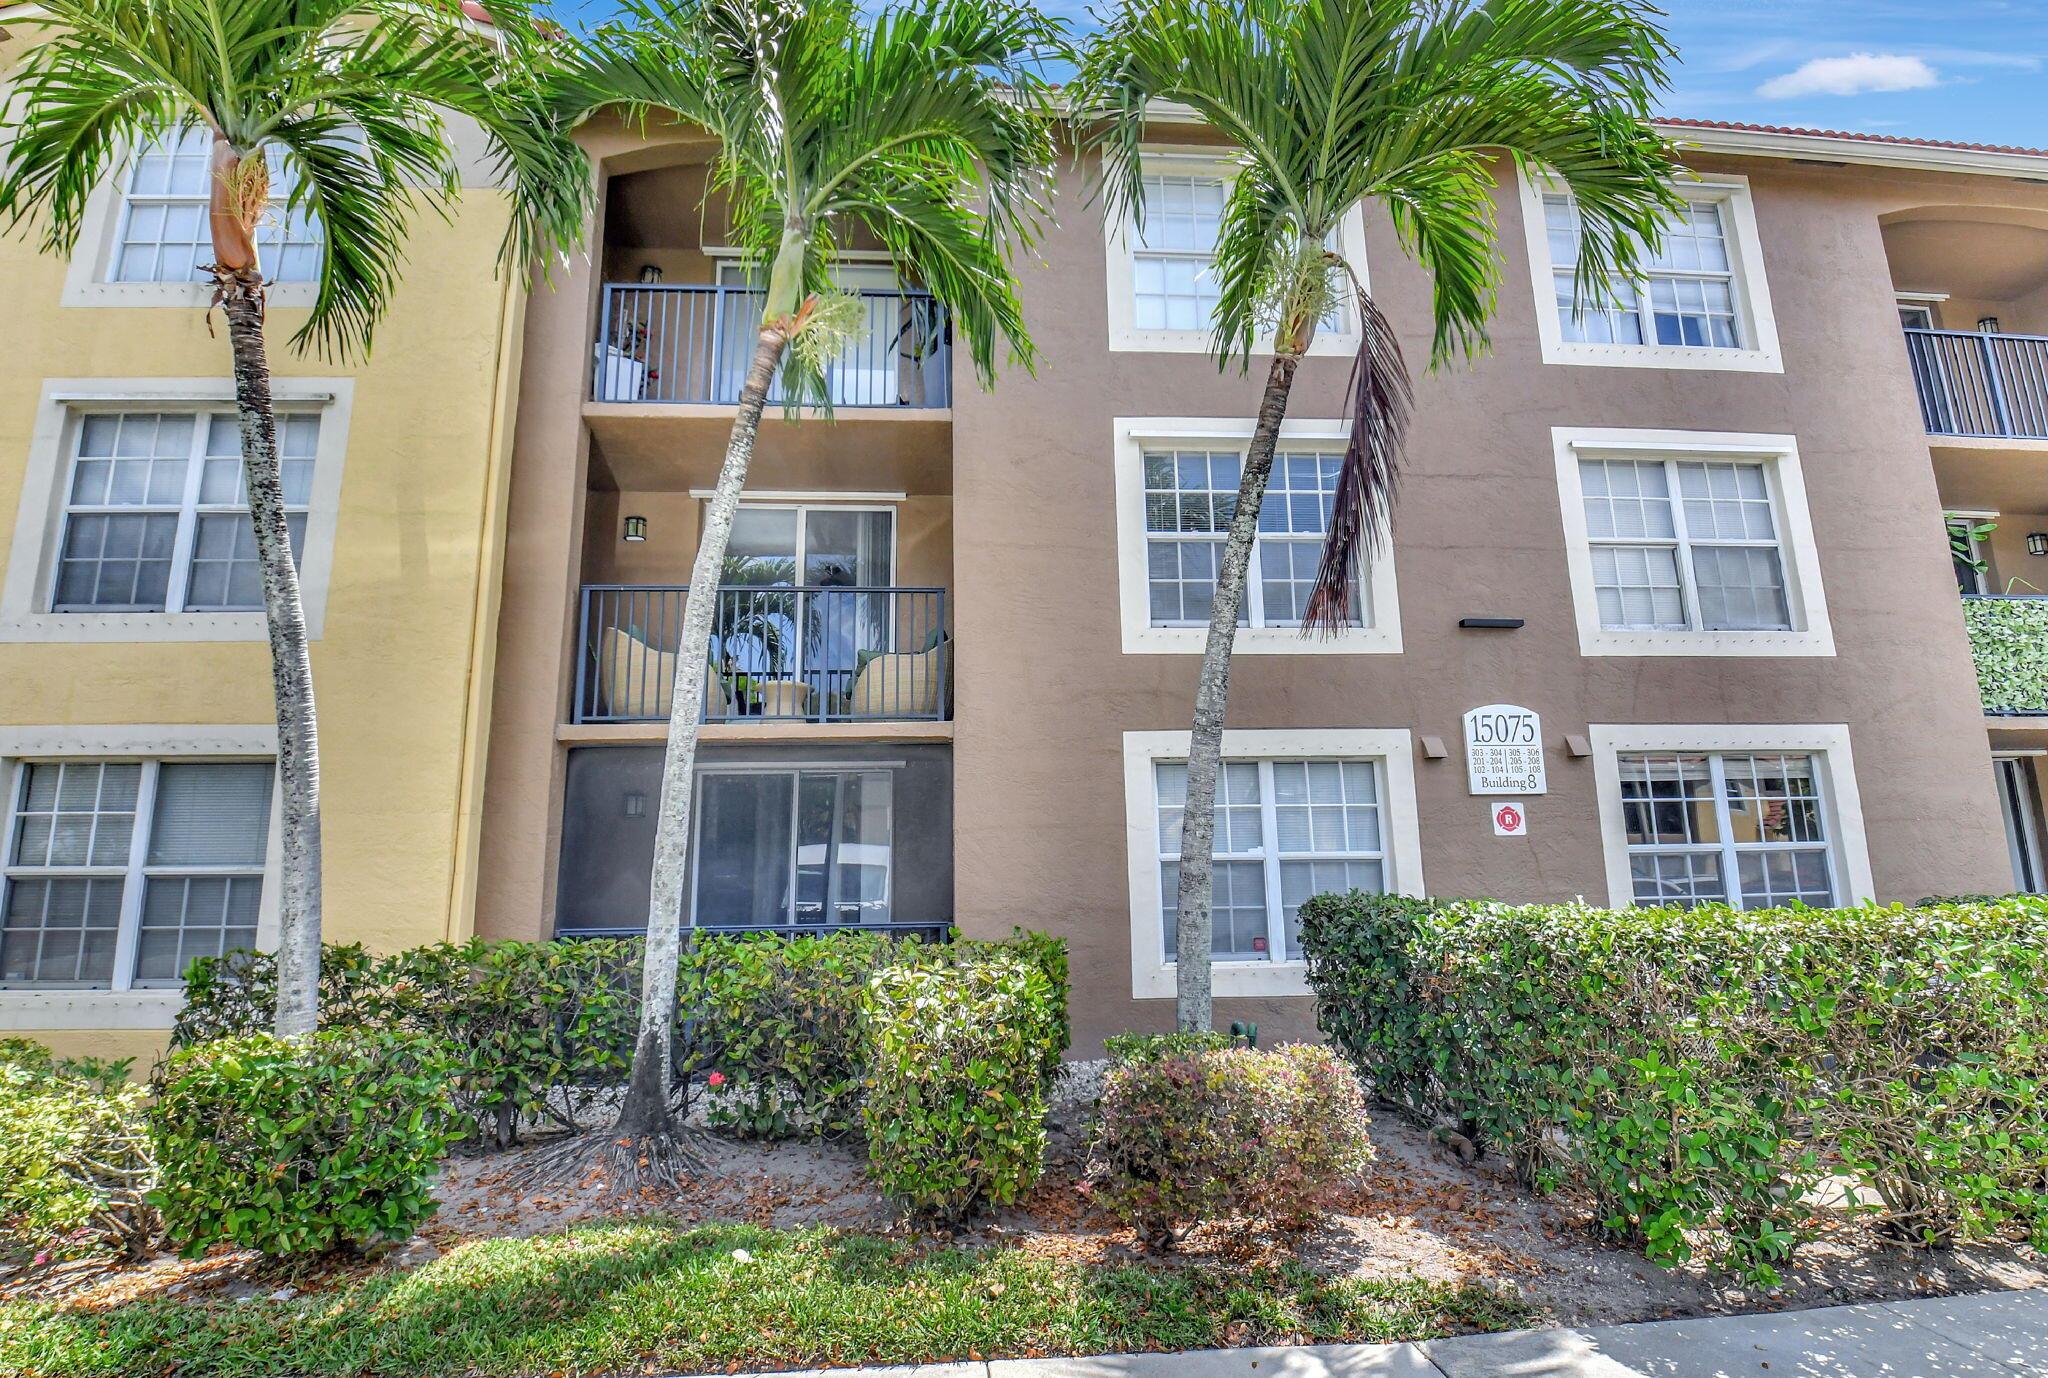
Active
$325,000
2
bds
|
2
ba
|
1,079
sqft
|
built
2001
15075 Michelangelo Blvd, Delray Beach, FL 33446
$-810
Cash flow
-13.0%
Cash-on-Cash Return
3.2%
Cap rate
0.7%
Rent to Value Ratio
Active
$1,595,000
3
bds
|
3
ba
|
2,491
sqft
|
built
1963
912 Roberts Rd, Delray Beach, FL 33483
$-4,754
Cash flow
-15.6%
Cash-on-Cash Return
2.6%
Cap rate
0.4%
Rent to Value Ratio
Active
$304,990
2
bds
|
2
ba
|
1,050
sqft
|
built
1983
2716 Ponce De Leon Blvd, Delray Beach, FL 33445
$-841
Cash flow
-14.4%
Cash-on-Cash Return
2.8%
Cap rate
0.7%
Rent to Value Ratio
Active
$3,000,000
6
bds
|
6
ba
|
5,892
sqft
|
built
2018
9807 Rennes Ln, Delray Beach, FL 33446
$-12,879
Cash flow
-22.4%
Cash-on-Cash Return
1.0%
Cap rate
0.3%
Rent to Value Ratio
Active
$289,000
2
bds
|
2
ba
|
978
sqft
|
built
1989
1275 Crystal Way, Delray Beach, FL 33444
$-828
Cash flow
-14.9%
Cash-on-Cash Return
2.7%
Cap rate
0.8%
Rent to Value Ratio
Active
$1,559,900
3
bds
|
3
ba
|
2,460
sqft
|
built
2013
8986 Little Falls Way, Delray Beach, FL 33446
$-3,301
Cash flow
-11.0%
Cash-on-Cash Return
3.6%
Cap rate
0.6%
Rent to Value Ratio
Active
$3,995,000
6
bds
|
7
ba
|
4,567
sqft
|
built
2017
2020 NW 3rd Ave, Delray Beach, FL 33444
$-18,193
Cash flow
-23.8%
Cash-on-Cash Return
0.7%
Cap rate
0.2%
Rent to Value Ratio
Active
$450,000
3
bds
|
2
ba
|
1,829
sqft
|
built
1993
5375 Monterey Cir, Delray Beach, FL 33484
$-1,374
Cash flow
-15.9%
Cash-on-Cash Return
2.5%
Cap rate
0.7%
Rent to Value Ratio
Active
$200,000
2
bds
|
2
ba
|
848
sqft
|
built
1985
2339 Linton Ridge Cir, Delray Beach, FL 33444
$-310
Cash flow
-8.1%
Cash-on-Cash Return
4.3%
Cap rate
1.0%
Rent to Value Ratio
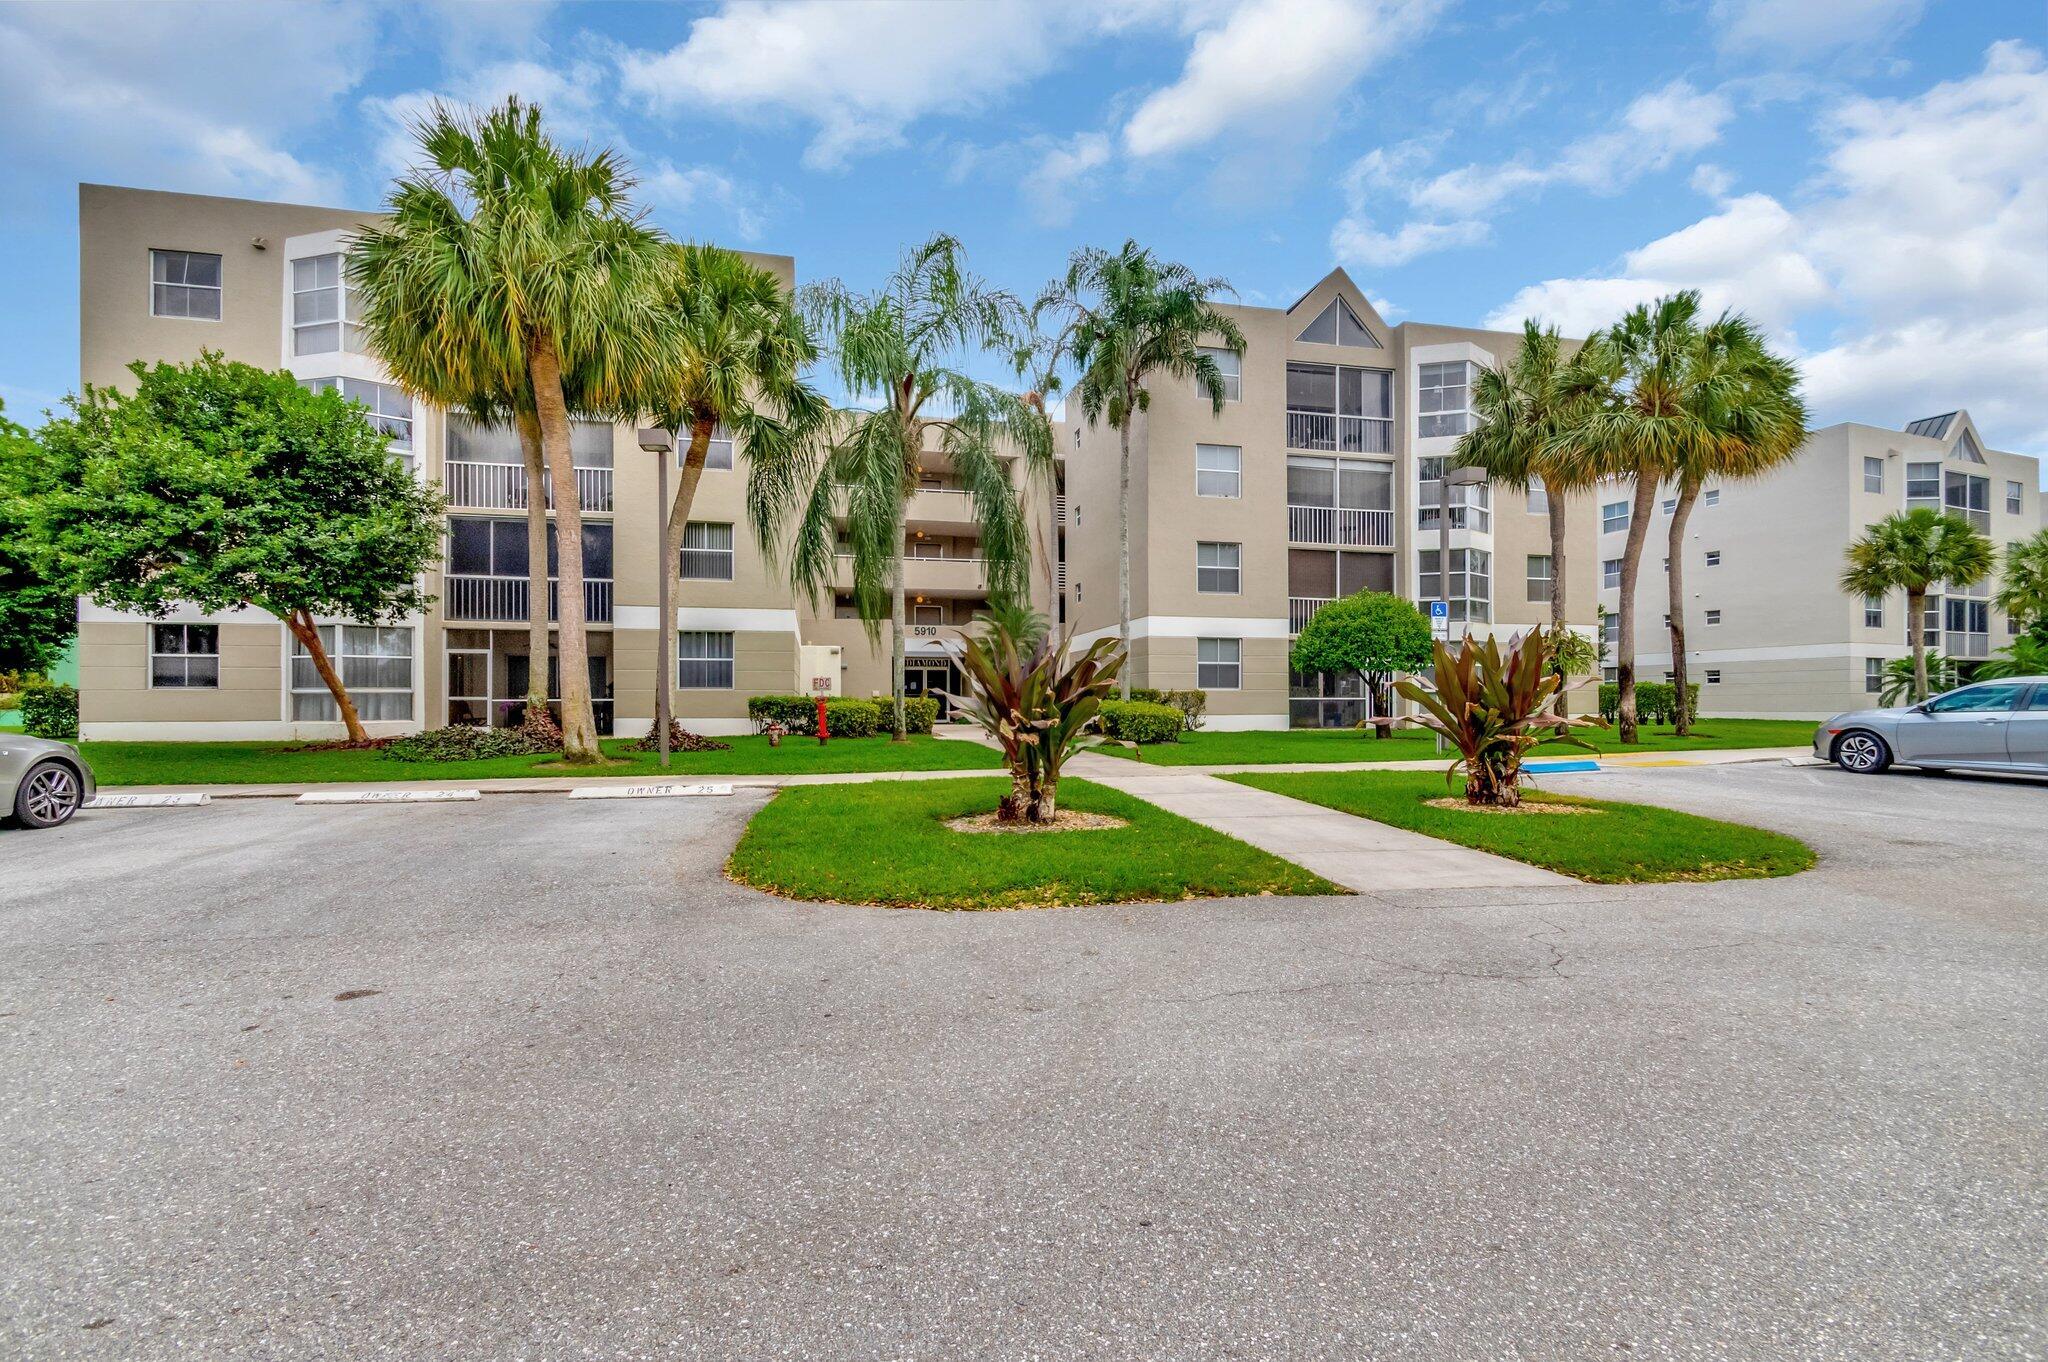
Active
$240,000
2
bds
|
2
ba
|
1,138
sqft
|
built
1990
5910 Morningstar Cir, Delray Beach, FL 33484
$-731
Cash flow
-15.9%
Cash-on-Cash Return
2.5%
Cap rate
0.9%
Rent to Value Ratio
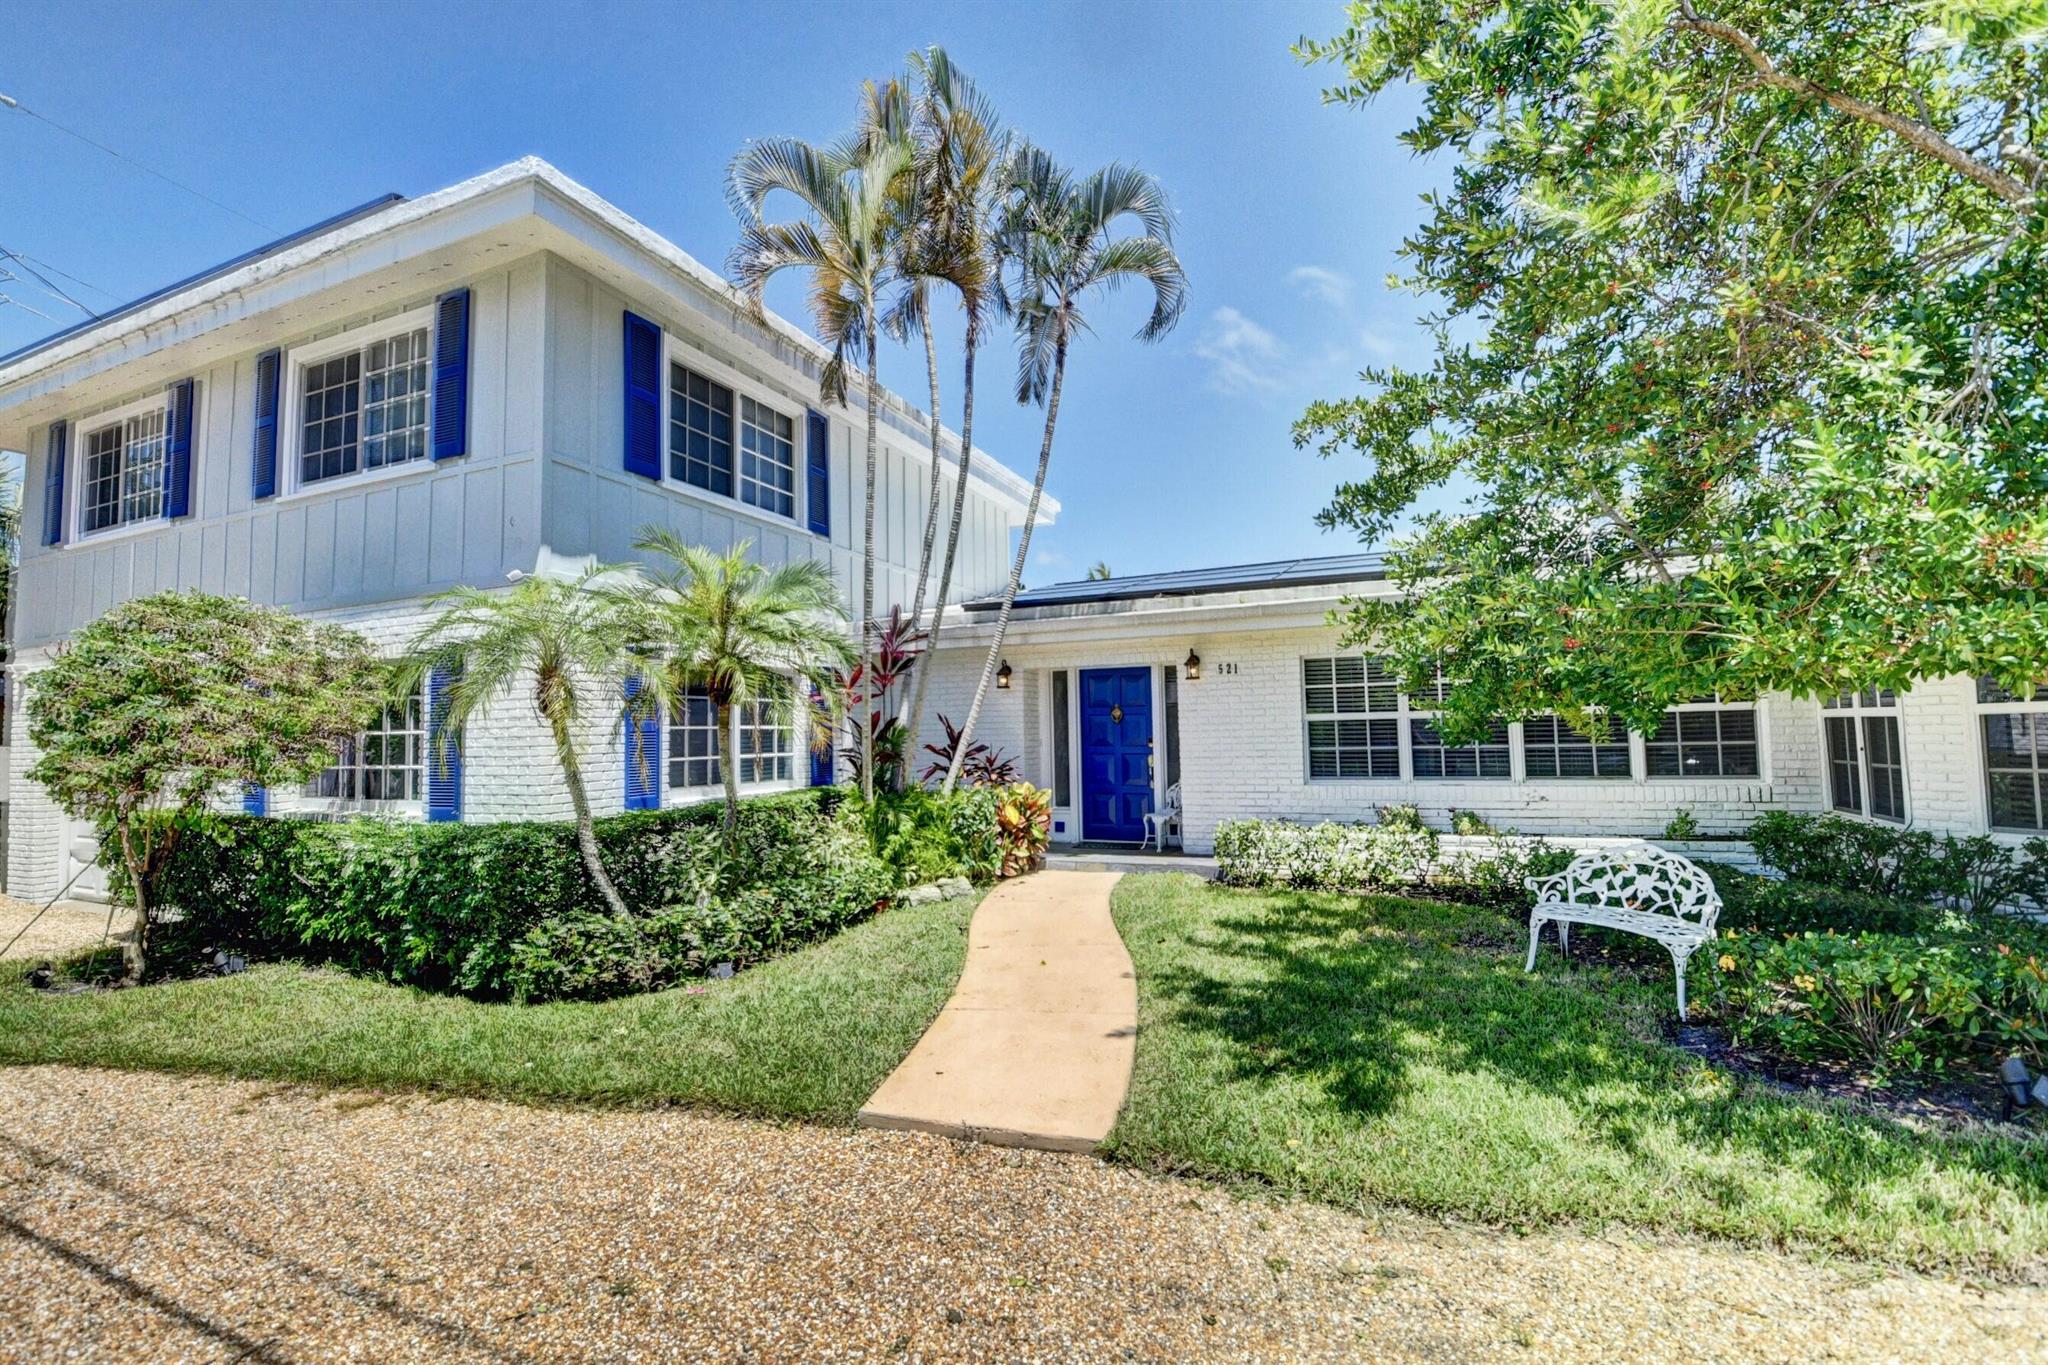
Active
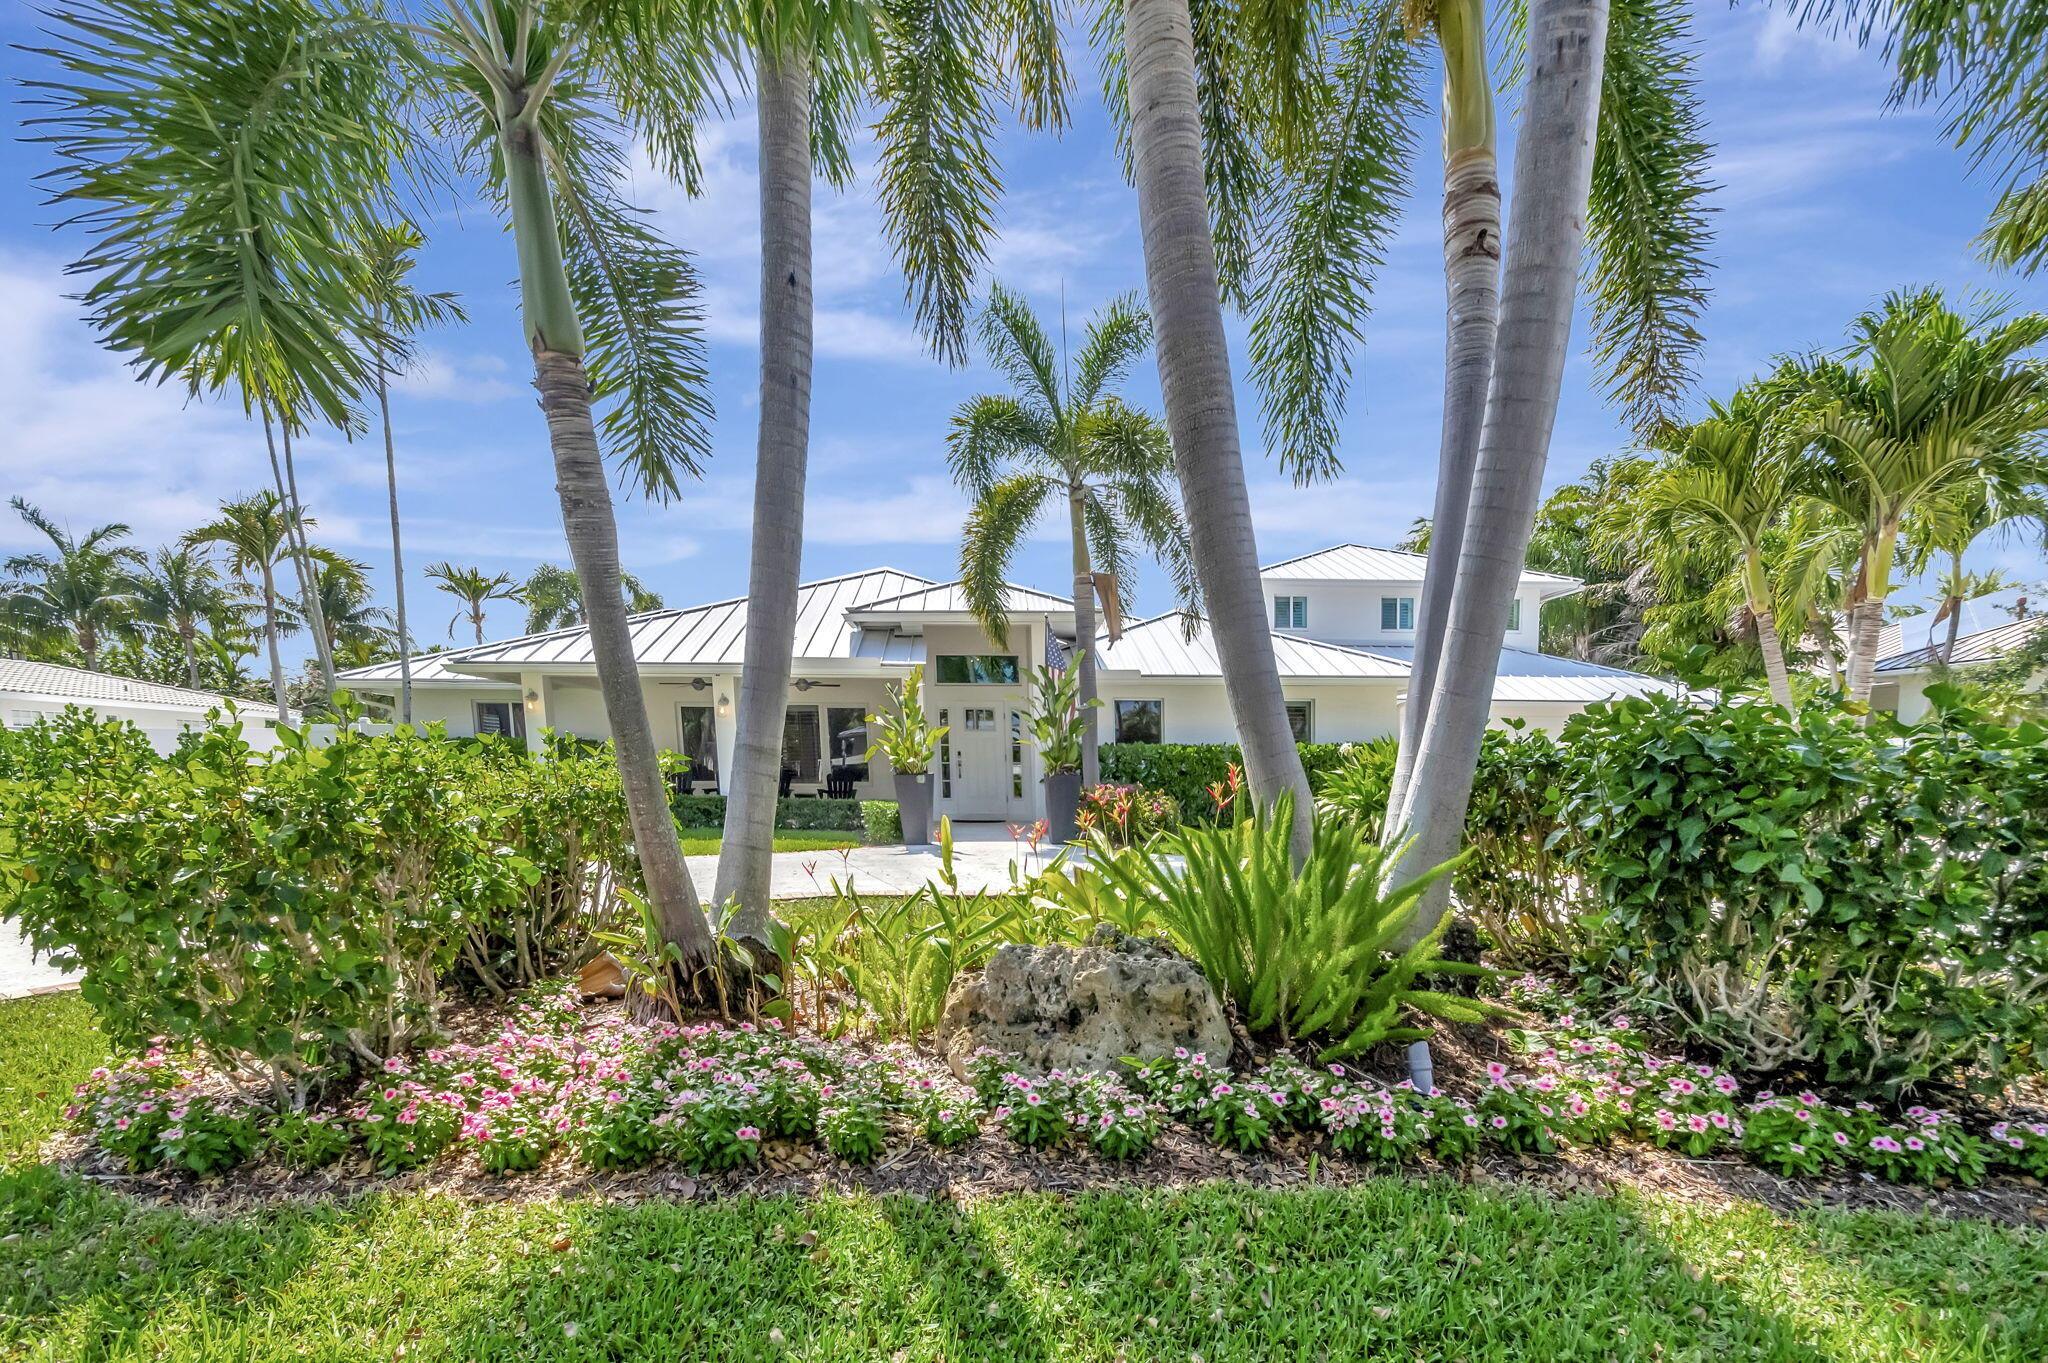
$2,175,000
5
bds
|
5
ba
|
2,536
sqft
|
built
1953
521 NW 14th St, Delray Beach, FL 33444
$-7,720
Cash flow
-18.5%
Cash-on-Cash Return
1.9%
Cap rate
0.3%
Rent to Value Ratio
Active
$1,685,000
3
bds
|
3
ba
|
2,638
sqft
|
built
1998
7928 Villa D Este Way, Delray Beach, FL 33446
$-4,369
Cash flow
-13.5%
Cash-on-Cash Return
3.0%
Cap rate
0.4%
Rent to Value Ratio
Active
$425,000
3
bds
|
2
ba
|
1,433
sqft
|
built
2002
2022 Alta Meadows Ln, Delray Beach, FL 33444
$-895
Cash flow
-11.0%
Cash-on-Cash Return
3.6%
Cap rate
0.8%
Rent to Value Ratio
Active
$2,700,000
5
bds
|
5
ba
|
4,000
sqft
|
built
1965
1650 NE 3rd Ave, Delray Beach, FL 33444
$-11,580
Cash flow
-22.4%
Cash-on-Cash Return
1.0%
Cap rate
0.2%
Rent to Value Ratio
Active
$775,000
3
bds
|
2
ba
|
1,094
sqft
|
built
1959
265 NE 13th St, Delray Beach, FL 33444
$-1,343
Cash flow
-9.0%
Cash-on-Cash Return
4.1%
Cap rate
0.5%
Rent to Value Ratio
Active
$210,000
2
bds
|
2
ba
|
1,104
sqft
|
built
1979
2800 Fiore Way, Delray Beach, FL 33445
$-528
Cash flow
-13.1%
Cash-on-Cash Return
3.1%
Cap rate
1.0%
Rent to Value Ratio
Active
$7,749,500
4
bds
|
5
ba
|
4,087
sqft
|
built
2000
715 SE 8th St, Delray Beach, FL 33483
$-38,443
Cash flow
-25.9%
Cash-on-Cash Return
0.2%
Cap rate
0.1%
Rent to Value Ratio
Active
$250,000
1
bds
|
2
ba
|
910
sqft
|
built
1985
2955 SW 22nd Ave, Delray Beach, FL 33445
$-497
Cash flow
-10.4%
Cash-on-Cash Return
3.8%
Cap rate
0.8%
Rent to Value Ratio
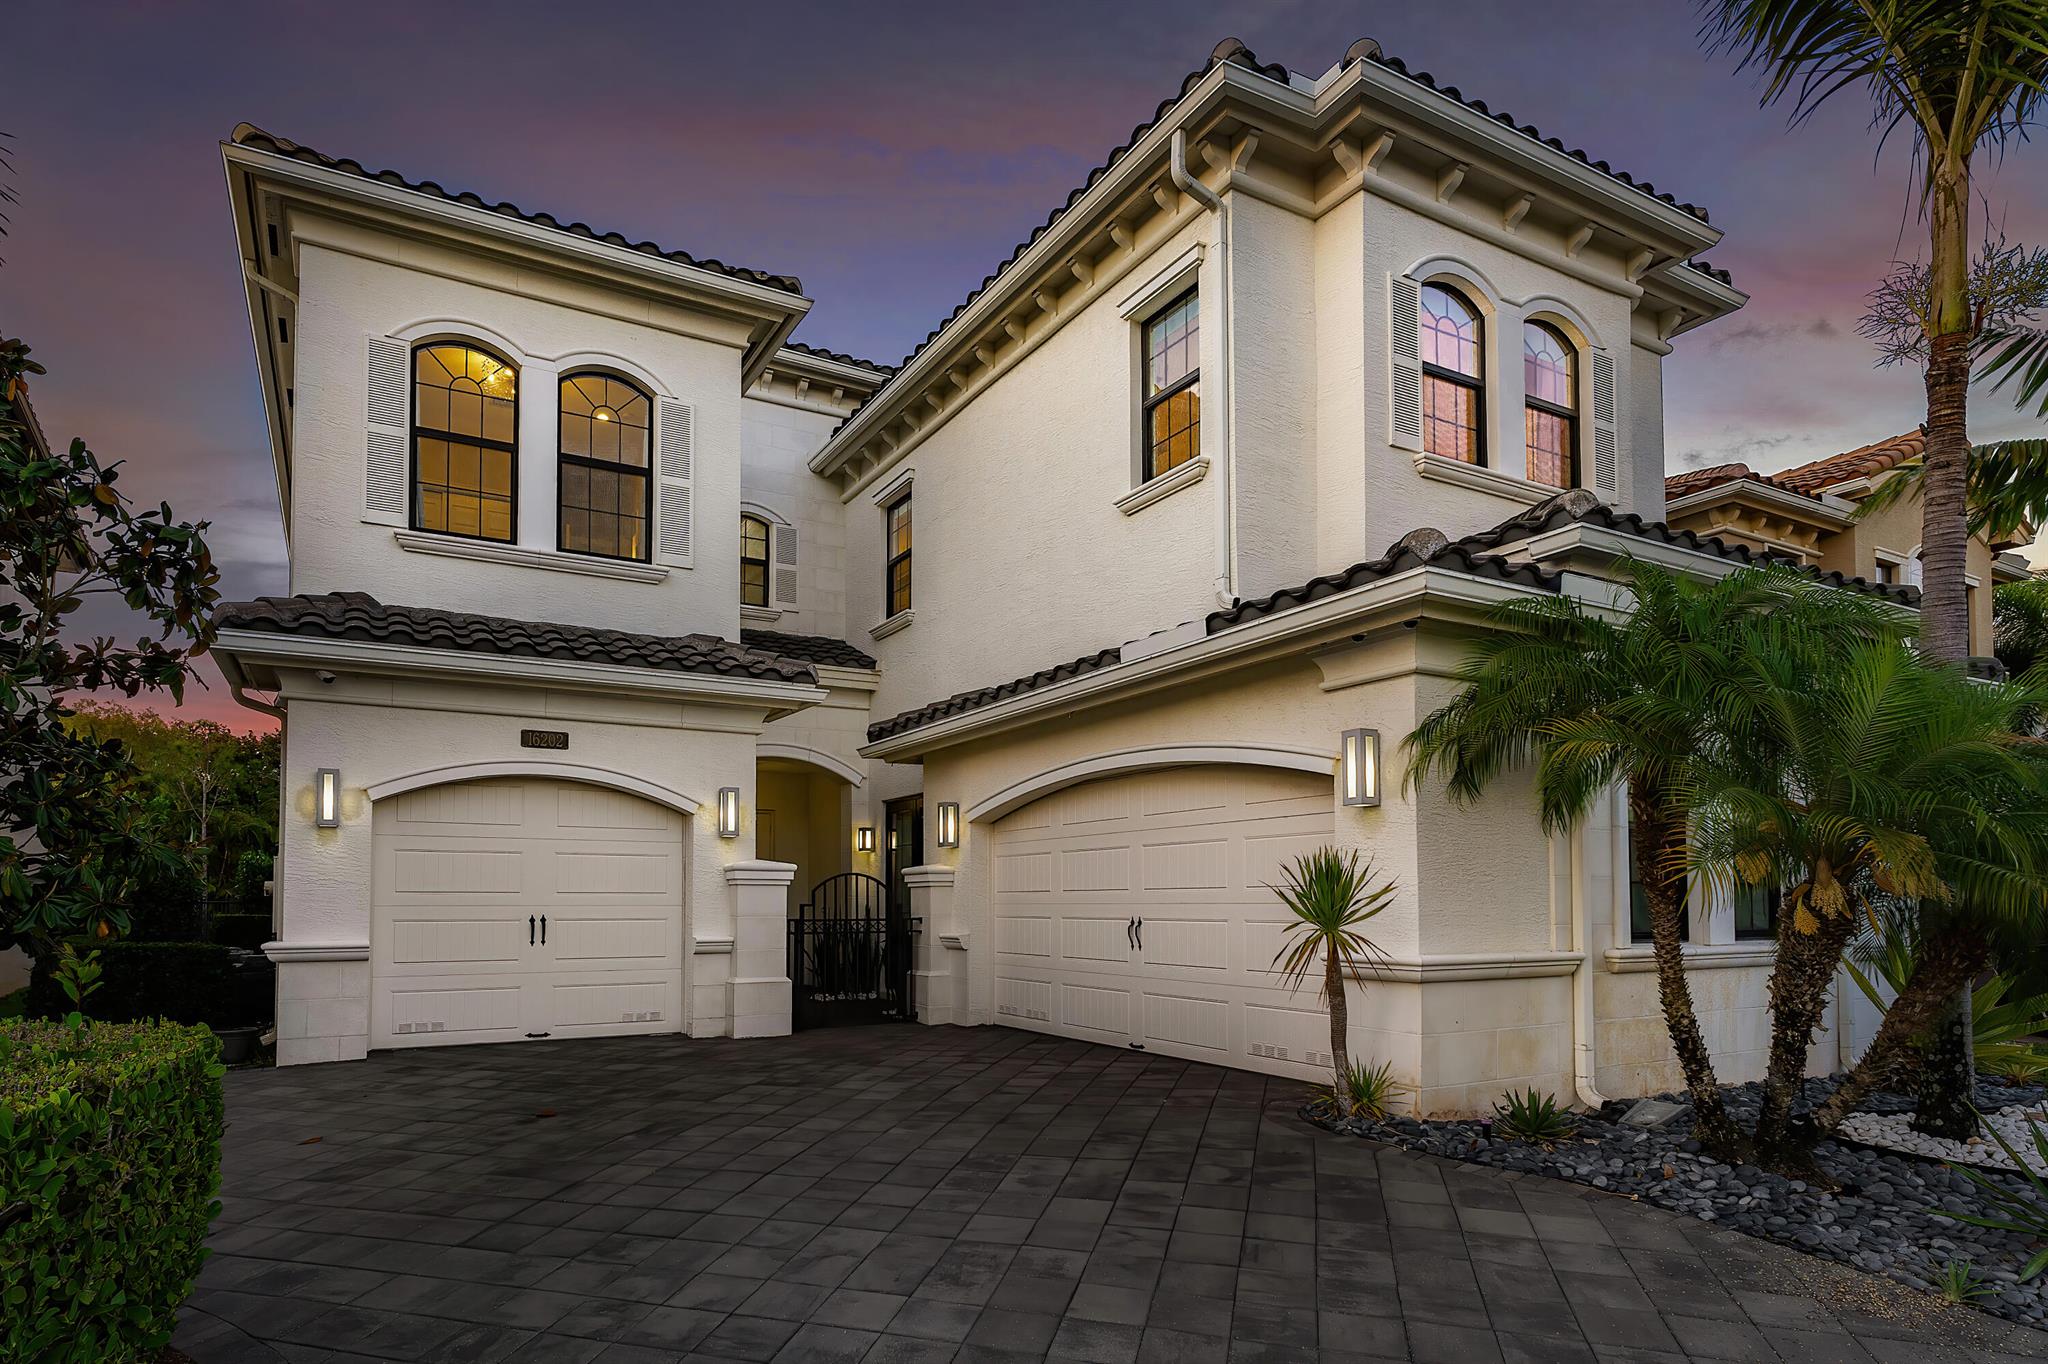
Active
$2,200,000
5
bds
|
6
ba
|
4,783
sqft
|
built
2018
16202 Cabernet Dr, Delray Beach, FL 33446
$-9,726
Cash flow
-23.1%
Cash-on-Cash Return
0.8%
Cap rate
0.3%
Rent to Value Ratio