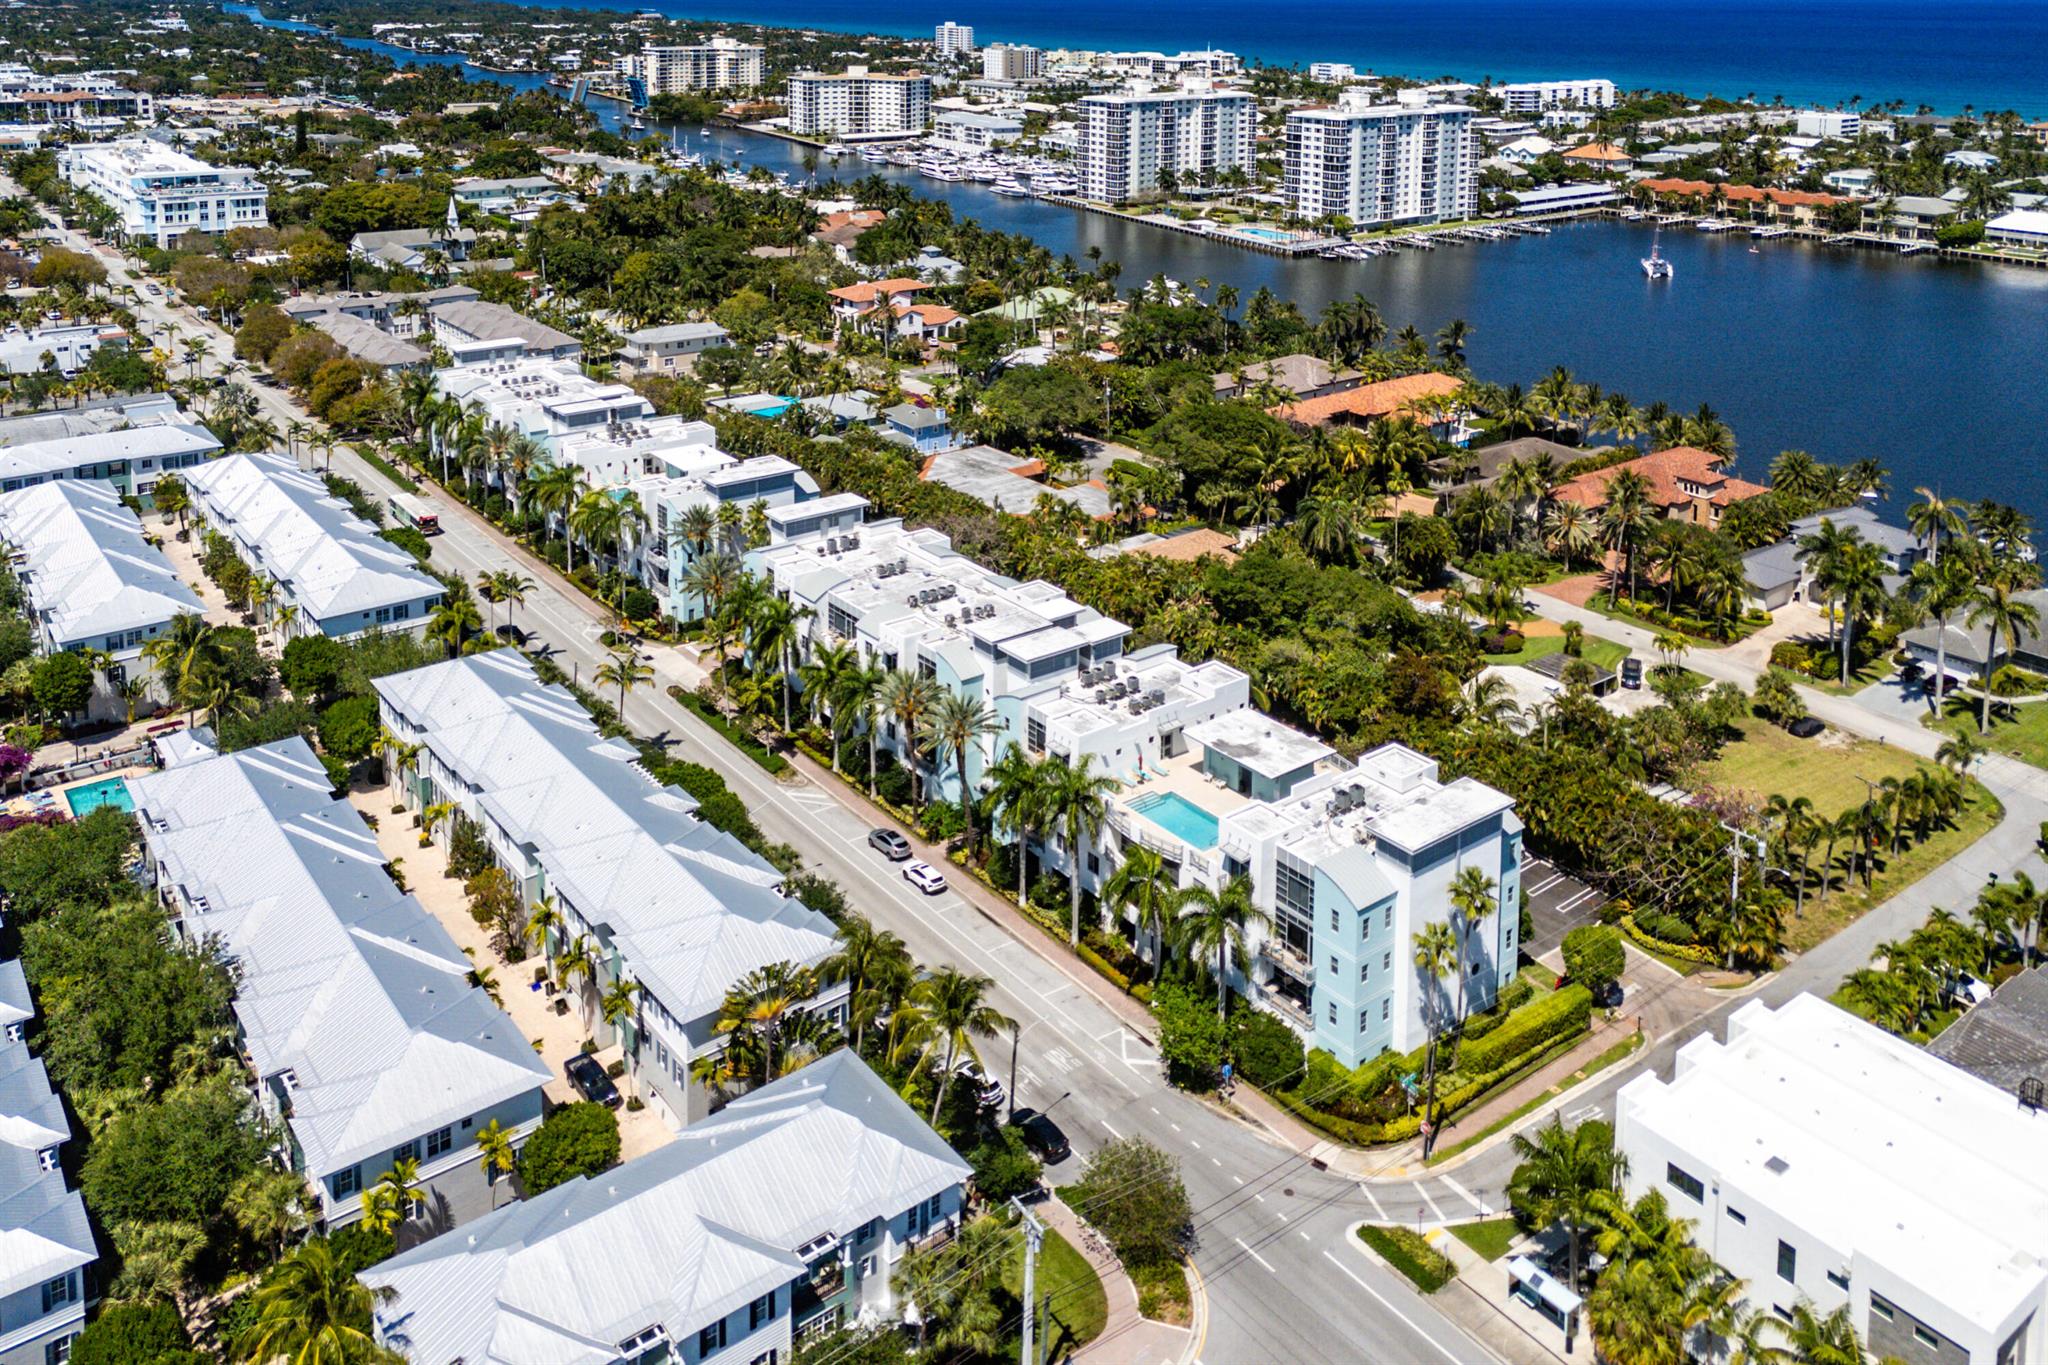
Delray Beach, FL Investment Properties for Sale
Browse homes for sale and investment properties in Delray Beach, FL. Refine your search by price, property type, or more.
Best cash flowing properties in Delray Beach, FL
Active
$132,000
2
bds
|
2
ba
|
1,005
sqft
|
built
1979
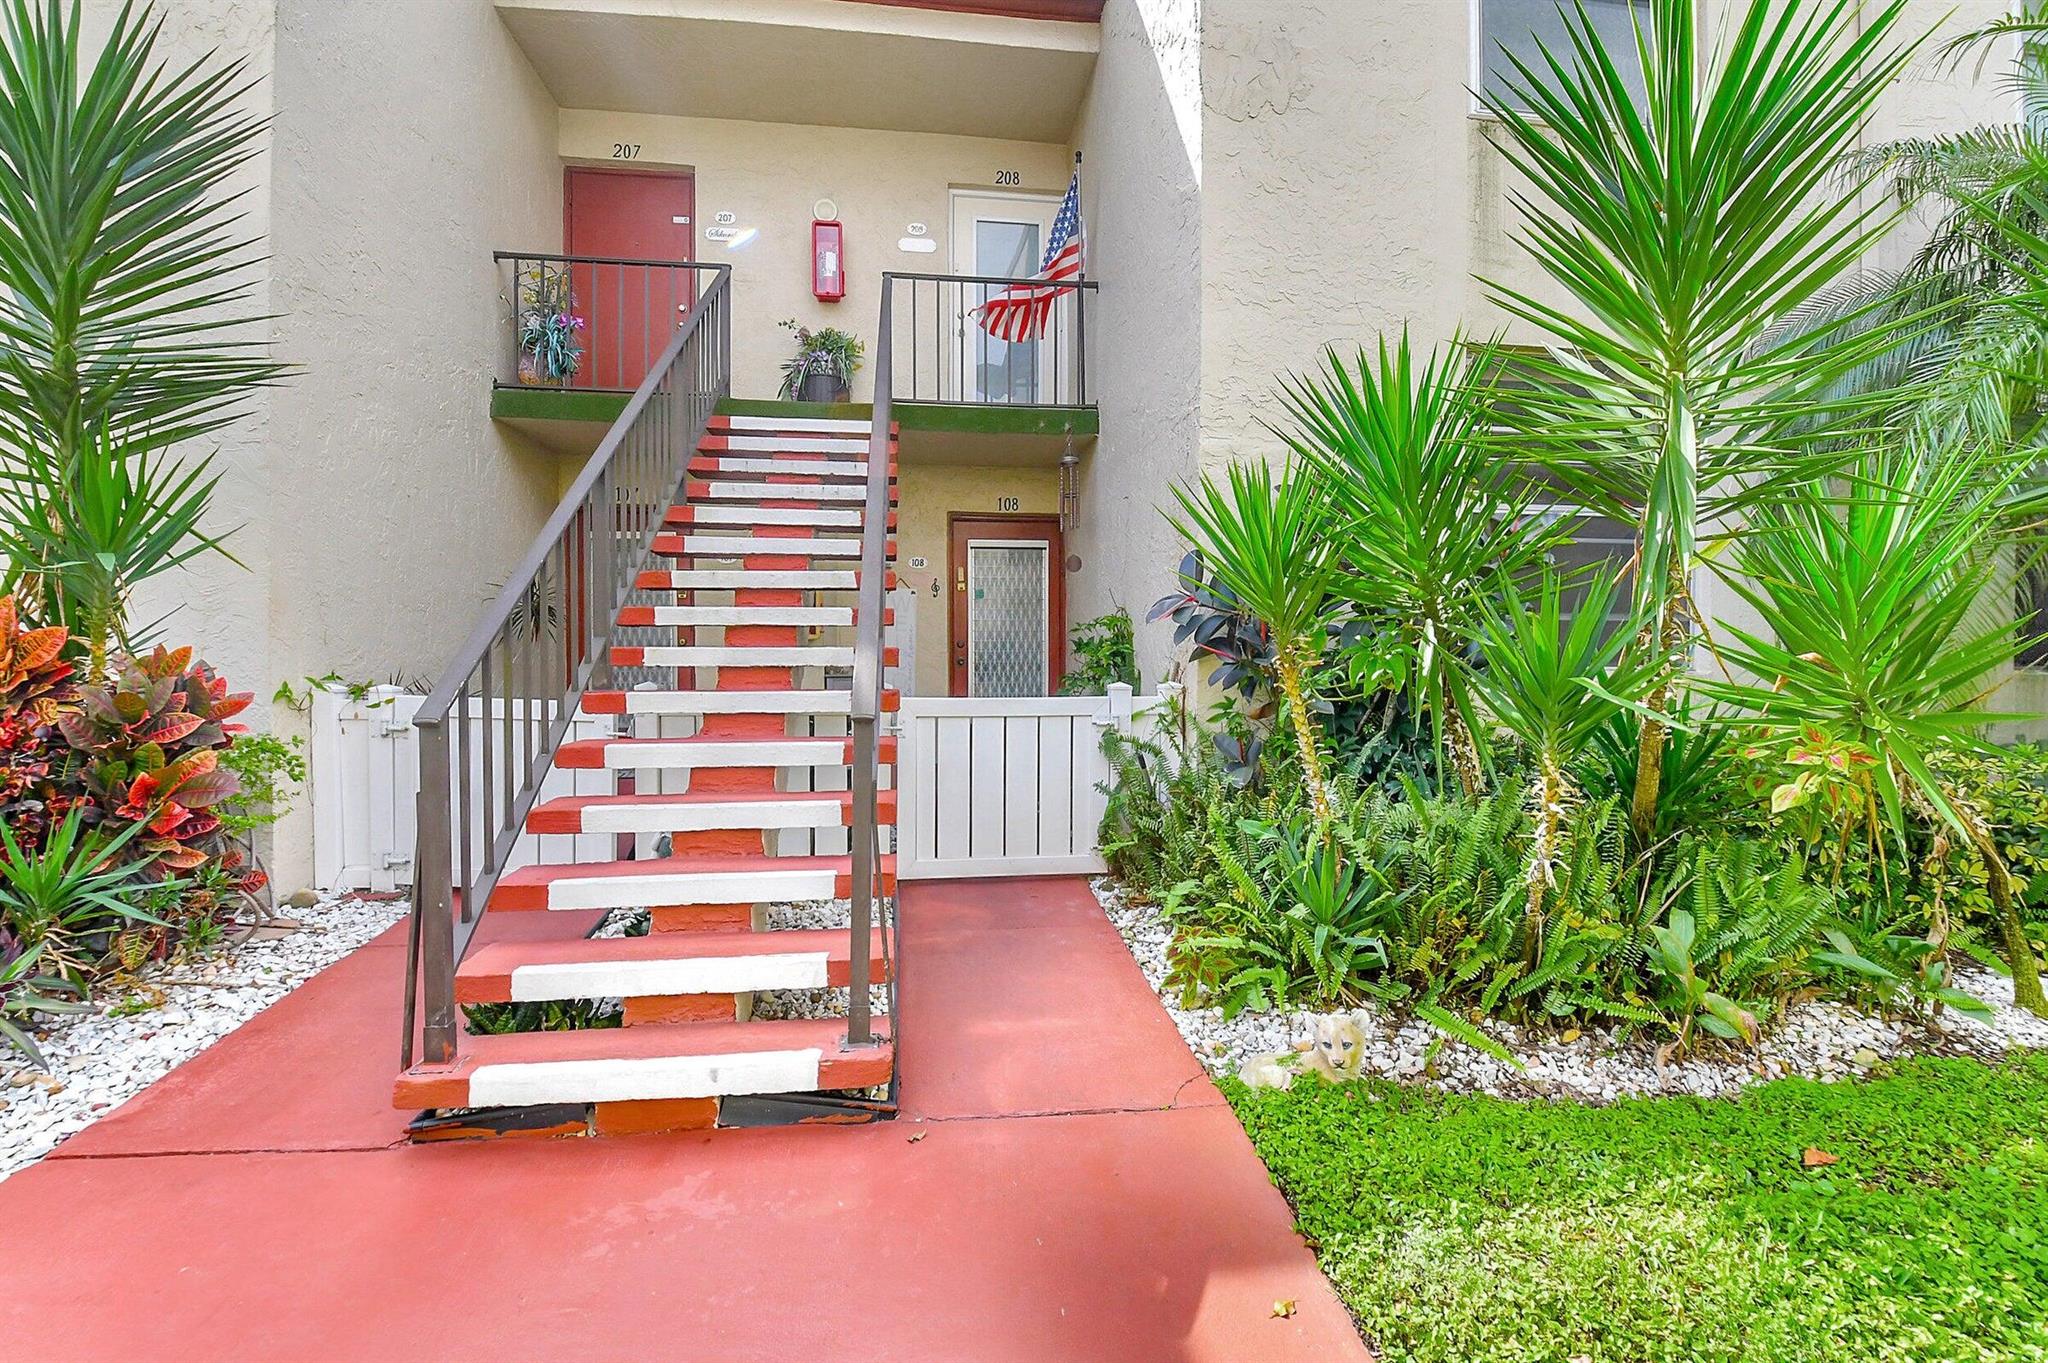
18 Willowbrook Ln, Delray Beach, FL 33446
$-128
Cash flow
-5.1%
Cash-on-Cash Return
5.0%
Cap rate
1.4%
Rent to Value Ratio
Active
$200,000
2
bds
|
2
ba
|
910
sqft
|
built
1978
408 Capri I, Delray Beach, FL 33484
$-343
Cash flow
-8.9%
Cash-on-Cash Return
4.1%
Cap rate
1.1%
Rent to Value Ratio
642 out of 740 properties for sale in Delray Beach, FL
Limited Results Shown
Create a free account, or log in to reveal all property listings and enjoy the complete experience.
Active
$2,200,000
5
bds
|
6
ba
|
4,783
sqft
|
built
2018
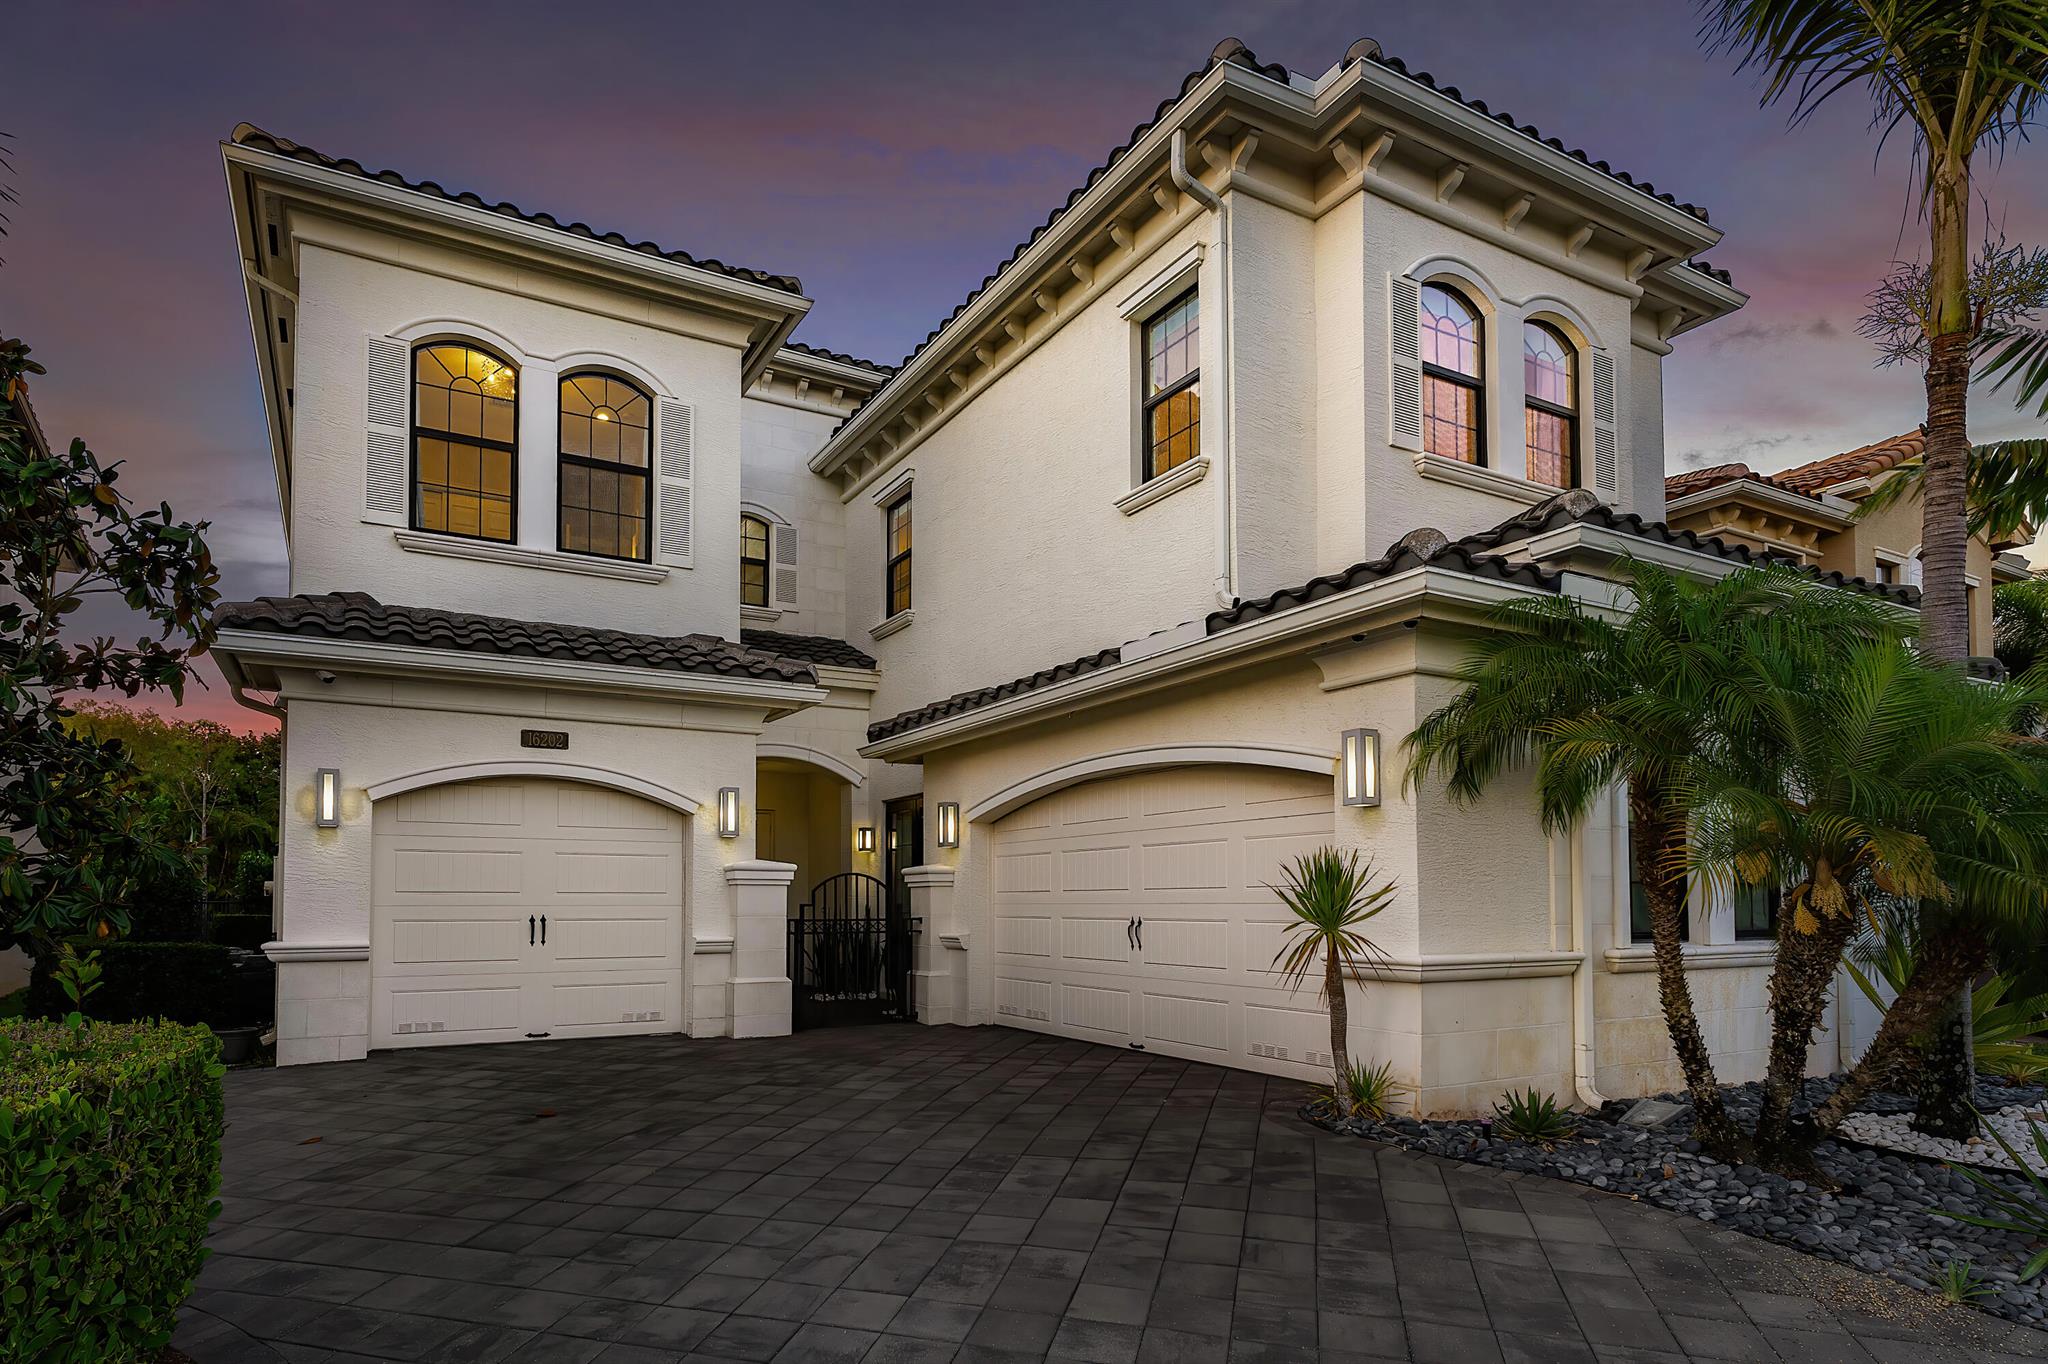
16202 Cabernet Dr, Delray Beach, FL 33446
$-9,726
Cash flow
-23.1%
Cash-on-Cash Return
0.8%
Cap rate
0.3%
Rent to Value Ratio
Active
$725,000
bds
|
0
ba
|
1,550
sqft
|
built
1945
607 SW 3rd St, Delray Beach, FL 33444
$-2,992
Cash flow
-21.5%
Cash-on-Cash Return
1.2%
Cap rate
0.3%
Rent to Value Ratio
Active
$1,150,000
2
bds
|
3
ba
|
1,343
sqft
|
built
2006
365 SE 6th Ave, Delray Beach, FL 33483
$-3,675
Cash flow
-16.7%
Cash-on-Cash Return
2.3%
Cap rate
0.6%
Rent to Value Ratio
Active
$950,000
3
bds
|
3
ba
|
2,098
sqft
|
built
1996
6346 San Michel Way, Delray Beach, FL 33484
$-3,046
Cash flow
-16.7%
Cash-on-Cash Return
2.3%
Cap rate
0.4%
Rent to Value Ratio

Active
$1,625,000
3
bds
|
3
ba
|
1,968
sqft
|
built
1951
1917 N Swinton Ave, Delray Beach, FL 33444
$-6,917
Cash flow
-22.2%
Cash-on-Cash Return
1.0%
Cap rate
0.3%
Rent to Value Ratio
Active
$6,250,000
5
bds
|
7
ba
|
6,079
sqft
|
built
2012
960 Dogwood Dr, Delray Beach, FL 33483
$-31,290
Cash flow
-26.1%
Cash-on-Cash Return
0.1%
Cap rate
0.1%
Rent to Value Ratio
Active
$4,000,000
4
bds
|
4
ba
|
3,750
sqft
|
built
1985
910 Greensward Ln, Delray Beach, FL 33445
$-17,344
Cash flow
-22.6%
Cash-on-Cash Return
0.9%
Cap rate
0.2%
Rent to Value Ratio
Active
$650,000
3
bds
|
2
ba
|
1,515
sqft
|
built
1998
4155 NW 1st Ct, Delray Beach, FL 33445
$-1,793
Cash flow
-14.4%
Cash-on-Cash Return
2.8%
Cap rate
0.6%
Rent to Value Ratio
Active
$599,000
3
bds
|
2
ba
|
1,476
sqft
|
built
1971
5227 Buchanan Rd, Delray Beach, FL 33484
$-1,378
Cash flow
-12.0%
Cash-on-Cash Return
3.4%
Cap rate
0.5%
Rent to Value Ratio
Active
$1,325,000
4
bds
|
4
ba
|
2,717
sqft
|
built
2020
13650 Whistler Mountain Rd, Delray Beach, FL 33446
$-3,853
Cash flow
-15.2%
Cash-on-Cash Return
2.7%
Cap rate
0.5%
Rent to Value Ratio

Active
$565,000
3
bds
|
3
ba
|
1,762
sqft
|
built
2013
4721 N Prive Cir, Delray Beach, FL 33445
$-1,286
Cash flow
-11.9%
Cash-on-Cash Return
3.4%
Cap rate
0.6%
Rent to Value Ratio
Active
$29,900,000
7
bds
|
10
ba
|
10,385
sqft
|
built
2005
410 N Ocean Blvd, Delray Beach, FL 33483
$-161,731
Cash flow
-28.2%
Cash-on-Cash Return
-0.3%
Cap rate
0.0%
Rent to Value Ratio
Active
$1,993,000
3
bds
|
3
ba
|
2,061
sqft
|
built
1955
308 Enfield Rd, Delray Beach, FL 33444
$-6,750
Cash flow
-17.7%
Cash-on-Cash Return
2.1%
Cap rate
0.4%
Rent to Value Ratio
Active
$1,995,000
4
bds
|
5
ba
|
4,050
sqft
|
built
2003
16312 Braeburn Ridge Trl, Delray Beach, FL 33446
$-6,993
Cash flow
-18.3%
Cash-on-Cash Return
1.9%
Cap rate
0.3%
Rent to Value Ratio
Active
$718,000
3
bds
|
2
ba
|
1,833
sqft
|
built
1997
5215 Ventura Dr, Delray Beach, FL 33484
$-2,092
Cash flow
-15.2%
Cash-on-Cash Return
2.7%
Cap rate
0.5%
Rent to Value Ratio
Active
$495,000
2
bds
|
2
ba
|
1,413
sqft
|
built
1985
100 Pelican Pointe Dr, Delray Beach, FL 33483
$-1,300
Cash flow
-13.7%
Cash-on-Cash Return
3.0%
Cap rate
0.8%
Rent to Value Ratio
Active
$2,100,000
3
bds
|
3
ba
|
1,455
sqft
|
built
1939
42 Palm Sq, Delray Beach, FL 33483
$-8,331
Cash flow
-20.7%
Cash-on-Cash Return
1.4%
Cap rate
0.2%
Rent to Value Ratio

Active
$329,000
3
bds
|
2
ba
|
1,765
sqft
|
built
1986
16032 Lomond Hills Trl, Delray Beach, FL 33446
$-892
Cash flow
-14.1%
Cash-on-Cash Return
2.9%
Cap rate
1.1%
Rent to Value Ratio
Active
$4,750,000
6
bds
|
6
ba
|
5,455
sqft
|
built
1980
1030 Rhodes Villa Ave, Delray Beach, FL 33483
$-24,508
Cash flow
-26.9%
Cash-on-Cash Return
0.0%
Cap rate
0.2%
Rent to Value Ratio
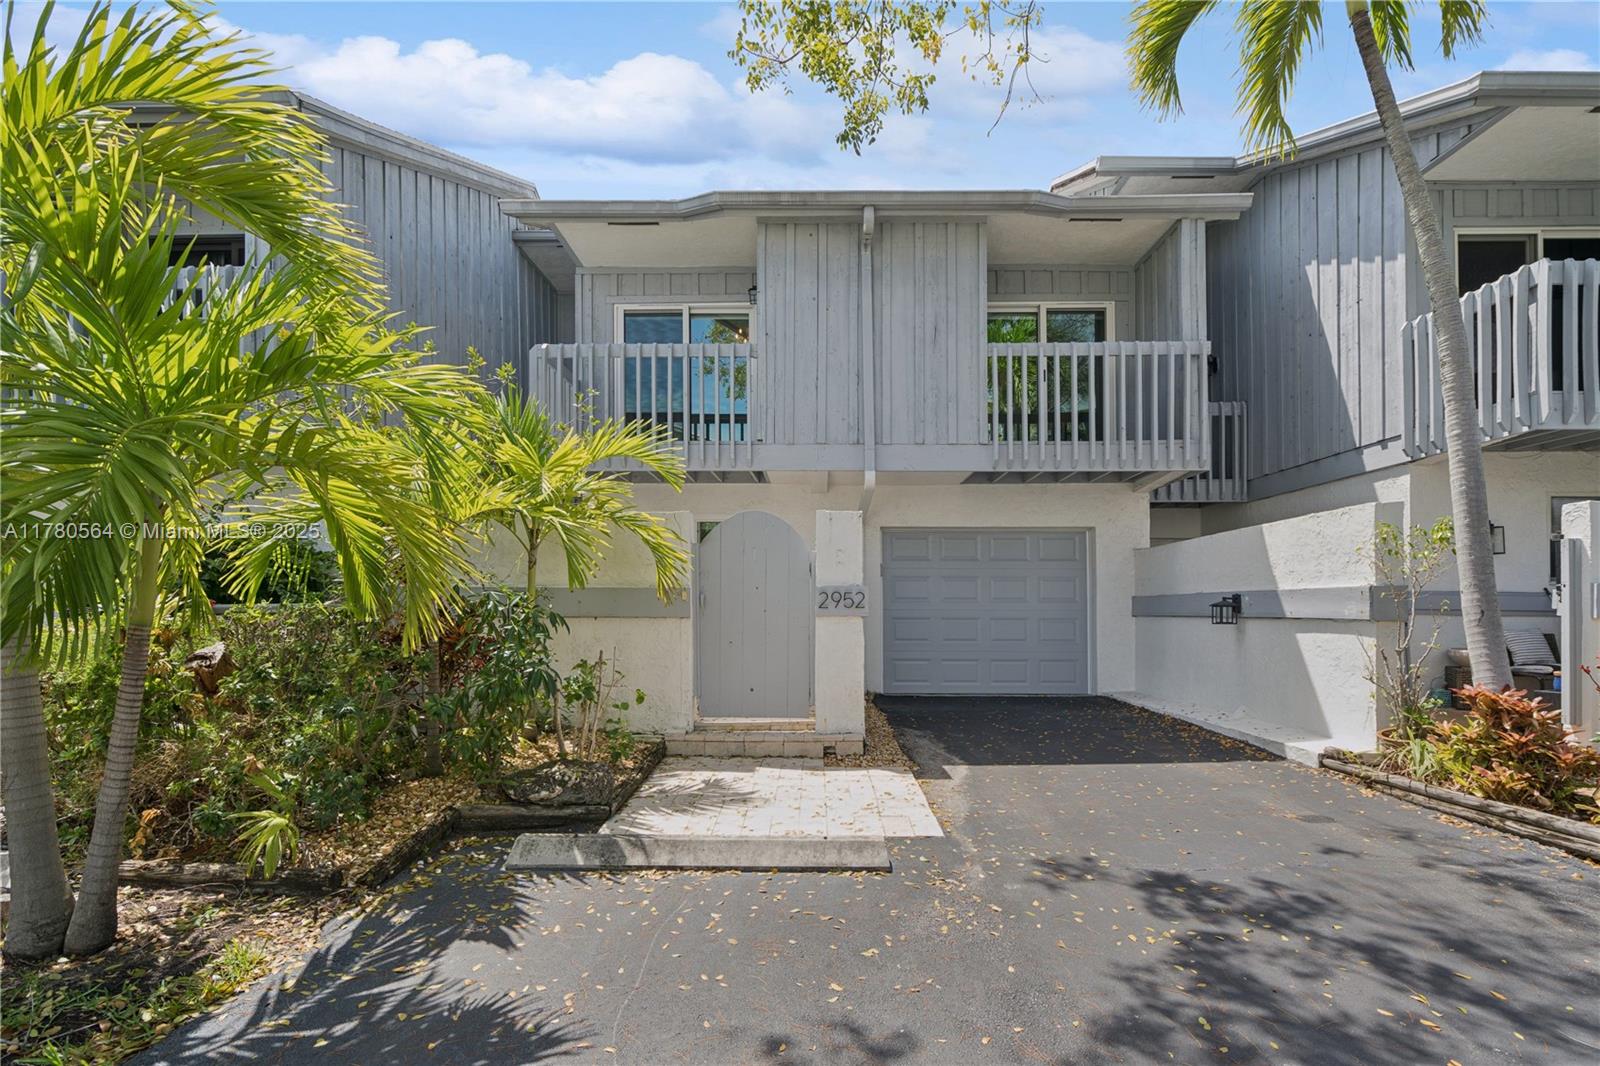
Active
$679,000
3
bds
|
3
ba
|
1,938
sqft
|
built
1985
2952 Florida Blvd, Delray Beach, FL 33483
$-1,681
Cash flow
-12.9%
Cash-on-Cash Return
3.2%
Cap rate
0.6%
Rent to Value Ratio
Active
$975,000
3
bds
|
3
ba
|
2,608
sqft
|
built
1997
7695 Villa D Este Way, Delray Beach, FL 33446
$-981
Cash flow
-5.2%
Cash-on-Cash Return
4.9%
Cap rate
0.7%
Rent to Value Ratio
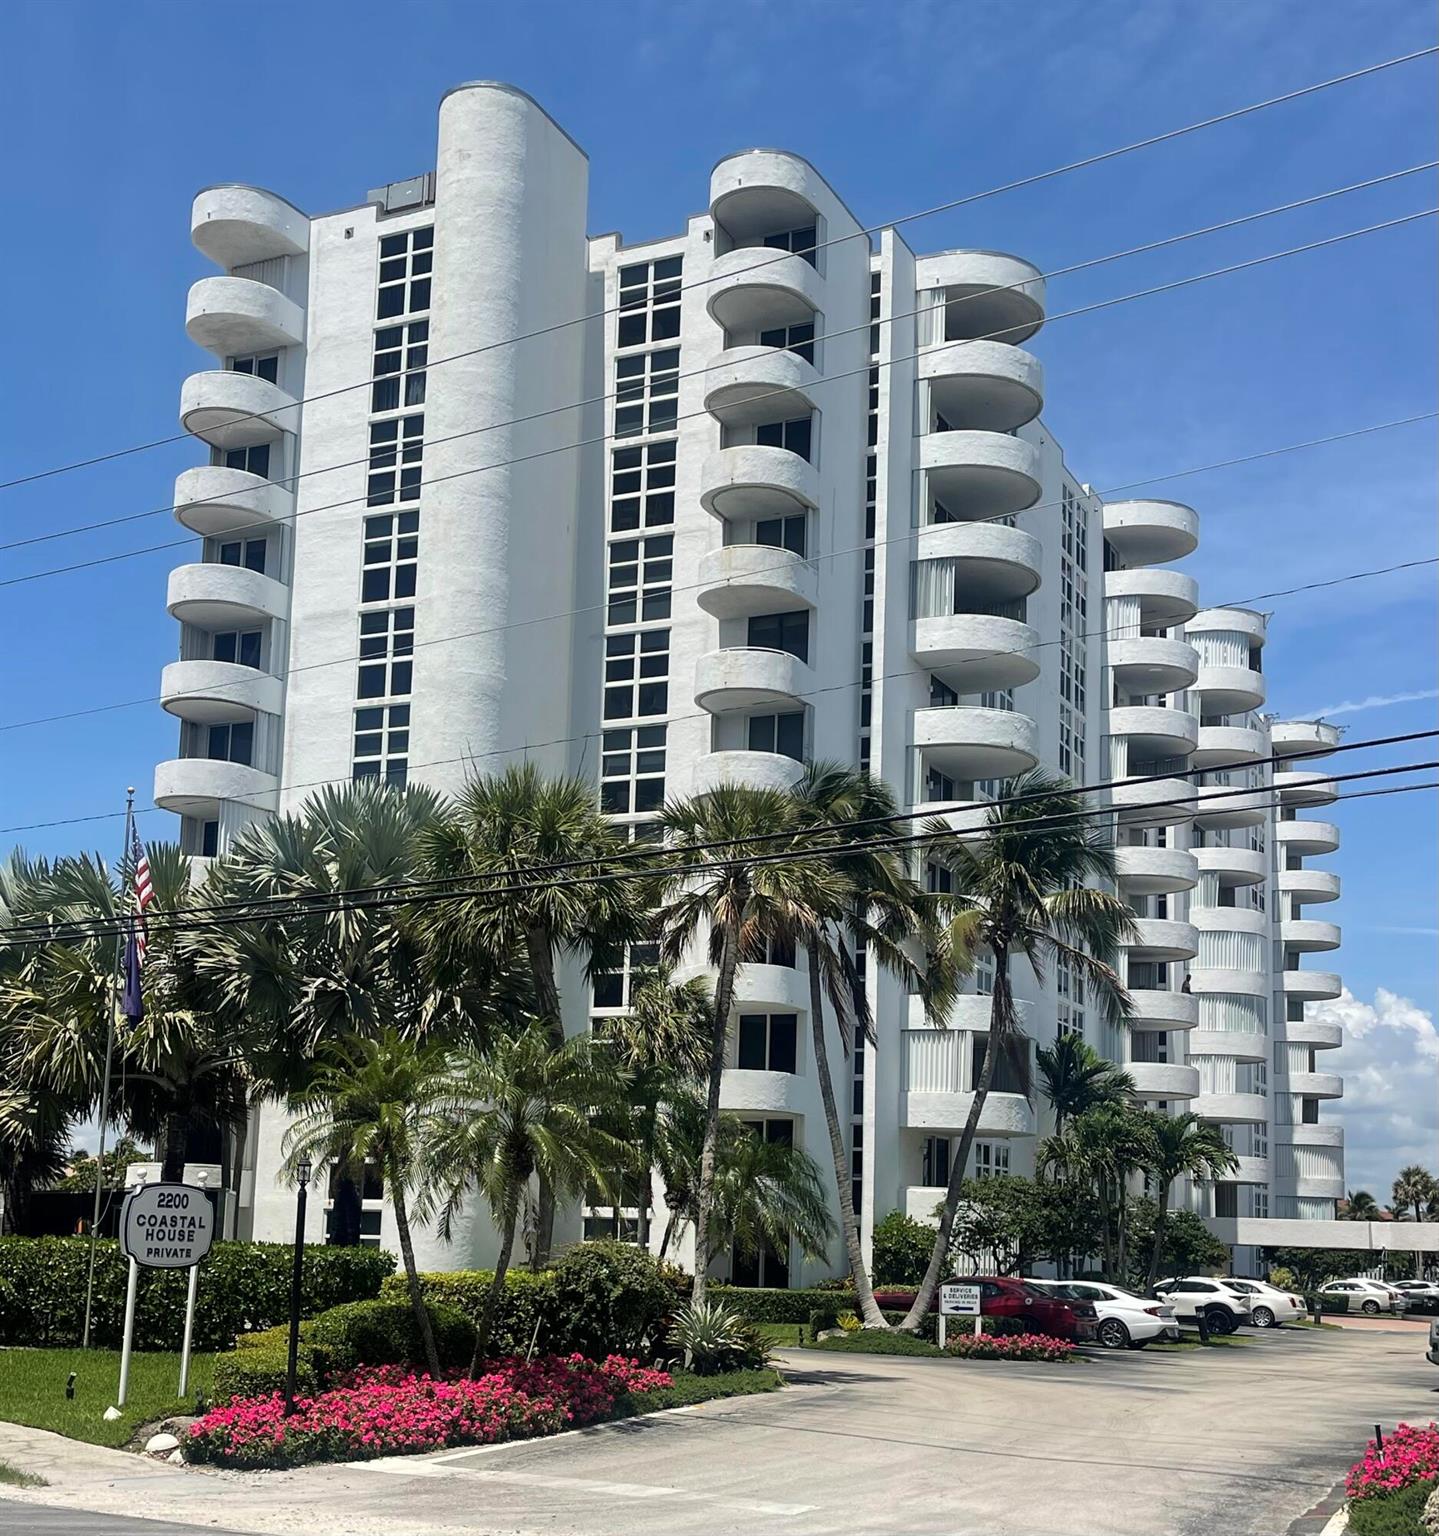
Active
$697,000
2
bds
|
2
ba
|
1,482
sqft
|
built
1970
2200 S Ocean Blvd, Delray Beach, FL 33483
$-2,814
Cash flow
-21.1%
Cash-on-Cash Return
1.3%
Cap rate
0.6%
Rent to Value Ratio
Pending
$565,000
3
bds
|
1
ba
|
1,446
sqft
|
built
1965
5349 Van Buren Rd, Delray Beach, FL 33484
$-1,386
Cash flow
-12.8%
Cash-on-Cash Return
3.2%
Cap rate
0.5%
Rent to Value Ratio
Active
$429,000
3
bds
|
2
ba
|
1,362
sqft
|
built
2002
2046 Alta Meadows Ln, Delray Beach, FL 33444
$-1,013
Cash flow
-12.3%
Cash-on-Cash Return
3.3%
Cap rate
0.7%
Rent to Value Ratio
Active
$849,999
2
bds
|
2
ba
|
1,196
sqft
|
built
1965
201 Venetian Dr, Delray Beach, FL 33483
$-3,030
Cash flow
-18.6%
Cash-on-Cash Return
1.9%
Cap rate
0.5%
Rent to Value Ratio
Active
$1,599,000
3
bds
|
4
ba
|
2,715
sqft
|
built
1989
16890 Colchester Ct, Delray Beach, FL 33484
$-3,056
Cash flow
-10.0%
Cash-on-Cash Return
3.9%
Cap rate
0.6%
Rent to Value Ratio

Active
$271,000
2
bds
|
2
ba
|
1,214
sqft
|
built
1979
570 SW 20th Ct, Delray Beach, FL 33445
$-445
Cash flow
-8.6%
Cash-on-Cash Return
4.2%
Cap rate
0.9%
Rent to Value Ratio
Active
$520,000
3
bds
|
3
ba
|
2,164
sqft
|
built
1990
5315 Monterey Cir, Delray Beach, FL 33484
$-1,584
Cash flow
-15.9%
Cash-on-Cash Return
2.5%
Cap rate
0.7%
Rent to Value Ratio
Active
$749,888
5
bds
|
3
ba
|
3,019
sqft
|
built
2003
4765 S Classical Blvd, Delray Beach, FL 33445
$-1,842
Cash flow
-12.8%
Cash-on-Cash Return
3.2%
Cap rate
0.6%
Rent to Value Ratio
Active
$132,000
2
bds
|
2
ba
|
1,005
sqft
|
built
1979
18 Willowbrook Ln, Delray Beach, FL 33446
$-128
Cash flow
-5.1%
Cash-on-Cash Return
5.0%
Cap rate
1.4%
Rent to Value Ratio
Active
$2,125,000
3
bds
|
3
ba
|
2,405
sqft
|
built
1959
225 NW 11th St, Delray Beach, FL 33444
$-5,859
Cash flow
-14.4%
Cash-on-Cash Return
2.8%
Cap rate
0.5%
Rent to Value Ratio
Active
$229,900
1
bds
|
2
ba
|
717
sqft
|
built
1985
5884 Morningstar Cir, Delray Beach, FL 33484
$-778
Cash flow
-17.7%
Cash-on-Cash Return
2.1%
Cap rate
0.8%
Rent to Value Ratio
Active
$919,000
3
bds
|
3
ba
|
1,975
sqft
|
built
1981
126 Harbor Cir, Delray Beach, FL 33483
$-2,227
Cash flow
-12.6%
Cash-on-Cash Return
3.2%
Cap rate
0.6%
Rent to Value Ratio
Active under contract
$495,000
3
bds
|
3
ba
|
1,887
sqft
|
built
2005
4627 Danson Way, Delray Beach, FL 33445
$-1,231
Cash flow
-13.0%
Cash-on-Cash Return
3.2%
Cap rate
0.7%
Rent to Value Ratio

Active
$2,795,000
5
bds
|
4
ba
|
2,355
sqft
|
built
1974
952 Mc Cleary St, Delray Beach, FL 33483
$-10,268
Cash flow
-19.2%
Cash-on-Cash Return
1.7%
Cap rate
0.4%
Rent to Value Ratio
Active
$1,180,000
4
bds
|
2
ba
|
2,370
sqft
|
built
1986
8410 Sawpine Rd, Delray Beach, FL 33446
$-2,148
Cash flow
-9.5%
Cash-on-Cash Return
4.0%
Cap rate
0.6%
Rent to Value Ratio
Active
$2,100,000
5
bds
|
5
ba
|
4,331
sqft
|
built
2015
16621 Germaine Dr, Delray Beach, FL 33446
$-11,478
Cash flow
-28.5%
Cash-on-Cash Return
-0.4%
Cap rate
0.1%
Rent to Value Ratio
Active
$599,000
3
bds
|
2
ba
|
1,579
sqft
|
built
1960
525 Ibis Dr, Delray Beach, FL 33444
$-1,279
Cash flow
-11.1%
Cash-on-Cash Return
3.6%
Cap rate
0.6%
Rent to Value Ratio
Active
$200,000
2
bds
|
2
ba
|
910
sqft
|
built
1978
408 Capri I, Delray Beach, FL 33484
$-343
Cash flow
-8.9%
Cash-on-Cash Return
4.1%
Cap rate
1.1%
Rent to Value Ratio
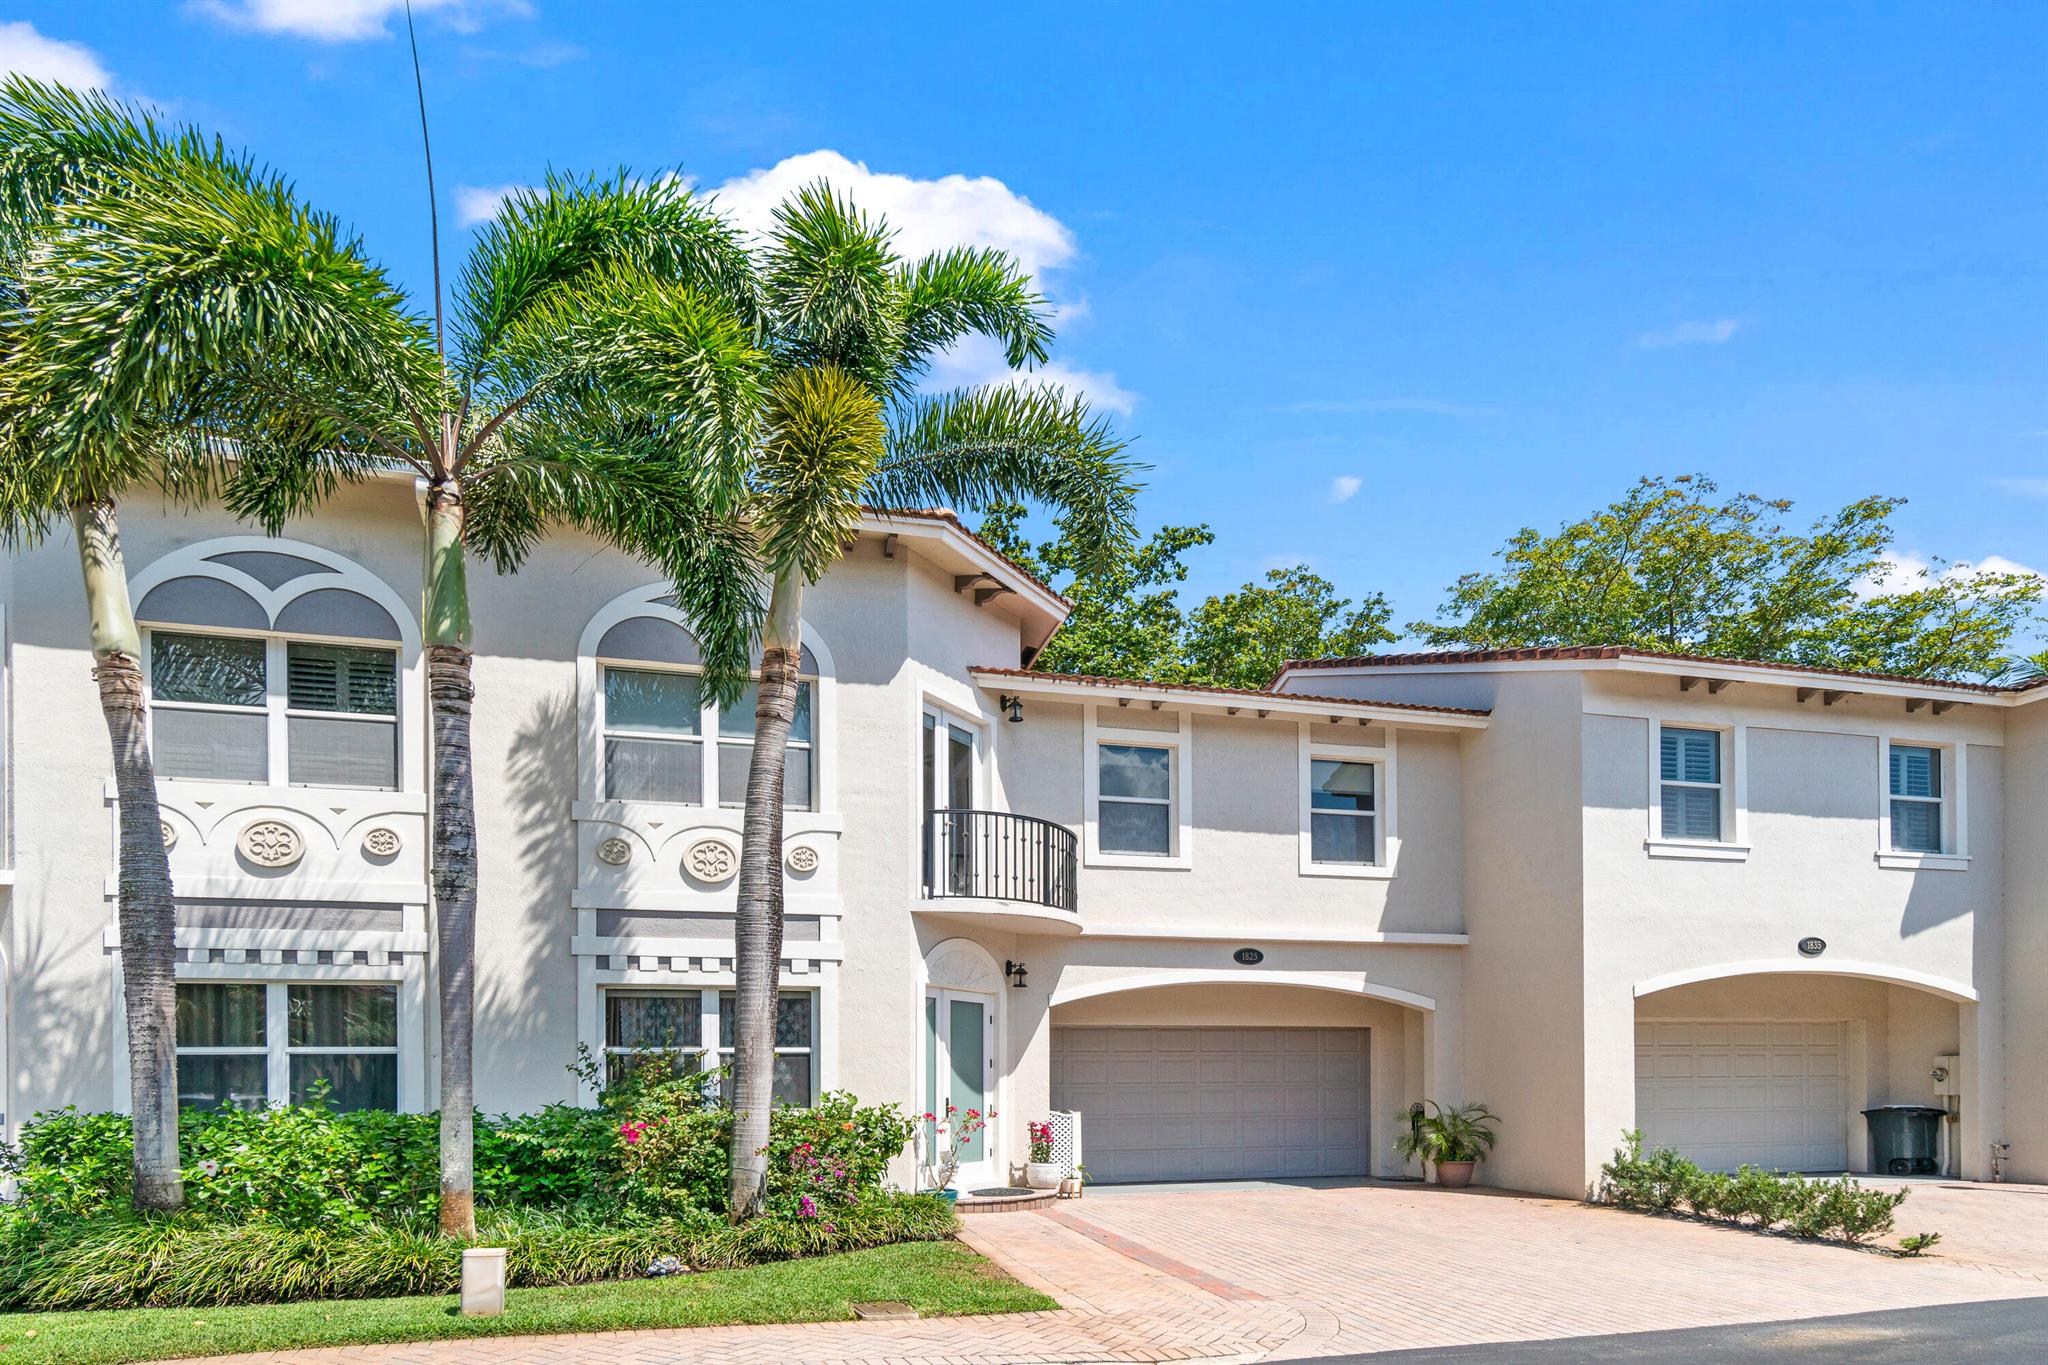
Active
$789,000
4
bds
|
3
ba
|
2,538
sqft
|
built
2006
1825 Highland Grove Dr, Delray Beach, FL 33445
$-1,440
Cash flow
-9.5%
Cash-on-Cash Return
4.0%
Cap rate
0.7%
Rent to Value Ratio