Denver, CO Investment Properties for Sale
Browse homes for sale and investment properties in Denver, CO. Refine your search by price, property type, or more.
Best cash flowing properties in Denver, CO
Active
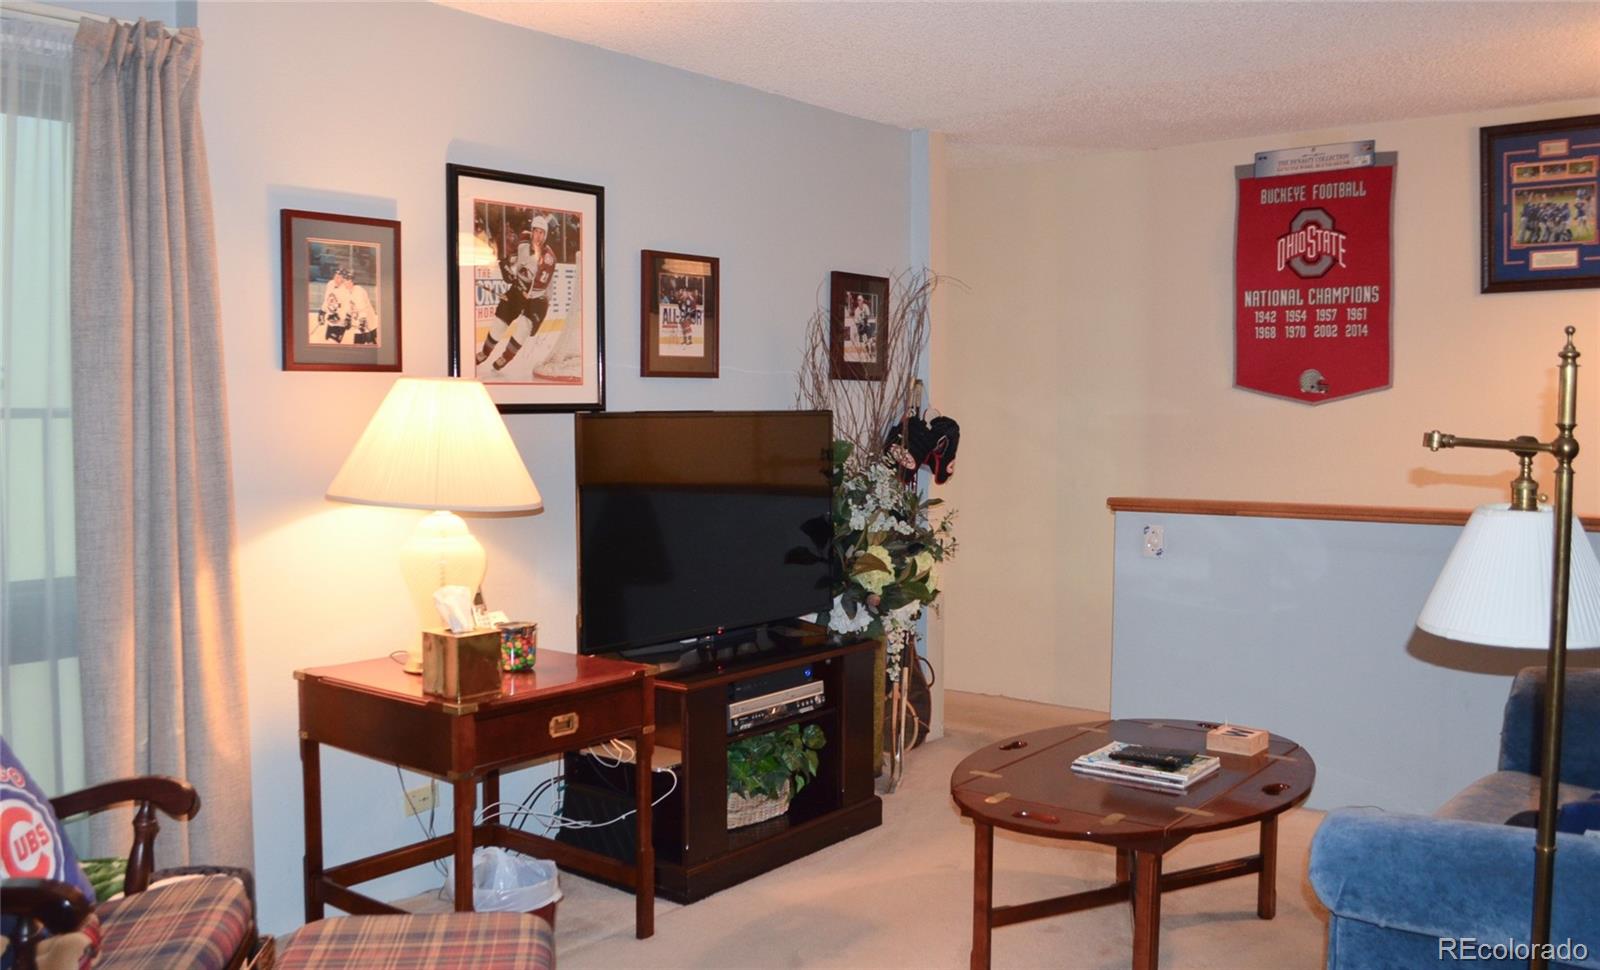
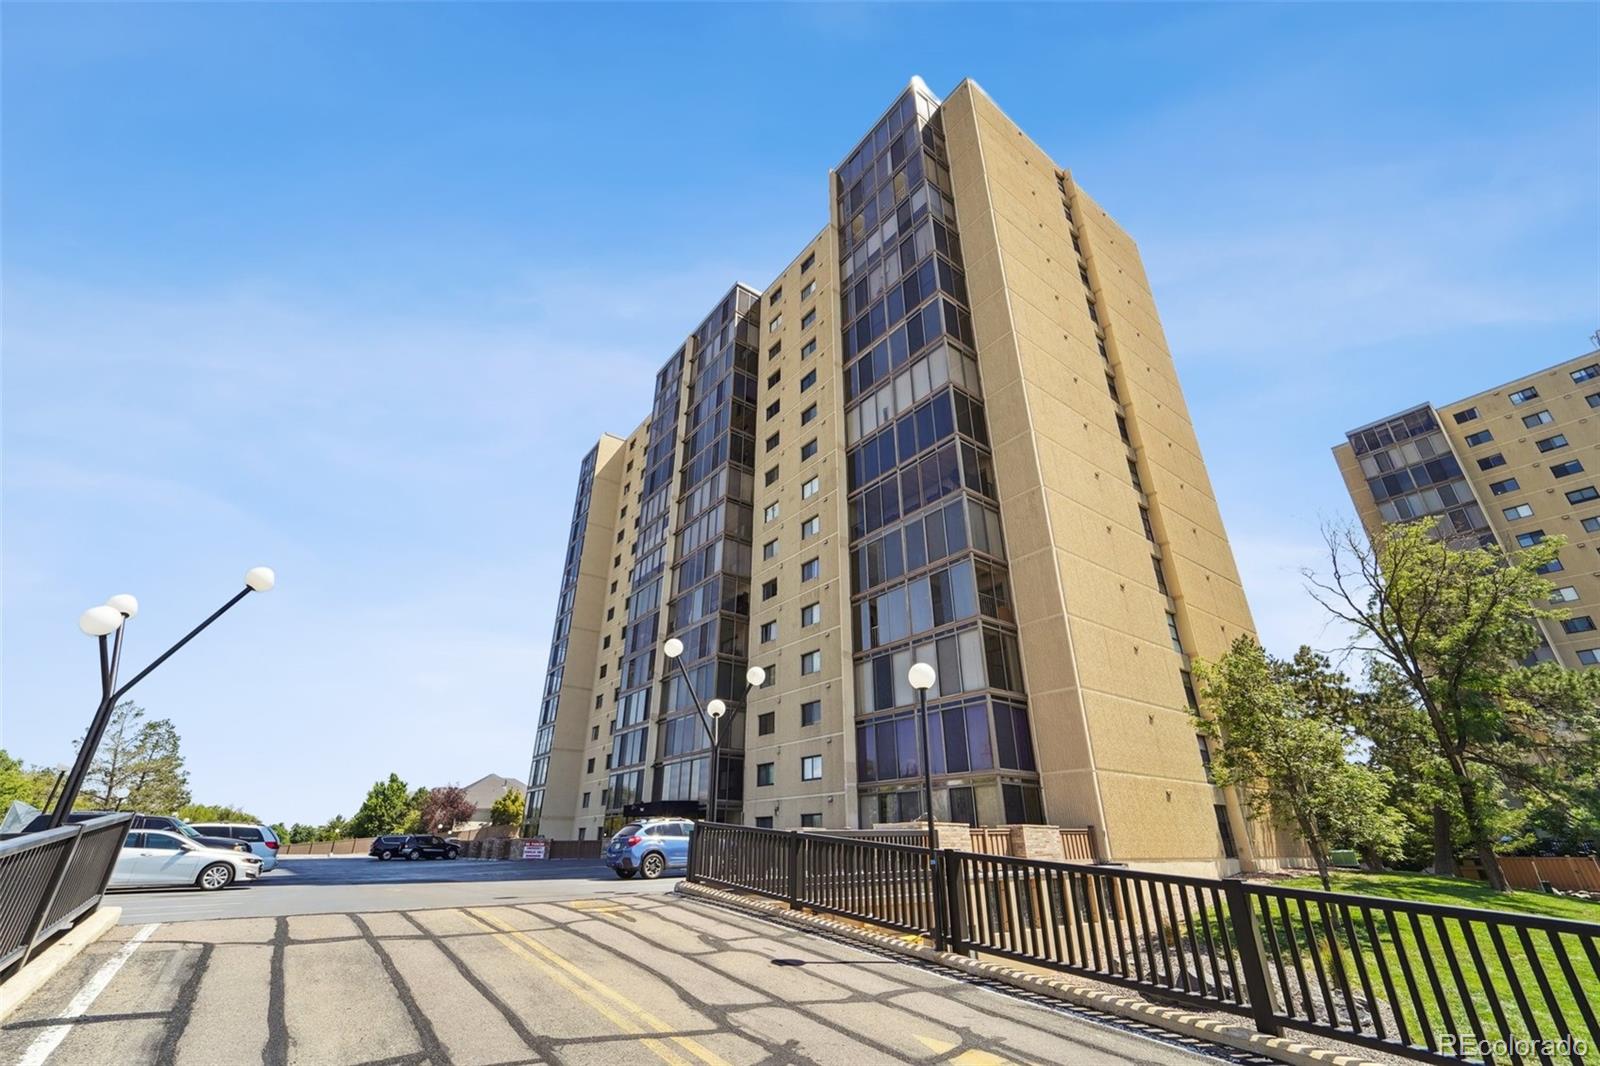
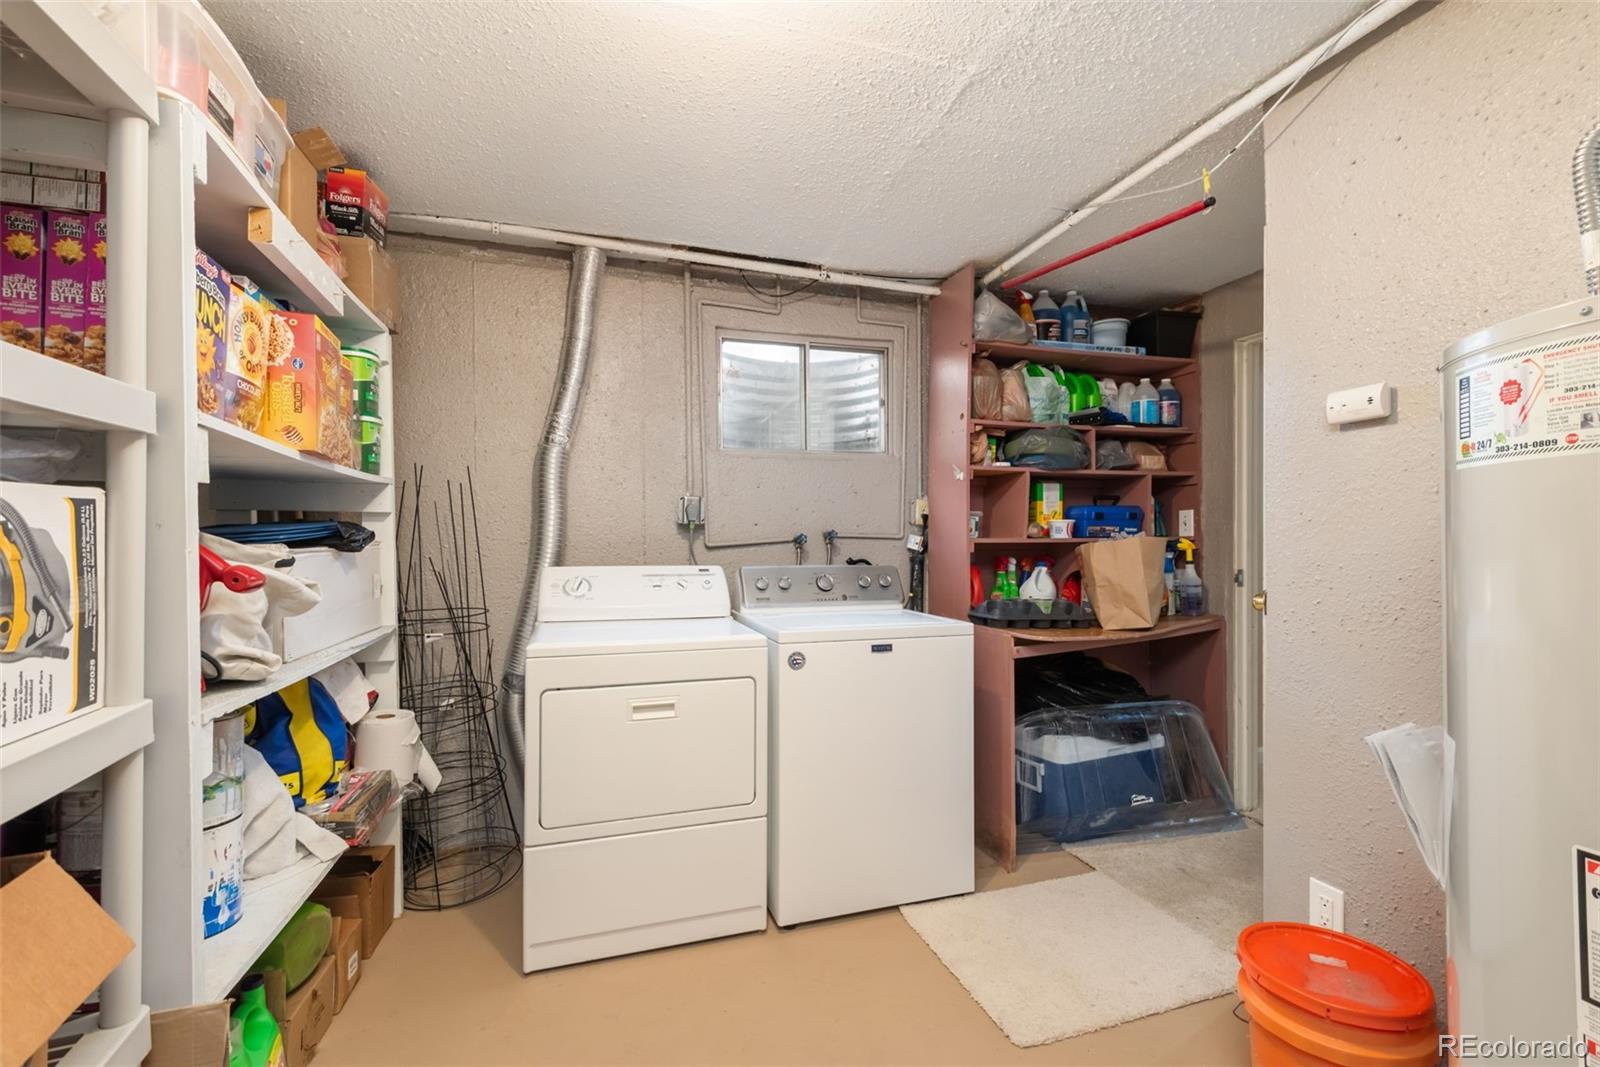
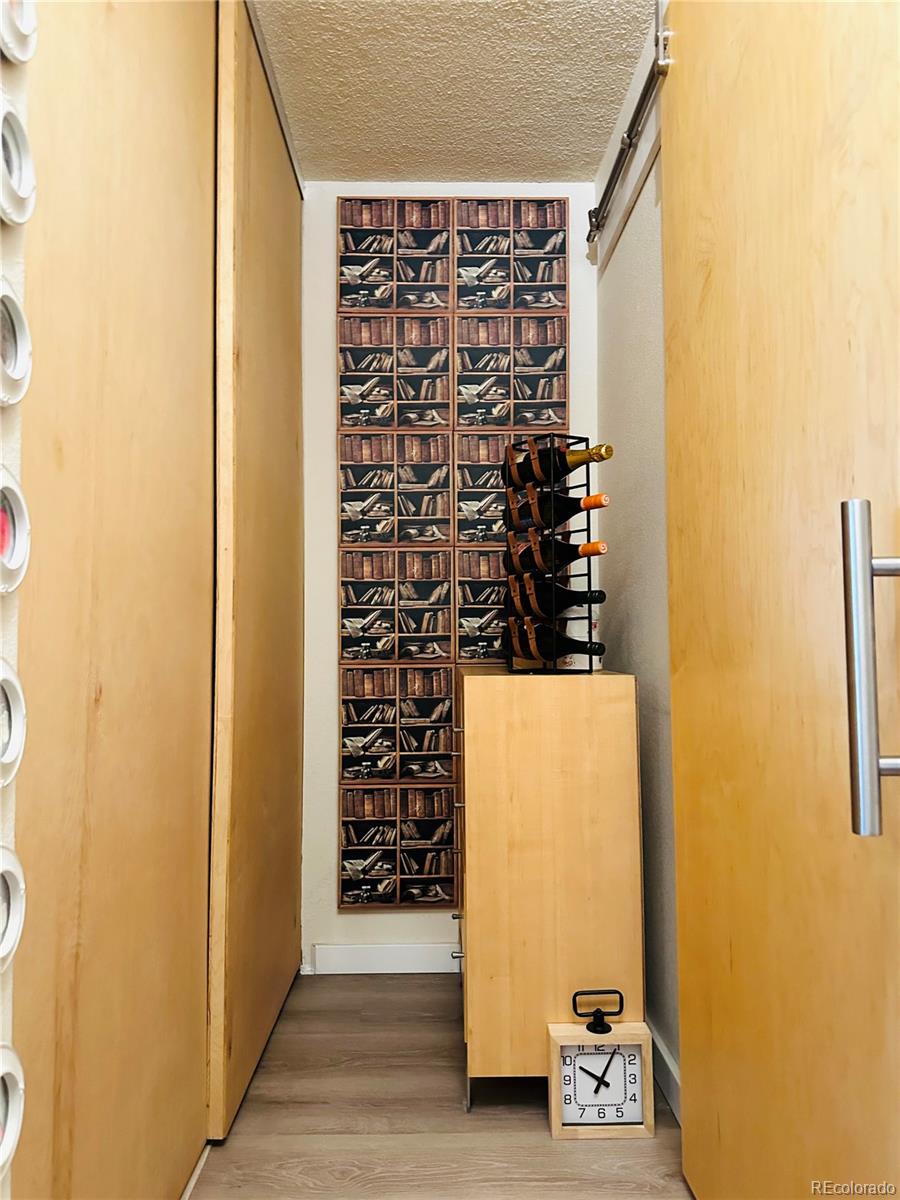
$180,000
1
bds
|
1
ba
|
672
sqft
|
built
1973
6800 E Tennessee Ave, Denver, CO 80224
$-111
Cash flow
-3.2%
Cash-on-Cash Return
4.9%
Cap rate
0.9%
Rent to Value Ratio
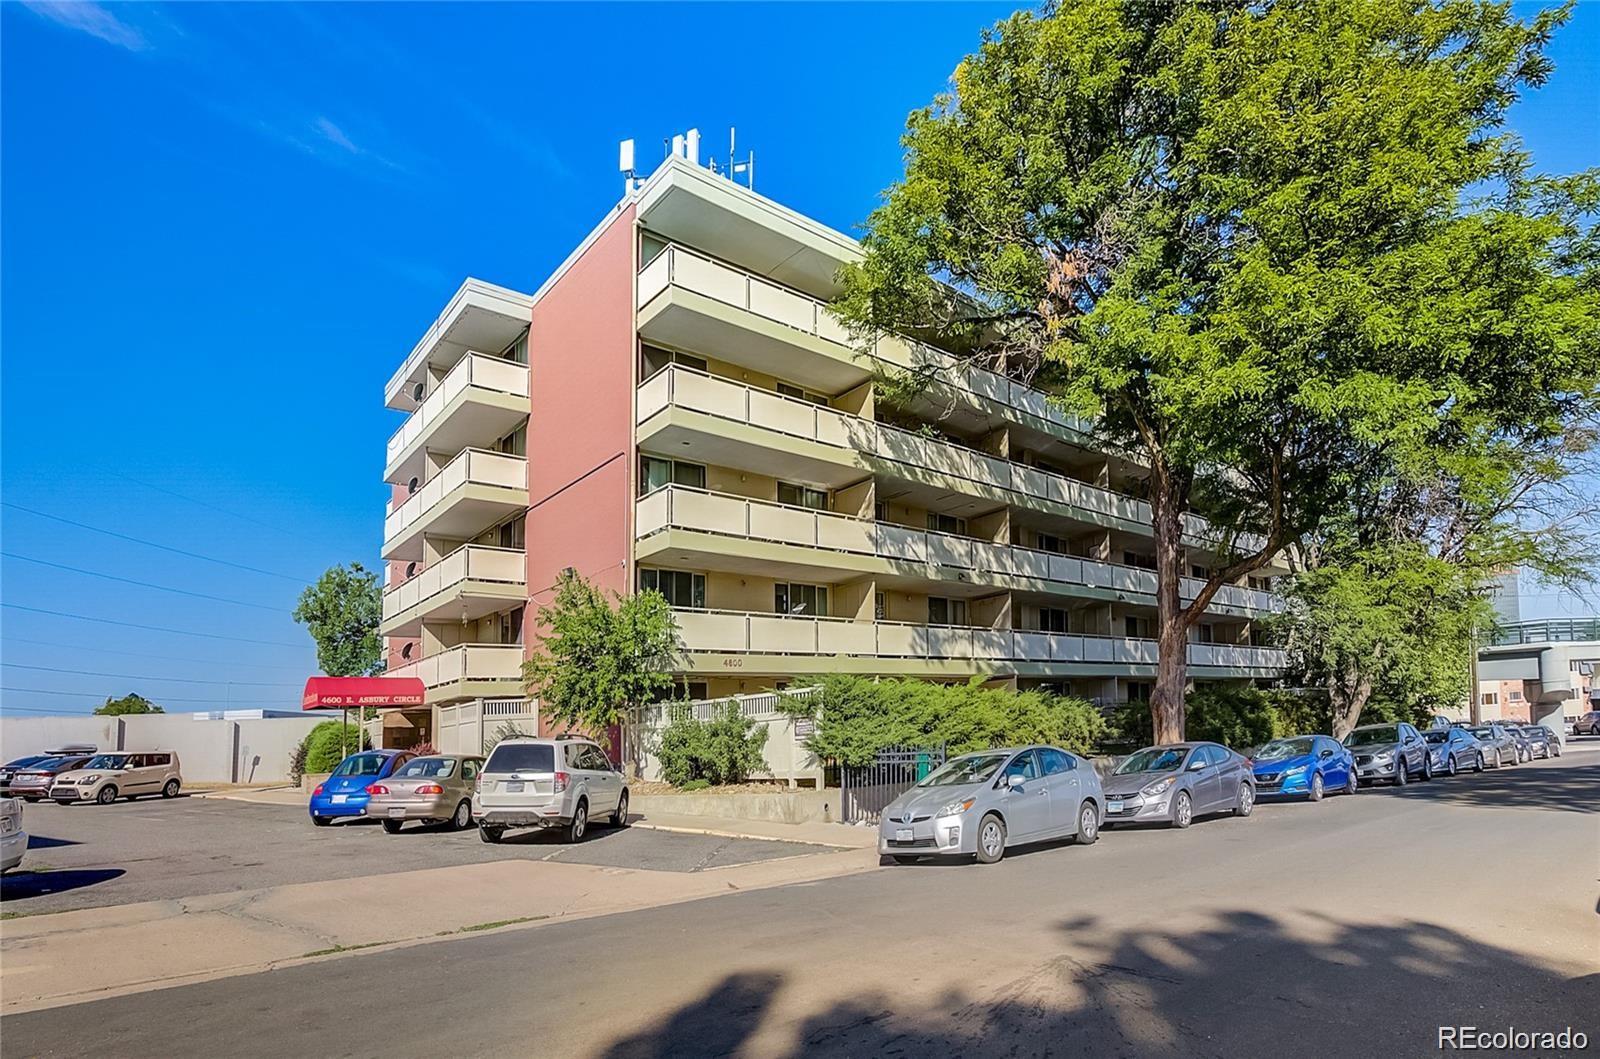
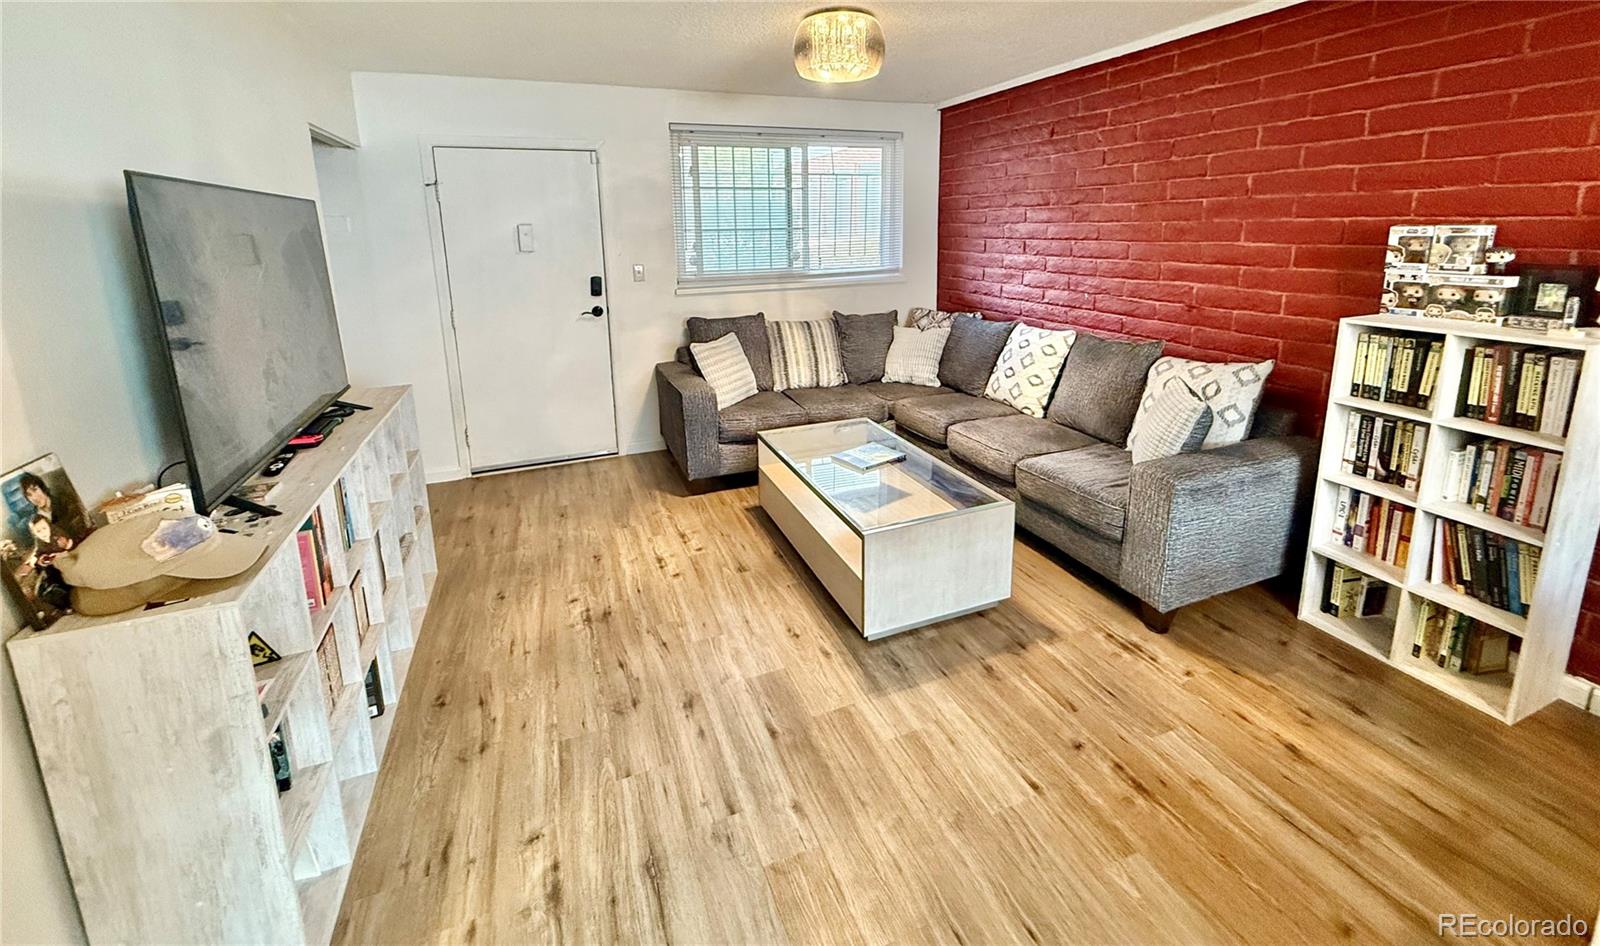
Active
$219,995
1
bds
|
1
ba
|
775
sqft
|
built
1962
4600 E Asbury Cir, Denver, CO 80222
$-391
Cash flow
-9.3%
Cash-on-Cash Return
3.5%
Cap rate
0.7%
Rent to Value Ratio
3,344 out of 3,464 properties for sale in Denver, CO
Limited Results Shown
Create a free account, or log in to reveal all property listings and enjoy the complete experience.
Active
$444,000
3
bds
|
1
ba
|
836
sqft
|
built
1954
4507 W 2nd Ave, Denver, CO 80219
$-593
Cash flow
-7.0%
Cash-on-Cash Return
4.1%
Cap rate
0.5%
Rent to Value Ratio

Active
$1,039,000
3
bds
|
4
ba
|
2,317
sqft
|
built
2016
4390 Osage St, Denver, CO 80211
$-1,600
Cash flow
-8.0%
Cash-on-Cash Return
3.8%
Cap rate
0.5%
Rent to Value Ratio
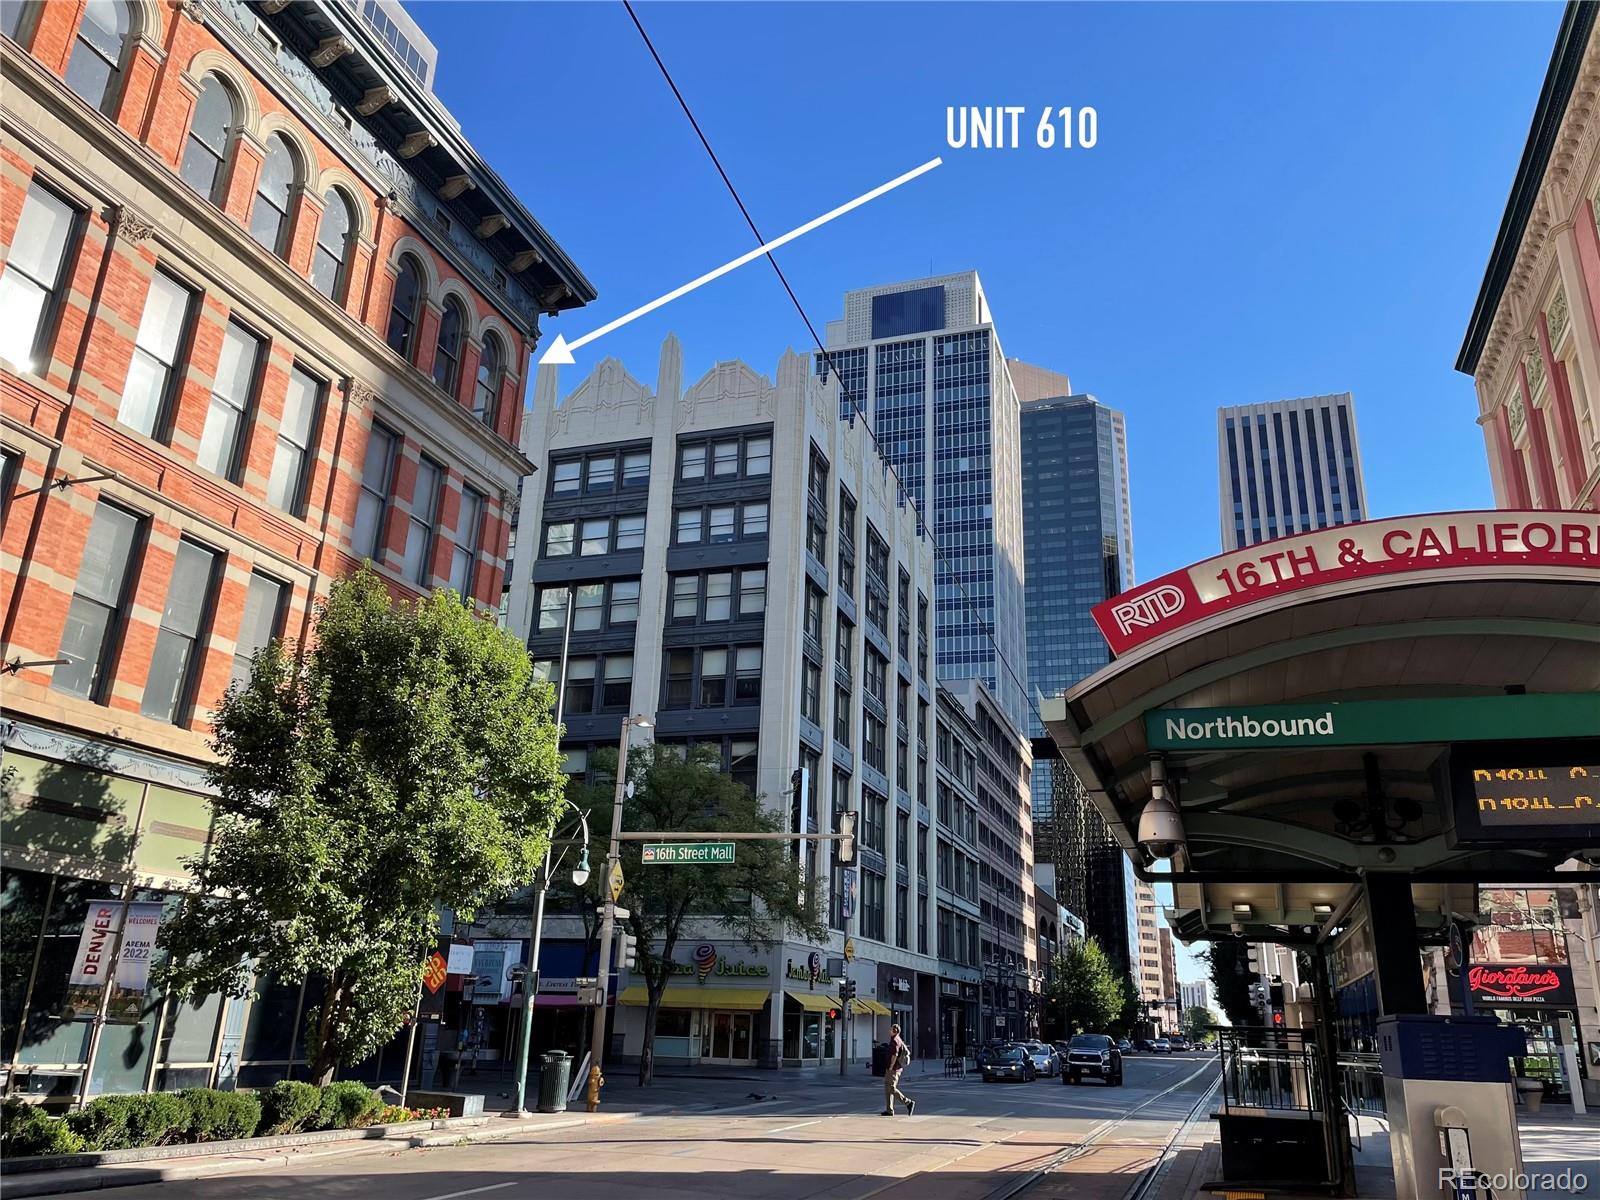
Active
$375,000
2
bds
|
1
ba
|
1,119
sqft
|
built
1903
1555 California St, Denver, CO 80202
$-1,186
Cash flow
-16.5%
Cash-on-Cash Return
1.9%
Cap rate
0.7%
Rent to Value Ratio
Active
$255,999
2
bds
|
1
ba
|
808
sqft
|
built
2001
15475 Andrews Dr, Denver, CO 80239
$-485
Cash flow
-9.9%
Cash-on-Cash Return
3.4%
Cap rate
0.7%
Rent to Value Ratio
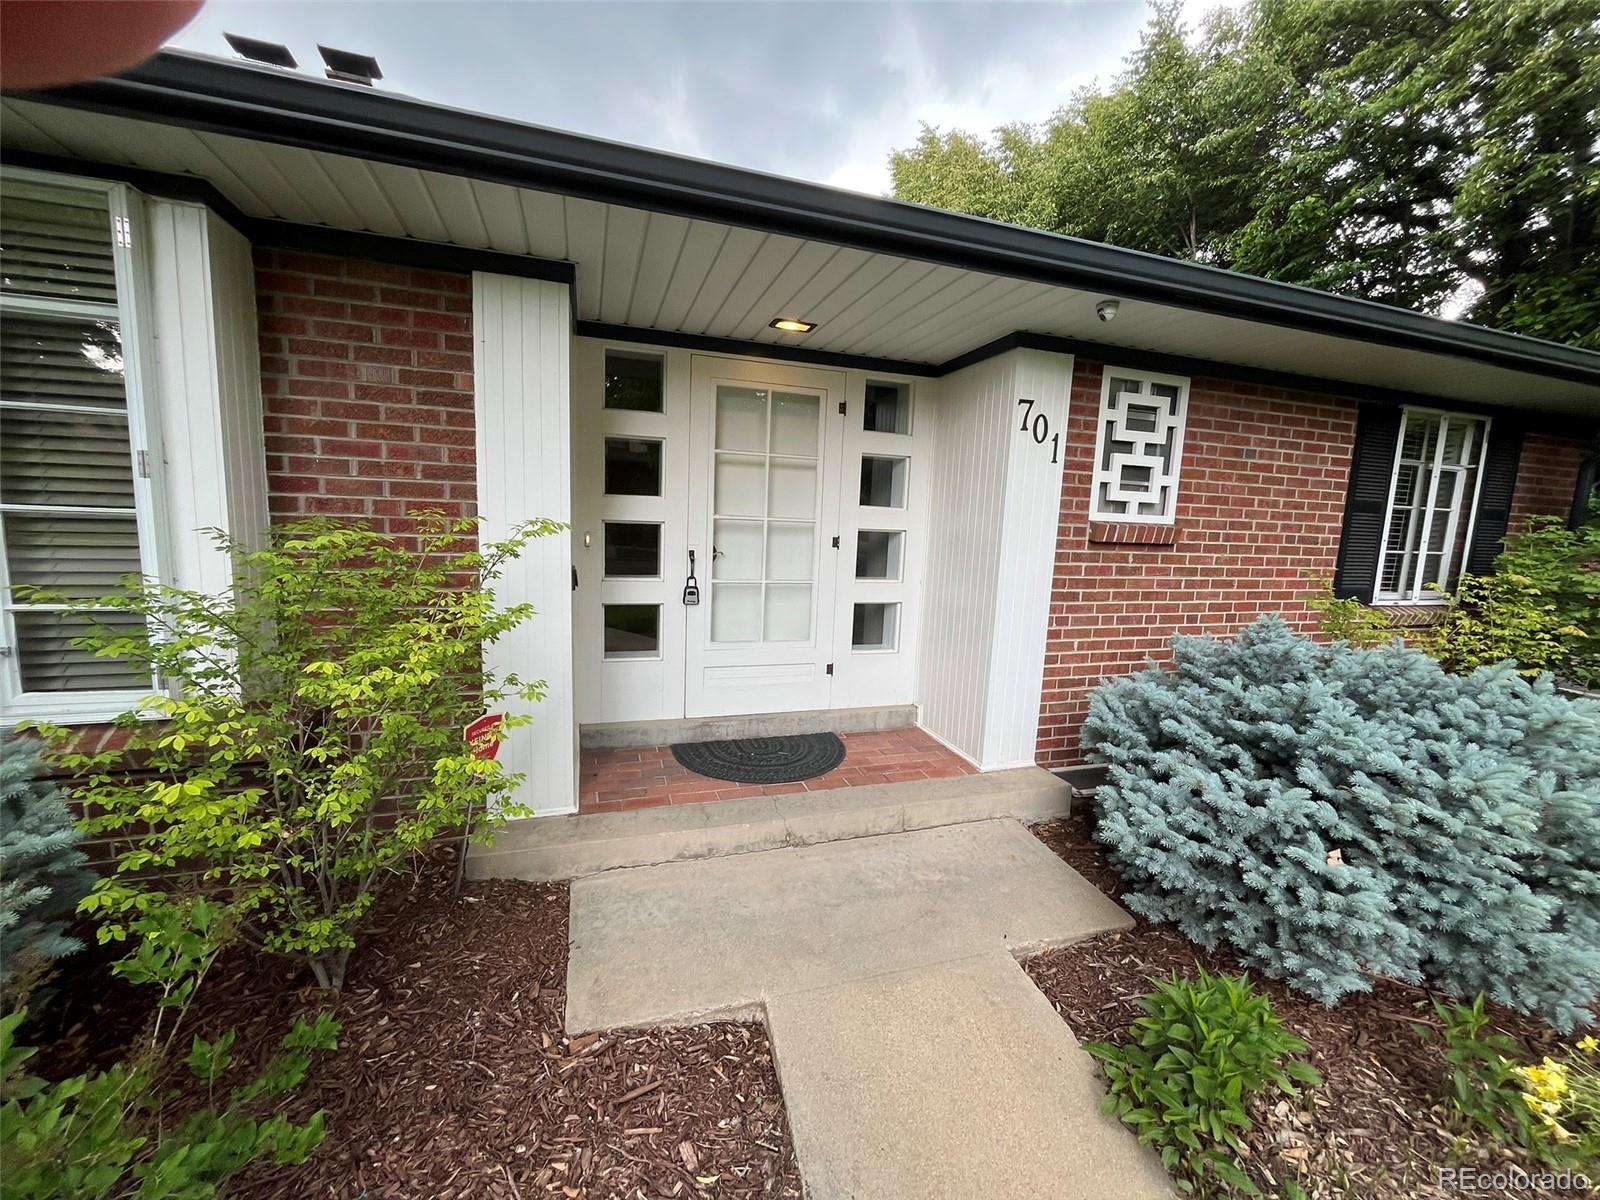
Active
$1,365,000
3
bds
|
3
ba
|
2,547
sqft
|
built
1952
701 S Clayton St, Denver, CO 80209
$-3,063
Cash flow
-11.7%
Cash-on-Cash Return
3.0%
Cap rate
0.4%
Rent to Value Ratio
Active under contract
$1,100,000
4
bds
|
2
ba
|
2,338
sqft
|
built
1941
2535 Leyden St, Denver, CO 80207
$-3,169
Cash flow
-15.0%
Cash-on-Cash Return
2.2%
Cap rate
0.3%
Rent to Value Ratio
Active
$268,000
1
bds
|
1
ba
|
544
sqft
|
built
1953
1130 N Pennsylvania St, Denver, CO 80203
$-610
Cash flow
-11.9%
Cash-on-Cash Return
2.9%
Cap rate
0.6%
Rent to Value Ratio
Active
$720,000
1
bds
|
2
ba
|
1,002
sqft
|
built
2021
4200 W 17th Ave, Denver, CO 80204
$-2,239
Cash flow
-16.2%
Cash-on-Cash Return
1.9%
Cap rate
0.5%
Rent to Value Ratio

Active
$475,000
2
bds
|
1
ba
|
804
sqft
|
built
1910
1000 N Ogden St, Denver, CO 80218
$-1,150
Cash flow
-12.6%
Cash-on-Cash Return
2.8%
Cap rate
0.5%
Rent to Value Ratio
Active
$286,000
2
bds
|
2
ba
|
948
sqft
|
built
1980
8335 Fairmount Dr, Denver, CO 80247
$-557
Cash flow
-10.2%
Cash-on-Cash Return
3.3%
Cap rate
0.7%
Rent to Value Ratio
Active
$525,000
2
bds
|
2
ba
|
1,016
sqft
|
built
1906
3953 Tejon St, Denver, CO 80211
$-779
Cash flow
-7.7%
Cash-on-Cash Return
3.9%
Cap rate
0.5%
Rent to Value Ratio
Active
$635,000
3
bds
|
4
ba
|
1,536
sqft
|
built
2019
1336 Sheridan Blvd, Denver, CO 80214
$-1,113
Cash flow
-9.1%
Cash-on-Cash Return
3.6%
Cap rate
0.5%
Rent to Value Ratio
Active
$355,000
2
bds
|
2
ba
|
1,509
sqft
|
built
1970
2815 S Locust St, Denver, CO 80222
$-544
Cash flow
-8.0%
Cash-on-Cash Return
3.8%
Cap rate
0.7%
Rent to Value Ratio
Active
$340,000
2
bds
|
2
ba
|
1,628
sqft
|
built
1974
7865 E Mississippi Ave, Denver, CO 80247
$-745
Cash flow
-11.4%
Cash-on-Cash Return
3.0%
Cap rate
0.7%
Rent to Value Ratio
Active
$320,000
3
bds
|
3
ba
|
2,014
sqft
|
built
1973
7755 E Quincy Ave, Denver, CO 80237
$-475
Cash flow
-7.7%
Cash-on-Cash Return
3.9%
Cap rate
0.8%
Rent to Value Ratio
Active
$219,000
bds
|
1
ba
|
354
sqft
|
built
1965
909 N Logan St, Denver, CO 80203
$-441
Cash flow
-10.5%
Cash-on-Cash Return
3.3%
Cap rate
0.6%
Rent to Value Ratio
Active
$449,900
1
bds
|
1
ba
|
964
sqft
|
built
2006
2460 W 29th Ave, Denver, CO 80211
$-1,083
Cash flow
-12.6%
Cash-on-Cash Return
2.8%
Cap rate
0.6%
Rent to Value Ratio
Active
$669,500
2
bds
|
3
ba
|
1,478
sqft
|
built
2016
2426 Welton St, Denver, CO 80205
$-1,441
Cash flow
-11.2%
Cash-on-Cash Return
3.1%
Cap rate
0.5%
Rent to Value Ratio
Active
$659,000
2
bds
|
1
ba
|
905
sqft
|
built
1911
2421 Hooker St, Denver, CO 80211
$-1,406
Cash flow
-11.1%
Cash-on-Cash Return
3.1%
Cap rate
0.4%
Rent to Value Ratio
Active
$1,000,000
4
bds
|
4
ba
|
3,081
sqft
|
built
1933
1418 Glencoe St, Denver, CO 80220
$-1,456
Cash flow
-7.6%
Cash-on-Cash Return
3.9%
Cap rate
0.5%
Rent to Value Ratio
Active
$249,888
2
bds
|
1
ba
|
801
sqft
|
built
1975
1410 York St, Denver, CO 80206
$-581
Cash flow
-12.1%
Cash-on-Cash Return
2.9%
Cap rate
0.7%
Rent to Value Ratio
Active
$1,099,900
5
bds
|
2
ba
|
2,896
sqft
|
built
1949
4000 Irving St, Denver, CO 80211
$-3,217
Cash flow
-15.3%
Cash-on-Cash Return
2.2%
Cap rate
0.3%
Rent to Value Ratio
Active
$275,000
1
bds
|
1
ba
|
720
sqft
|
built
1966
1350 Josephine St, Denver, CO 80206
$-638
Cash flow
-12.1%
Cash-on-Cash Return
2.9%
Cap rate
0.7%
Rent to Value Ratio
Active
$219,995
1
bds
|
1
ba
|
775
sqft
|
built
1962
4600 E Asbury Cir, Denver, CO 80222
$-391
Cash flow
-9.3%
Cash-on-Cash Return
3.5%
Cap rate
0.7%
Rent to Value Ratio
Active
$2,199,000
6
bds
|
5
ba
|
4,903
sqft
|
built
2001
2411 S Garfield St, Denver, CO 80210
$-6,733
Cash flow
-16.0%
Cash-on-Cash Return
2.0%
Cap rate
0.3%
Rent to Value Ratio
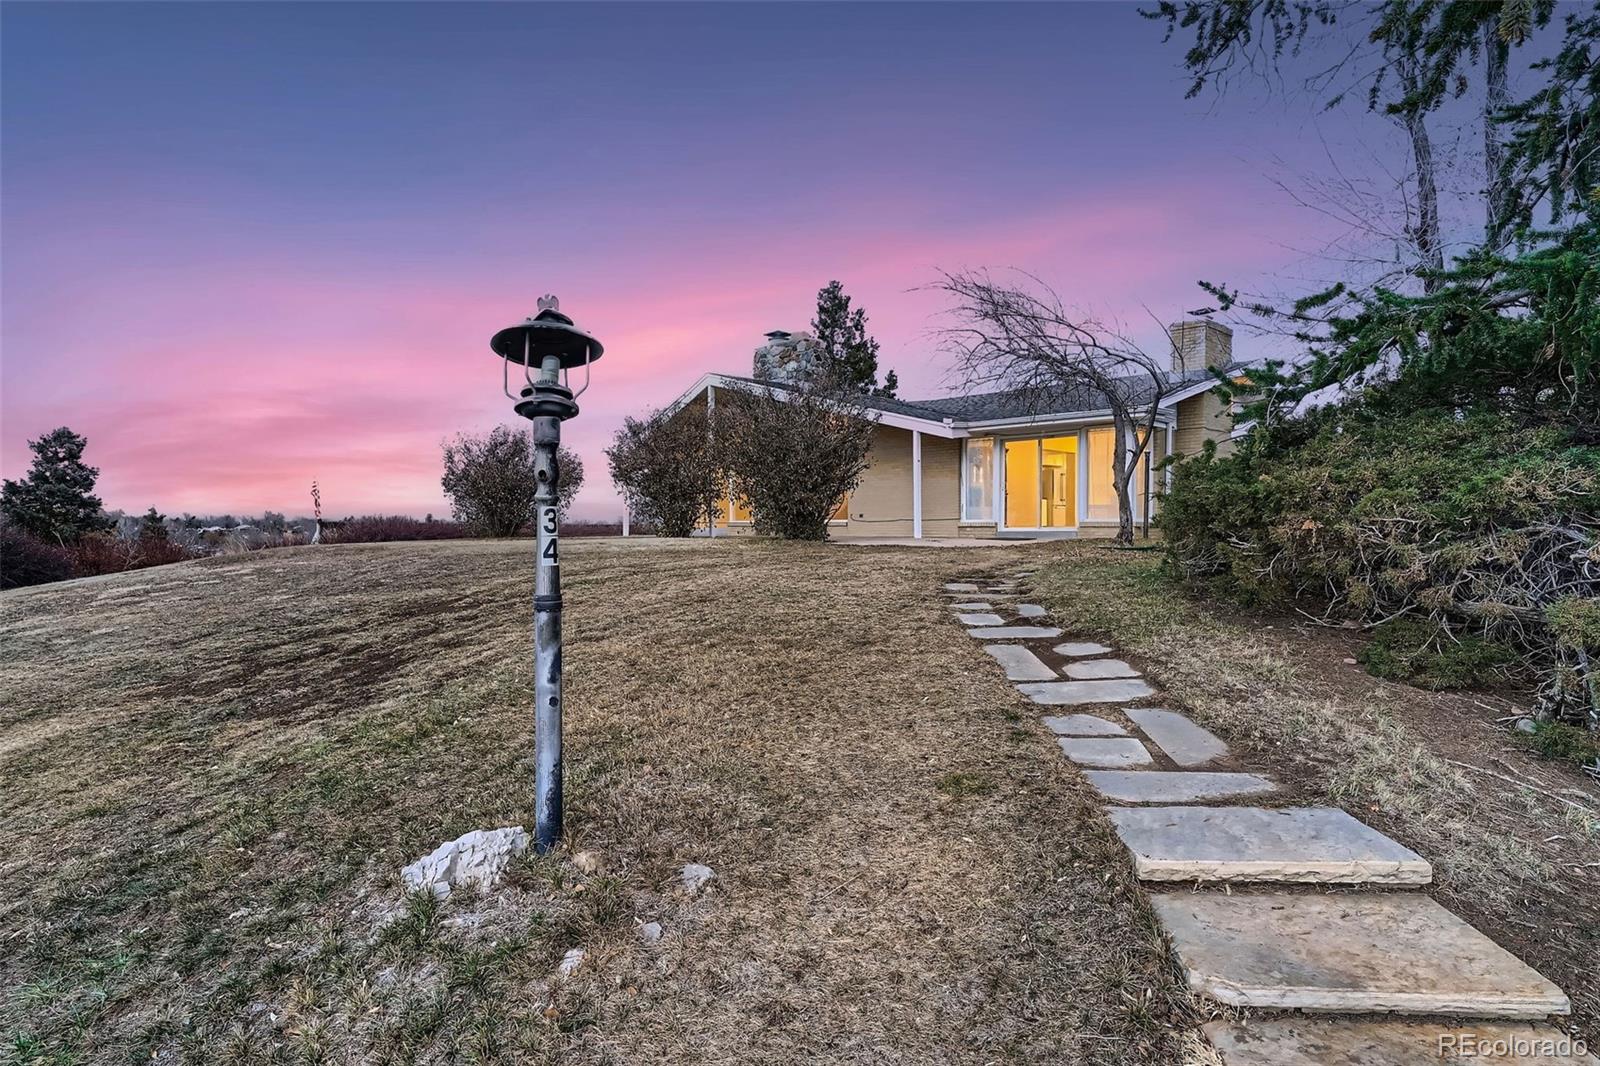
Active
$899,900
3
bds
|
2
ba
|
1,935
sqft
|
built
1960
34 S Raleigh St, Denver, CO 80219
$-1,701
Cash flow
-9.9%
Cash-on-Cash Return
3.4%
Cap rate
0.4%
Rent to Value Ratio
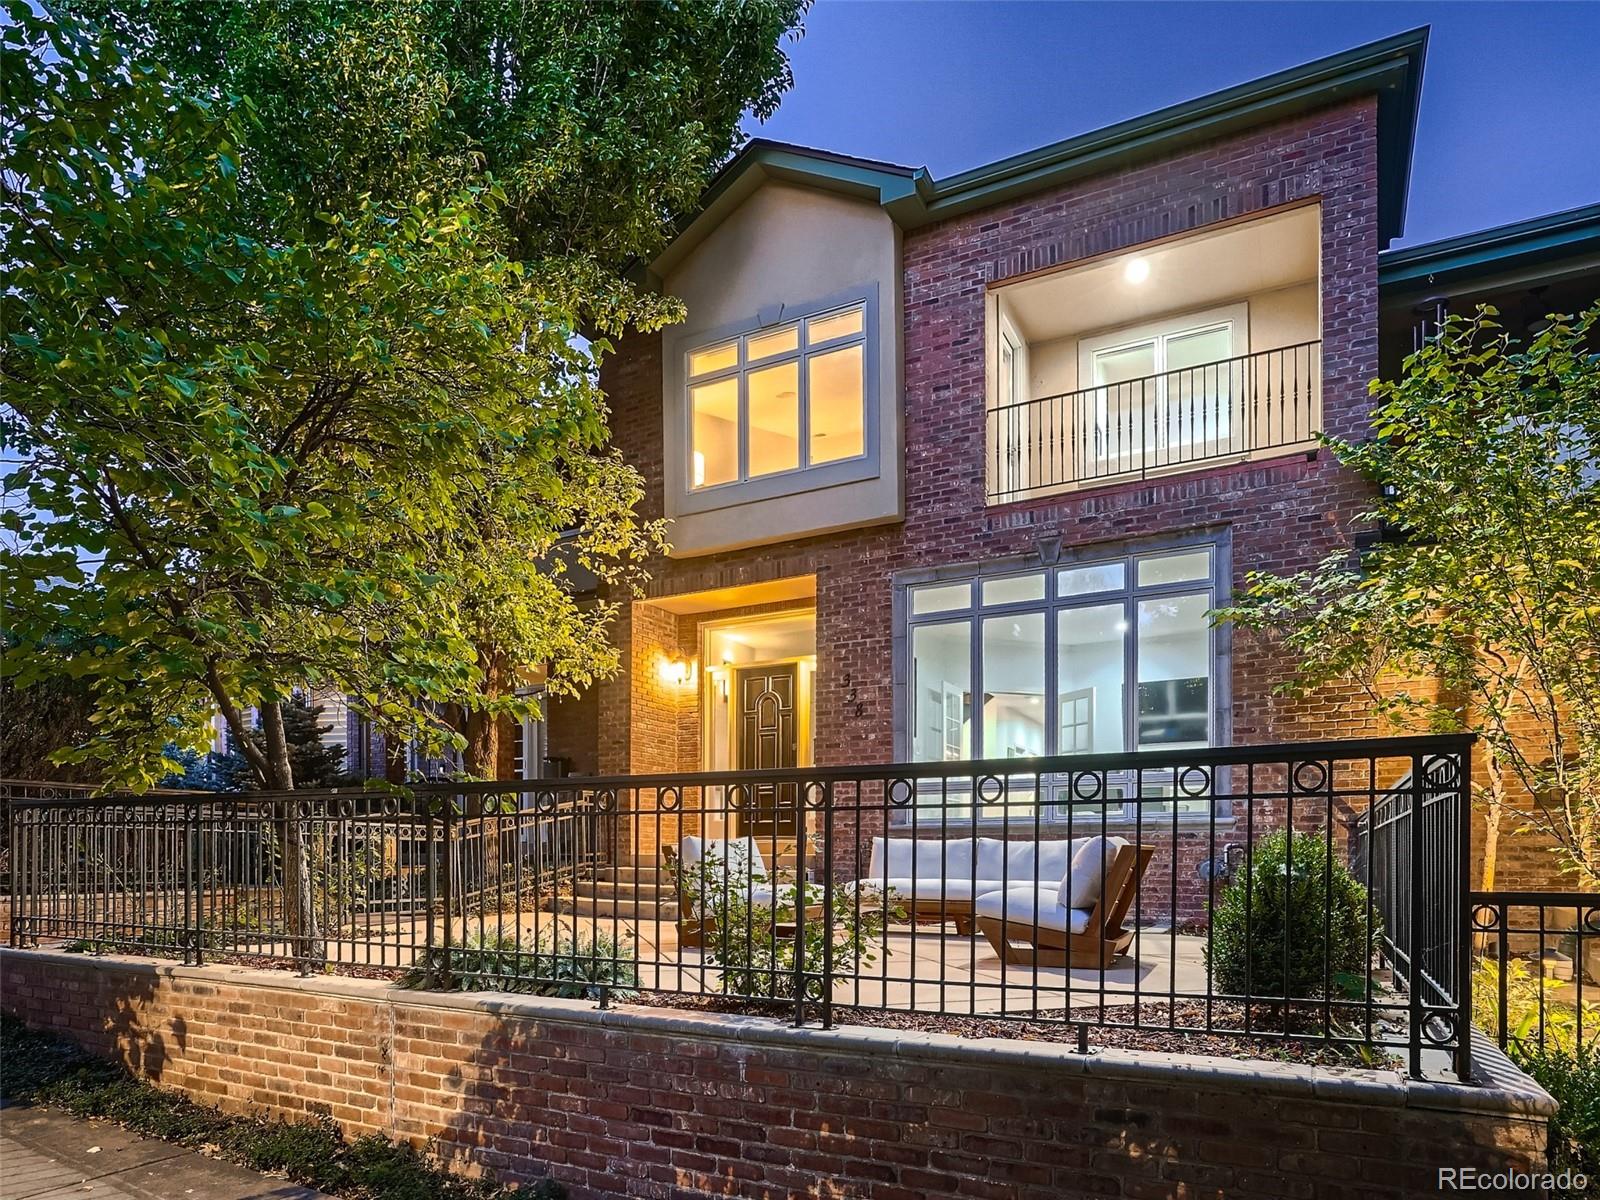
Active
$3,379,000
4
bds
|
5
ba
|
4,211
sqft
|
built
2000
338 Saint Paul St, Denver, CO 80206
$-12,808
Cash flow
-19.8%
Cash-on-Cash Return
1.1%
Cap rate
0.2%
Rent to Value Ratio
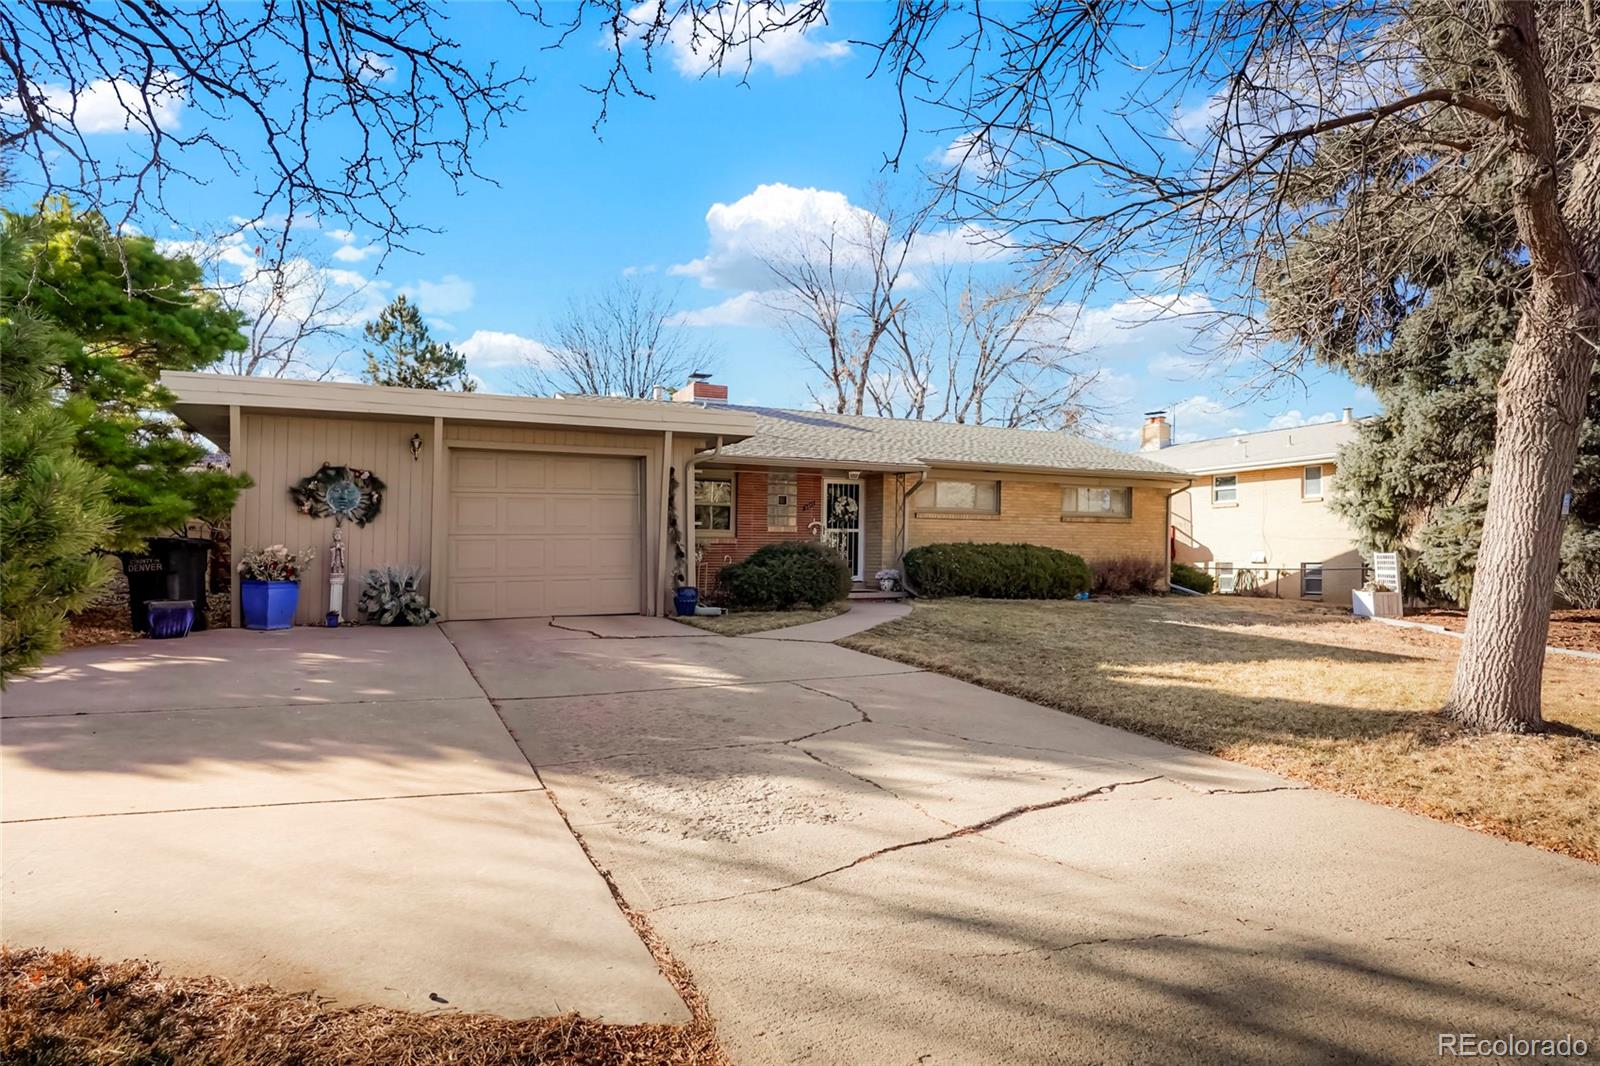
Active
$649,900
3
bds
|
2
ba
|
1,411
sqft
|
built
1955
3311 S Dahlia St, Denver, CO 80222
$-1,202
Cash flow
-9.6%
Cash-on-Cash Return
3.5%
Cap rate
0.5%
Rent to Value Ratio
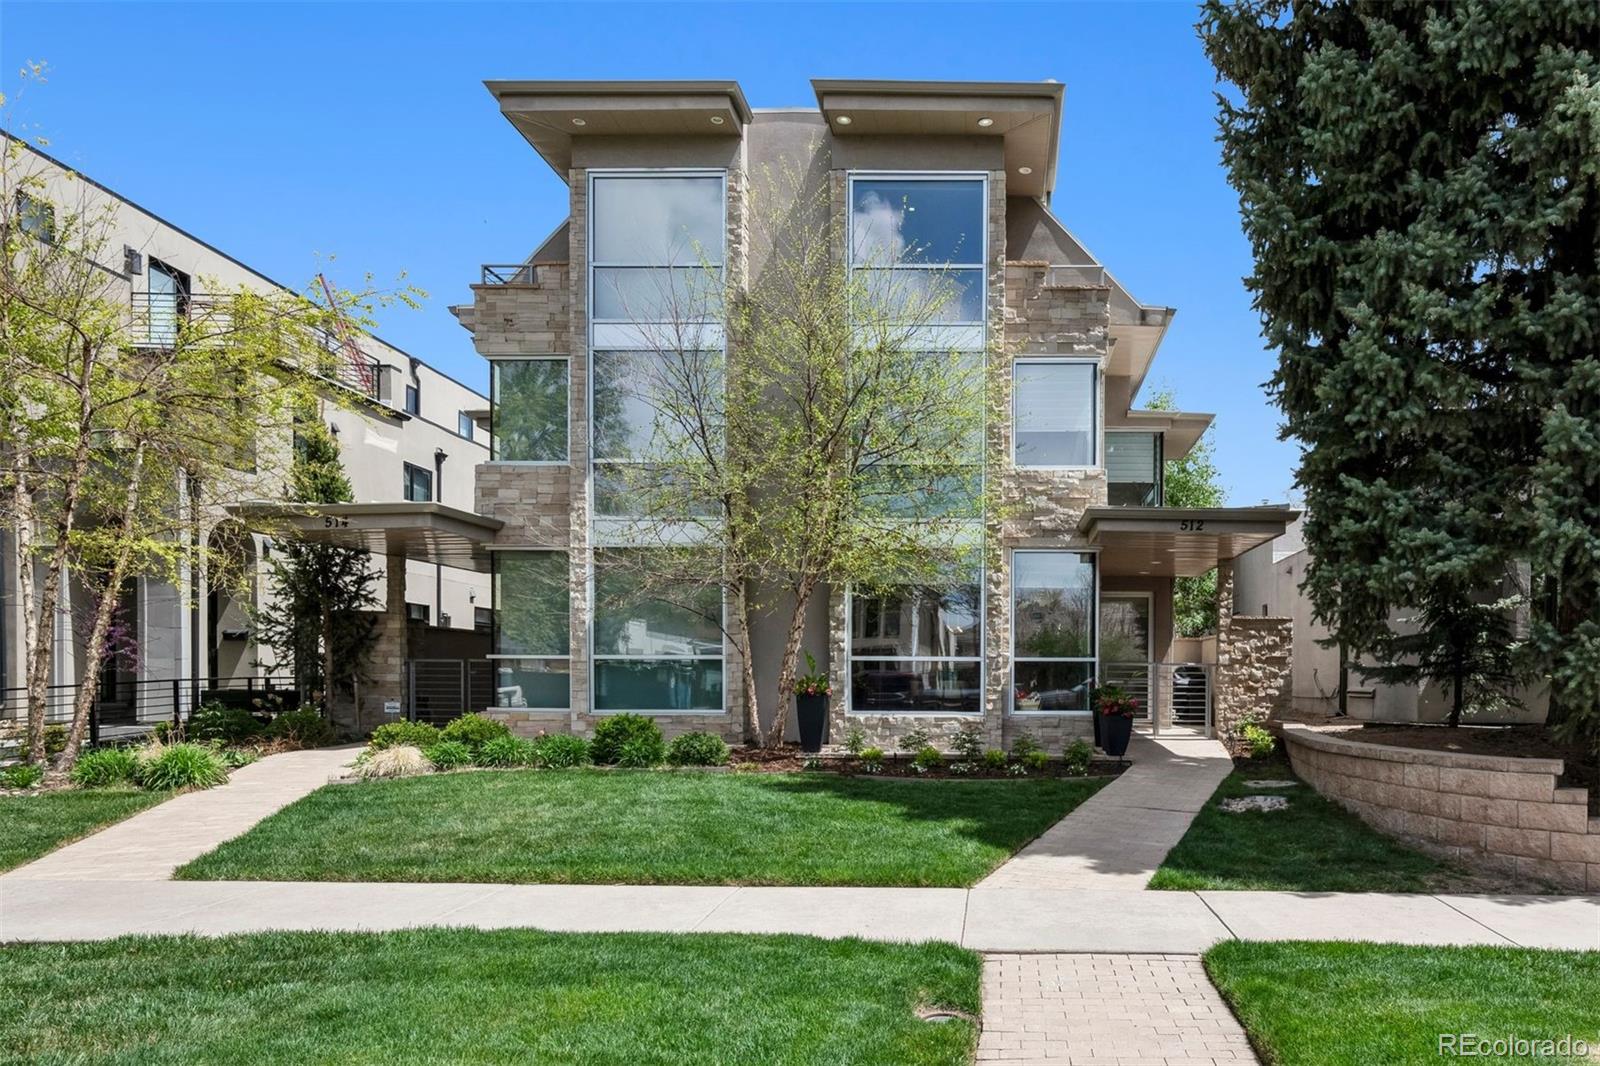
Active
$2,400,000
4
bds
|
6
ba
|
4,045
sqft
|
built
2007
512 Cook St, Denver, CO 80206
$-8,429
Cash flow
-18.3%
Cash-on-Cash Return
1.5%
Cap rate
0.2%
Rent to Value Ratio
Active
$635,000
4
bds
|
3
ba
|
1,924
sqft
|
built
2021
1525 W 68th Ave, Denver, CO 80221
$-1,160
Cash flow
-9.5%
Cash-on-Cash Return
3.5%
Cap rate
0.6%
Rent to Value Ratio
Active
$385,000
3
bds
|
3
ba
|
1,352
sqft
|
built
1969
6340 E Mississippi Ave, Denver, CO 80224
$-721
Cash flow
-9.8%
Cash-on-Cash Return
3.4%
Cap rate
0.6%
Rent to Value Ratio
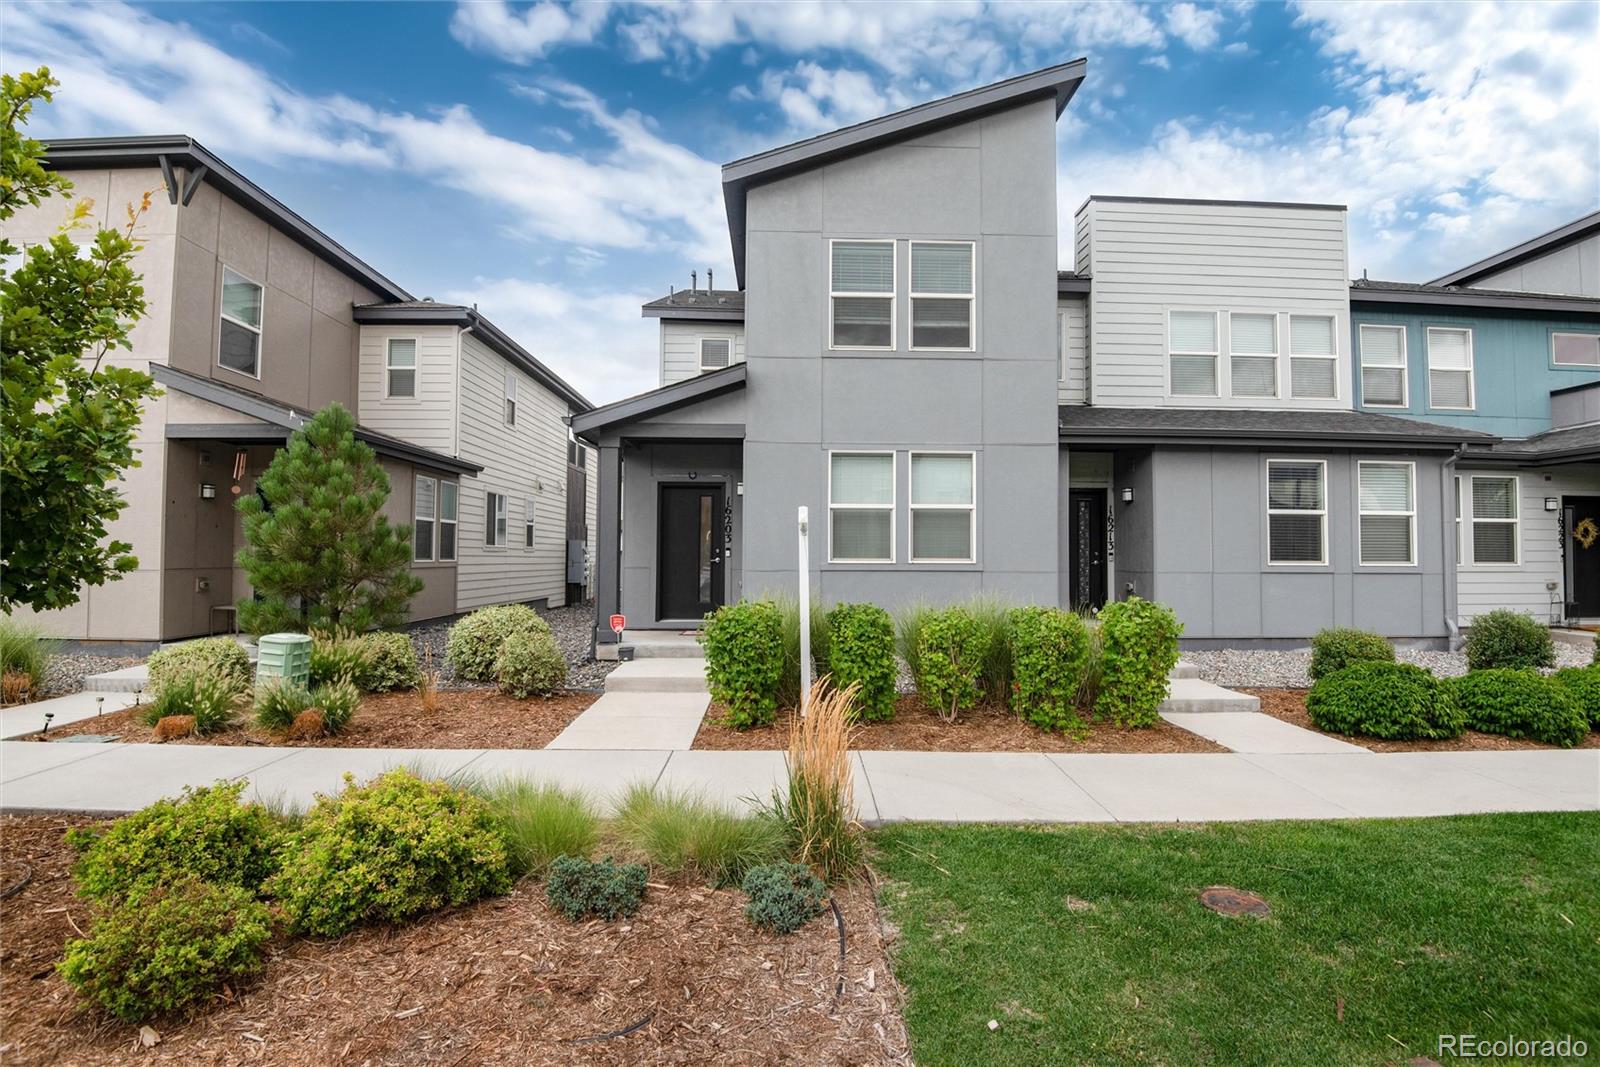
Active
$435,000
3
bds
|
3
ba
|
1,643
sqft
|
built
2019
16203 E 47th Pl, Denver, CO 80239
$-935
Cash flow
-11.2%
Cash-on-Cash Return
3.1%
Cap rate
0.6%
Rent to Value Ratio
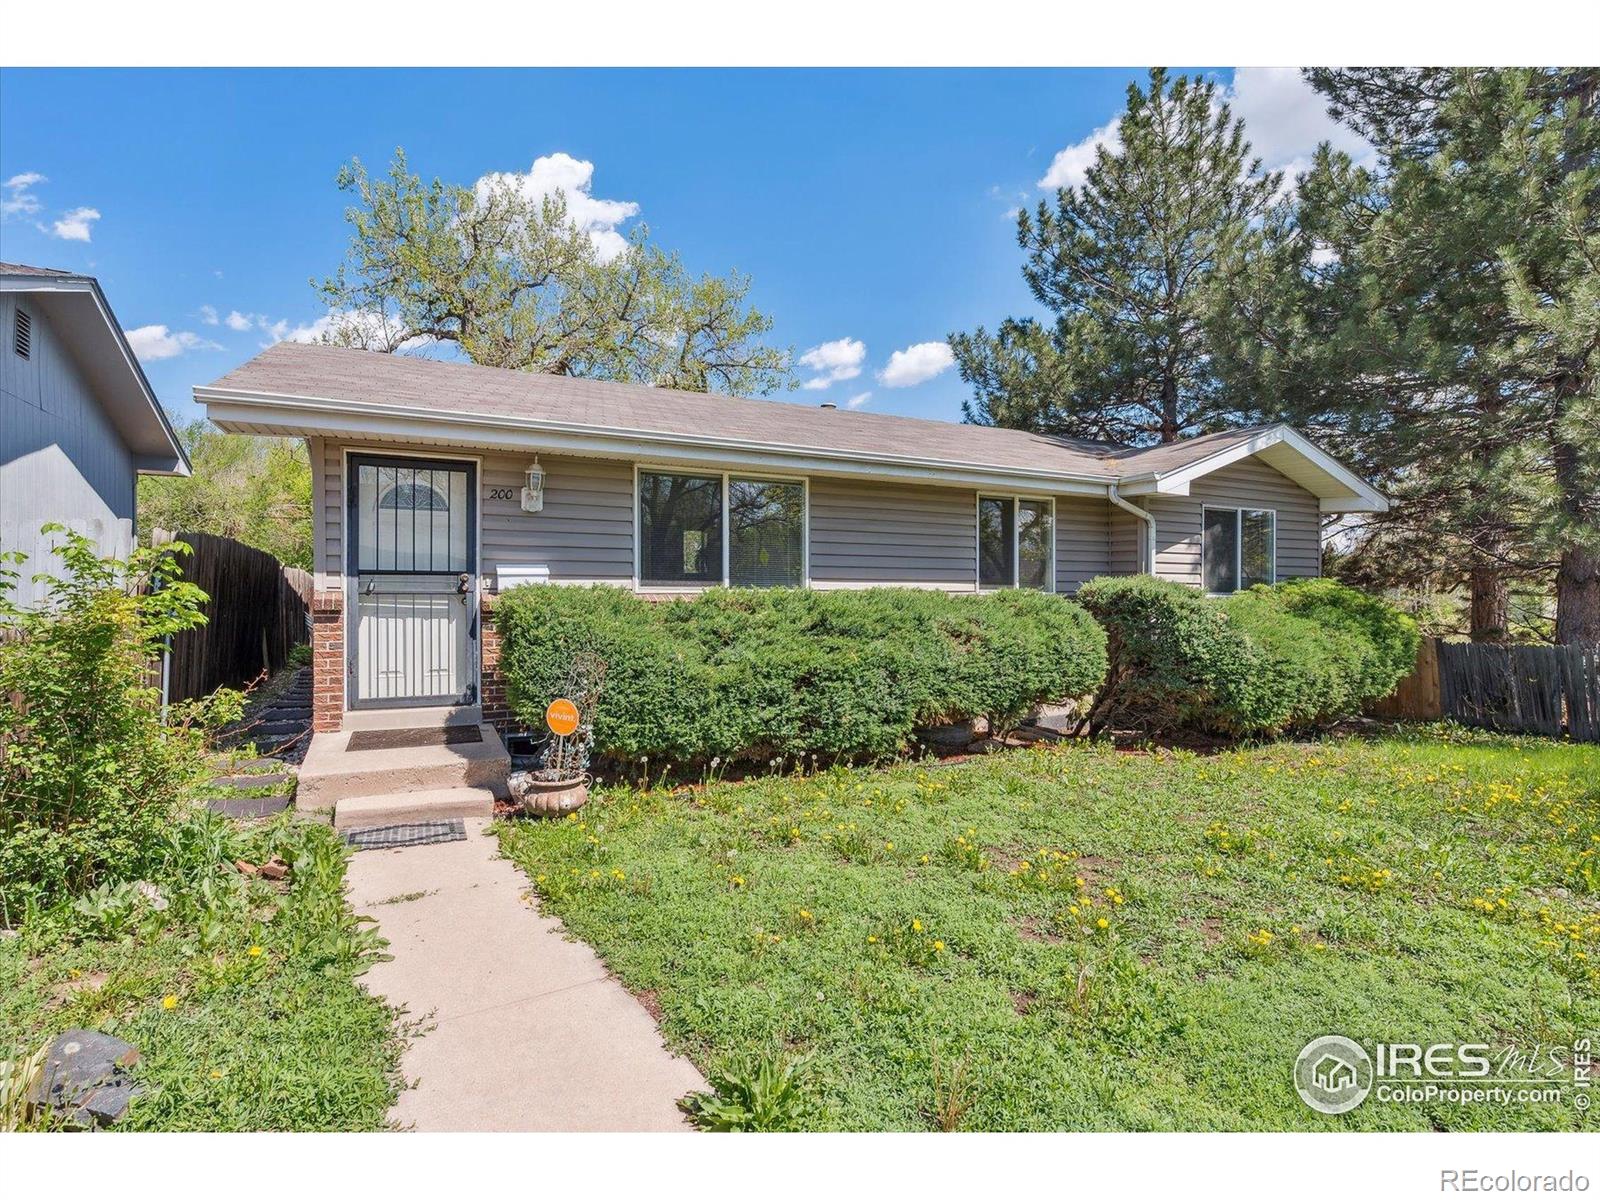
Active
$485,000
4
bds
|
2
ba
|
1,892
sqft
|
built
1970
200 Perry St, Denver, CO 80219
$-743
Cash flow
-8.0%
Cash-on-Cash Return
3.8%
Cap rate
0.5%
Rent to Value Ratio
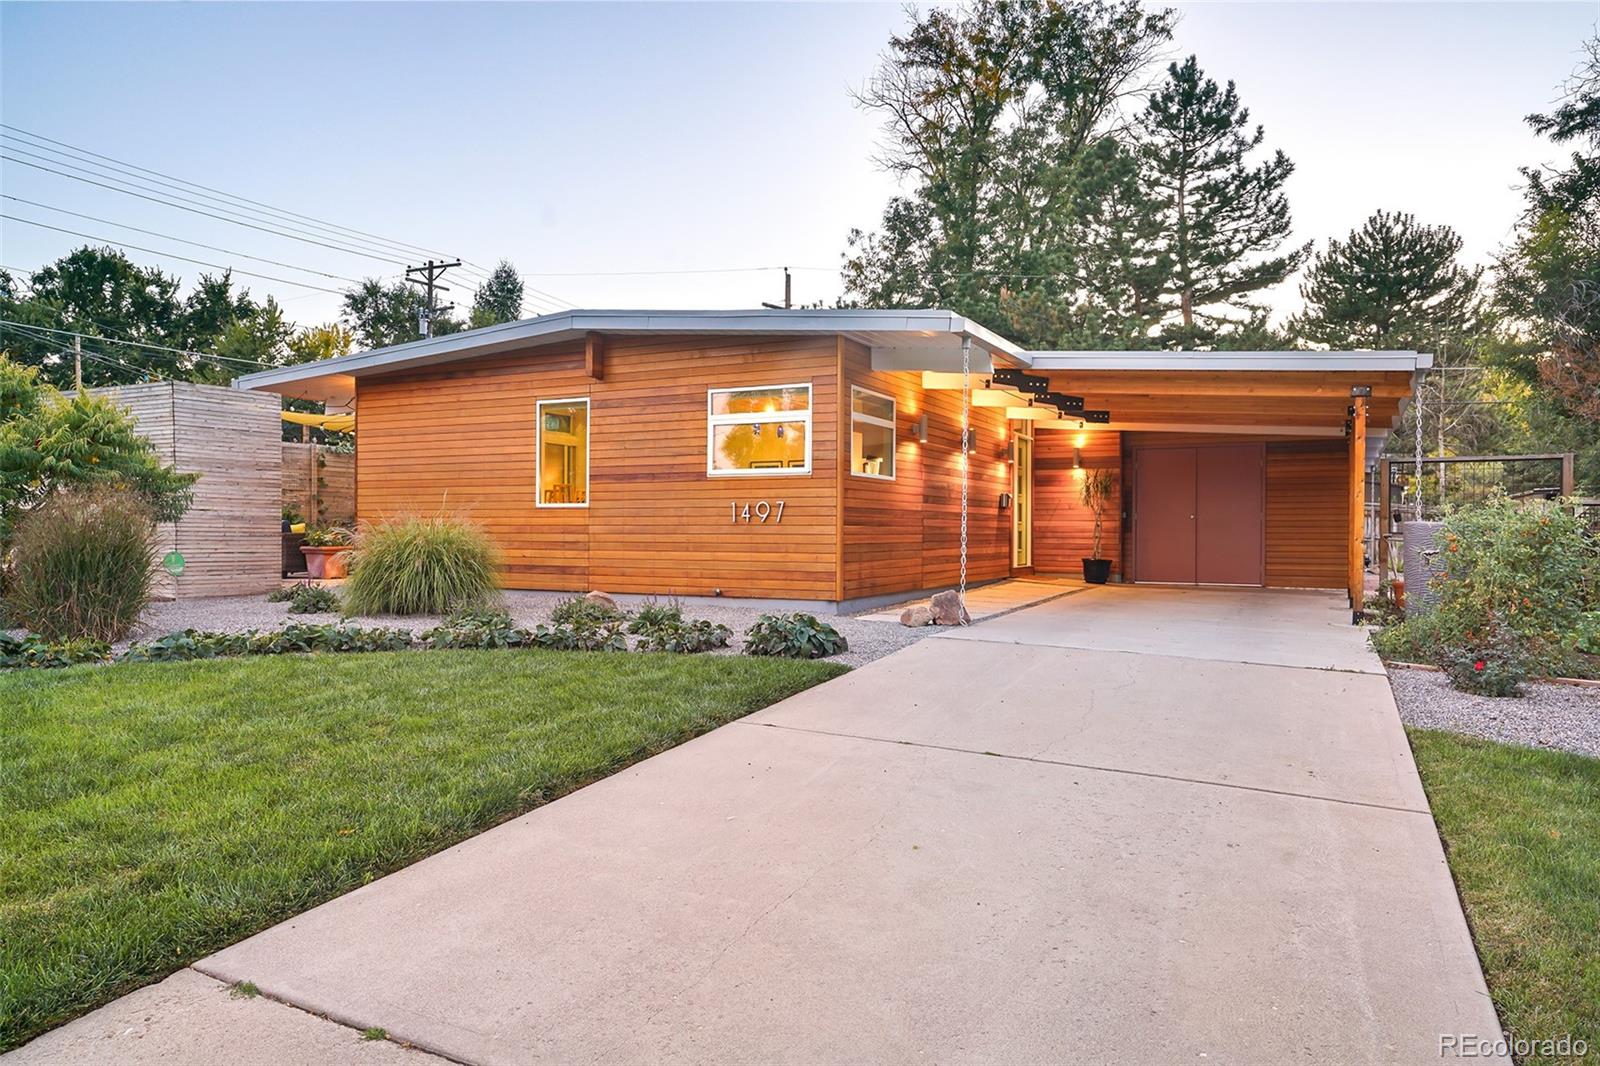
Active
$975,000
3
bds
|
2
ba
|
1,677
sqft
|
built
1955
1497 S Fairfax St, Denver, CO 80222
$-1,528
Cash flow
-8.2%
Cash-on-Cash Return
3.8%
Cap rate
0.5%
Rent to Value Ratio
Active
$375,000
2
bds
|
2
ba
|
1,200
sqft
|
built
1976
6960 E Girard Ave, Denver, CO 80224
$-1,052
Cash flow
-14.6%
Cash-on-Cash Return
2.3%
Cap rate
0.5%
Rent to Value Ratio
Active
$214,900
1
bds
|
1
ba
|
591
sqft
|
built
1951
1101 Bellaire St, Denver, CO 80220
$-408
Cash flow
-9.9%
Cash-on-Cash Return
3.4%
Cap rate
0.7%
Rent to Value Ratio
Active
$4,495,000
3
bds
|
4
ba
|
5,189
sqft
|
built
2002
418 Steele St, Denver, CO 80206
$-18,508
Cash flow
-21.5%
Cash-on-Cash Return
0.7%
Cap rate
0.1%
Rent to Value Ratio
Active
$180,000
1
bds
|
1
ba
|
672
sqft
|
built
1973
6800 E Tennessee Ave, Denver, CO 80224
$-111
Cash flow
-3.2%
Cash-on-Cash Return
4.9%
Cap rate
0.9%
Rent to Value Ratio
Active
$360,000
1
bds
|
1
ba
|
623
sqft
|
built
2020
2729 W 28th Ave, Denver, CO 80211
$-638
Cash flow
-9.2%
Cash-on-Cash Return
3.6%
Cap rate
0.6%
Rent to Value Ratio
Active
$649,000
2
bds
|
2
ba
|
1,247
sqft
|
built
1998
2501 15th St, Denver, CO 80211
$-1,721
Cash flow
-13.8%
Cash-on-Cash Return
2.5%
Cap rate
0.5%
Rent to Value Ratio