El Cajon, CA Investment Properties for Sale
Browse homes for sale and investment properties in El Cajon, CA. Refine your search by price, property type, or more.
Best cash flowing properties in El Cajon, CA
Active
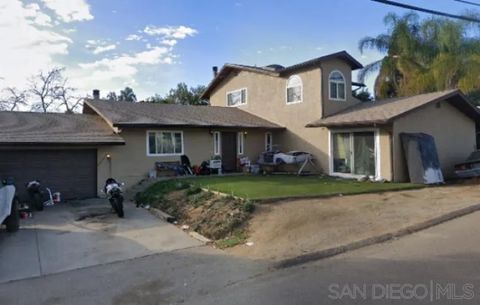
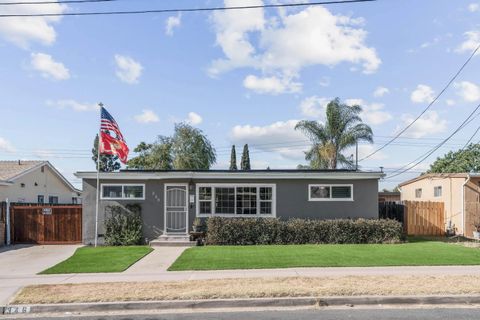
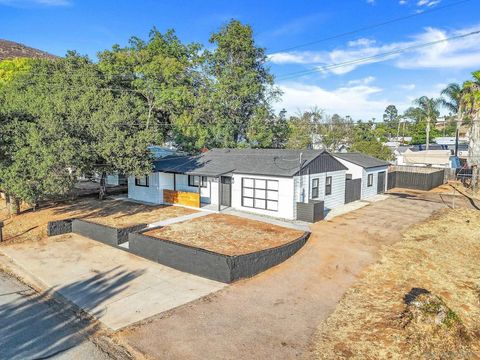
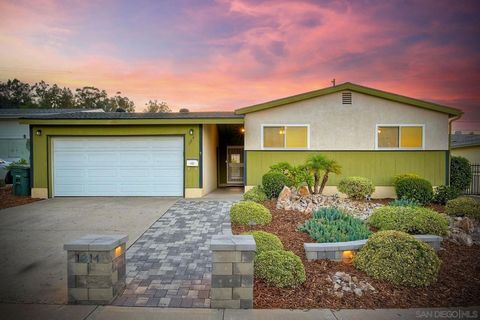
$750,000
4
bds
|
2
ba
|
2,076
sqft
|
built
1960
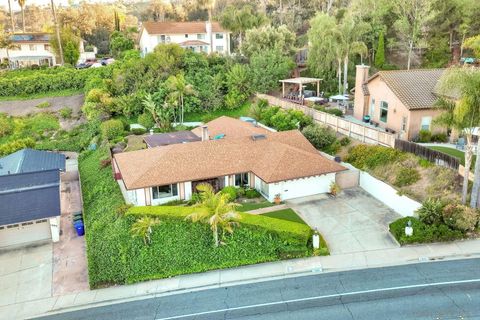
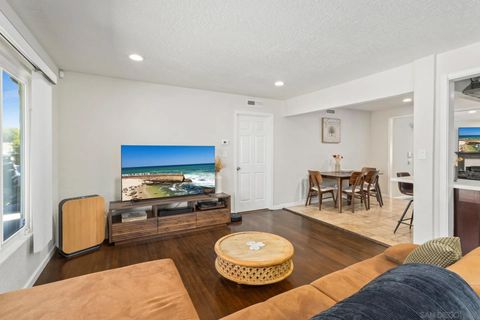
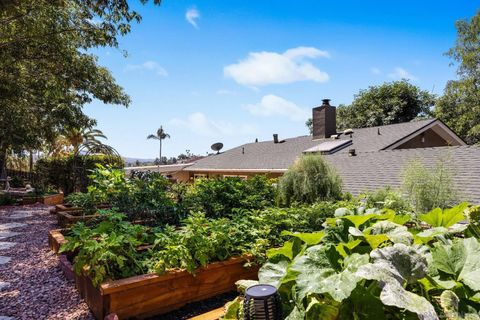
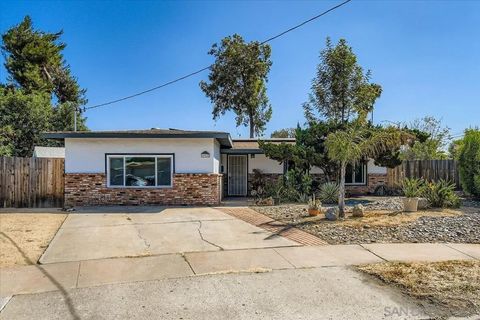
226 Lento Ln, El Cajon, CA 92021
$-756
Cash flow
-5.3%
Cash-on-Cash Return
4.9%
Cap rate
0.6%
Rent to Value Ratio
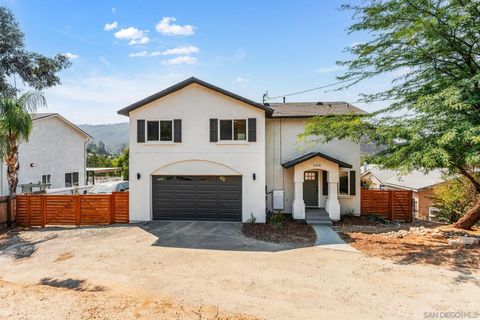
Active
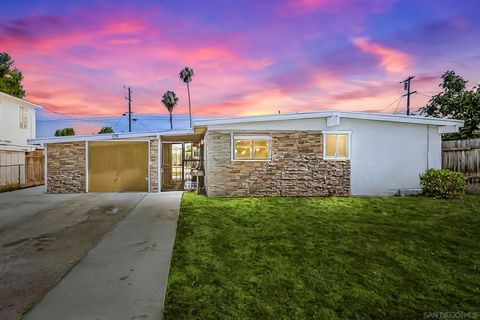
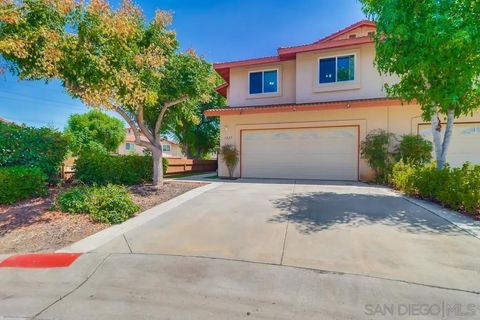
$799,000
4
bds
|
3
ba
|
1,362
sqft
|
built
2008
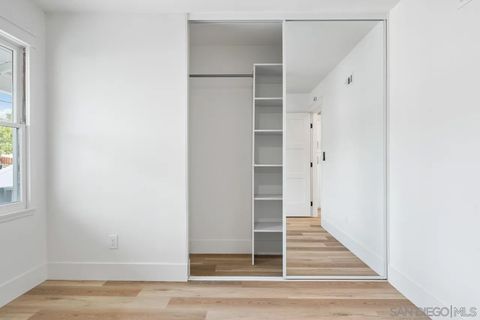
250 Editha Dr, El Cajon, CA 92019
$-935
Cash flow
-6.1%
Cash-on-Cash Return
4.7%
Cap rate
0.6%
Rent to Value Ratio
60 out of 128 properties for sale in El Cajon, CA
Limited Results Shown
Create a free account, or log in to reveal all property listings and enjoy the complete experience.
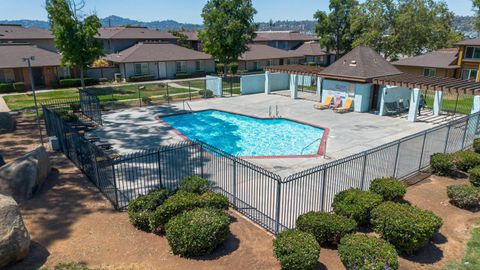
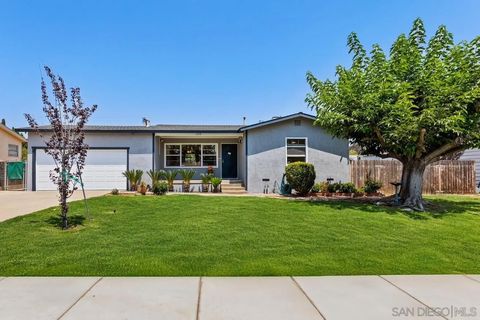
Active
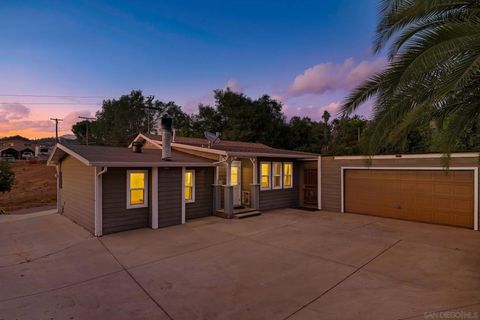
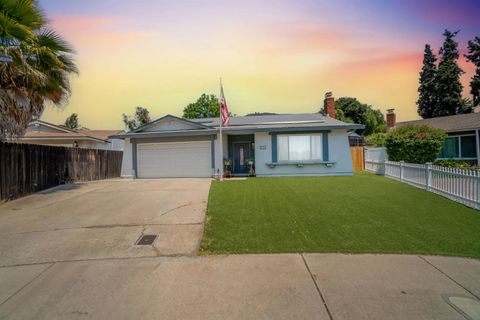
$489,000
3
bds
|
1
ba
|
1,035
sqft
|
built
1974
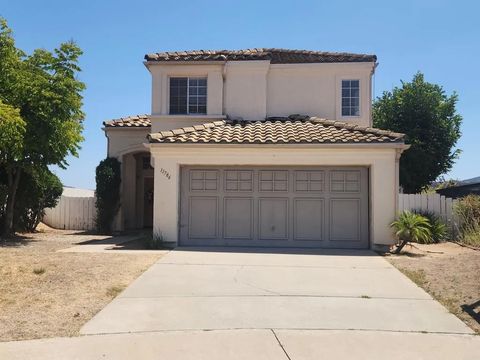
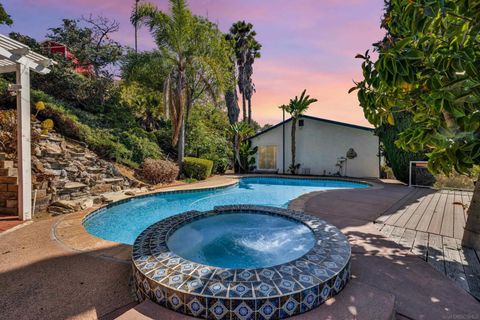
1772 Summertime Dr, El Cajon, CA 92021
$-1,041
Cash flow
-11.1%
Cash-on-Cash Return
3.5%
Cap rate
0.6%
Rent to Value Ratio
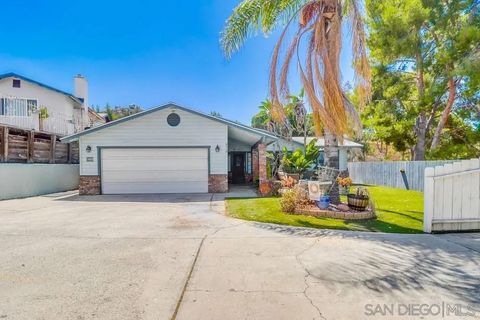
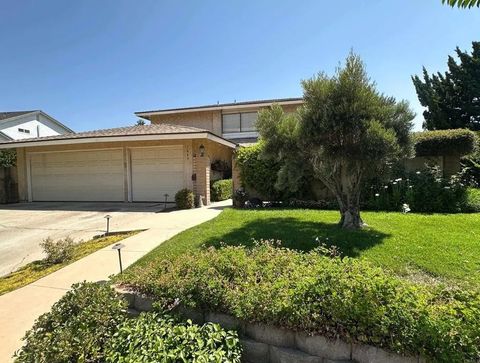
Active
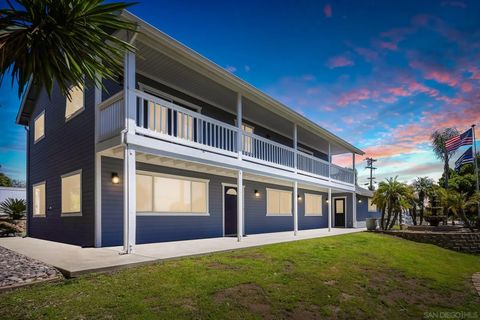
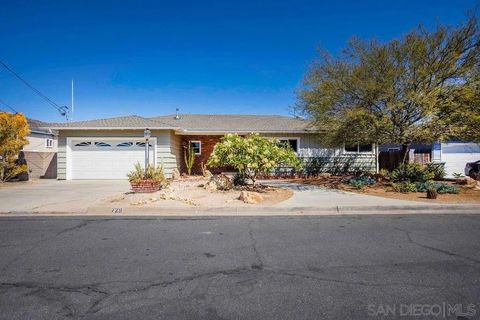
$859,000
4
bds
|
3
ba
|
1,775
sqft
|
built
1990
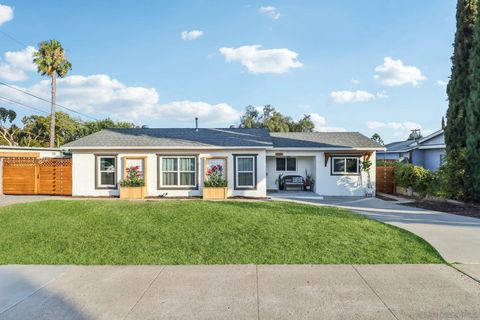
8510 Calle De Buena Fe, El Cajon, CA 92021
$-1,308
Cash flow
-7.9%
Cash-on-Cash Return
4.2%
Cap rate
0.5%
Rent to Value Ratio
Active
$715,000
3
bds
|
1
ba
|
1,120
sqft
|
built
1952
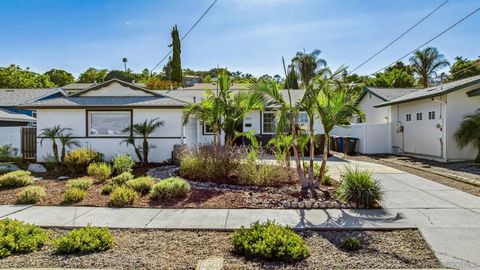
346 Patricia Ln, El Cajon, CA 92020
$-1,131
Cash flow
-8.3%
Cash-on-Cash Return
4.2%
Cap rate
0.5%
Rent to Value Ratio
Active
$695,000
3
bds
|
2
ba
|
1,014
sqft
|
built
1958
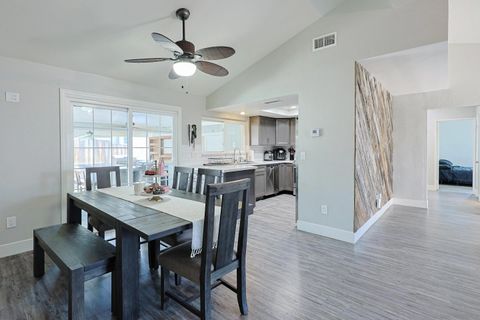
1378 Ivory Ct, El Cajon, CA 92019
$-1,099
Cash flow
-8.3%
Cash-on-Cash Return
4.2%
Cap rate
0.5%
Rent to Value Ratio
Active
$799,000
3
bds
|
3
ba
|
1,568
sqft
|
built
1961
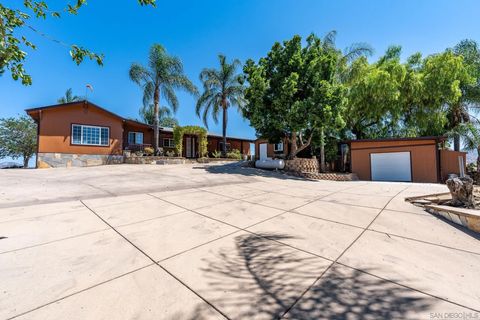
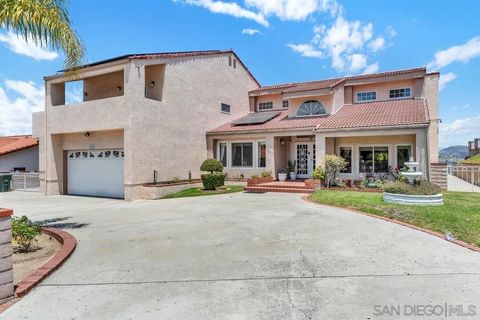
15415 Saint Lucy Ln, El Cajon, CA 92021
$-935
Cash flow
-6.1%
Cash-on-Cash Return
4.7%
Cap rate
0.6%
Rent to Value Ratio
Active
$885,000
4
bds
|
3
ba
|
2,490
sqft
|
built
1999
235 Loma Vista Pl, El Cajon, CA 92021
$-1,025
Cash flow
-6.0%
Cash-on-Cash Return
4.7%
Cap rate
0.6%
Rent to Value Ratio
Active
$799,000
3
bds
|
2
ba
|
1,348
sqft
|
built
1952
1301 Clove St, El Cajon, CA 92021
$-1,556
Cash flow
-10.2%
Cash-on-Cash Return
3.7%
Cap rate
0.5%
Rent to Value Ratio
Active
$828,000
2
bds
|
1
ba
|
944
sqft
|
built
1953
1658 Greenfield Dr, El Cajon, CA 92021
$-1,979
Cash flow
-12.5%
Cash-on-Cash Return
3.2%
Cap rate
0.4%
Rent to Value Ratio
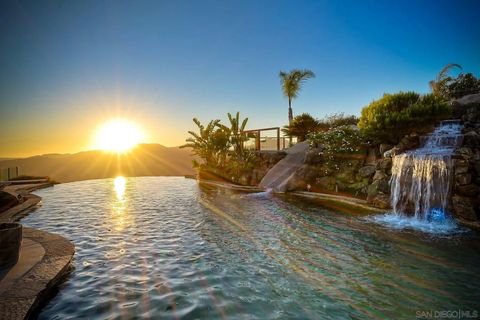
Active
$1,995,000
5
bds
|
5
ba
|
4,158
sqft
|
built
2005
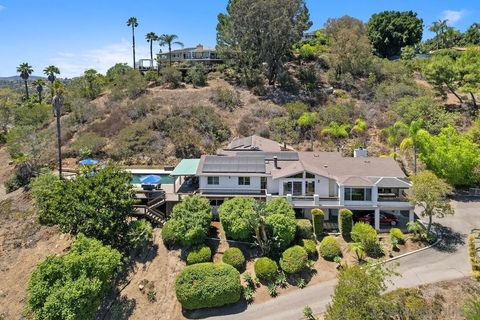
15068 Creek Hills Rd, El Cajon, CA 92021
$-5,258
Cash flow
-13.8%
Cash-on-Cash Return
2.9%
Cap rate
0.4%
Rent to Value Ratio
Active
$1,099,000
4
bds
|
3
ba
|
1,782
sqft
|
built
1973
1449 Eastside Rd, El Cajon, CA 92020
$-2,452
Cash flow
-11.6%
Cash-on-Cash Return
3.4%
Cap rate
0.4%
Rent to Value Ratio
Active
$839,900
3
bds
|
3
ba
|
1,588
sqft
|
built
1990
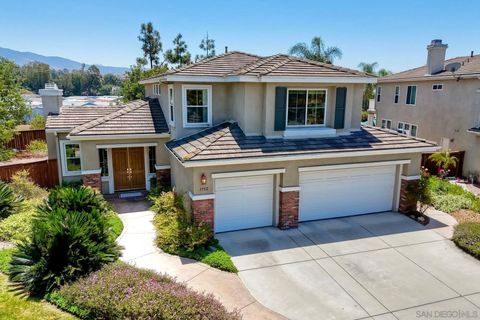
11786 Monte View Ct, El Cajon, CA 92019
$-1,328
Cash flow
-8.2%
Cash-on-Cash Return
4.2%
Cap rate
0.5%
Rent to Value Ratio
Active
$799,000
3
bds
|
2
ba
|
1,260
sqft
|
built
1959
1076 Grouse St, El Cajon, CA 92020
$-1,004
Cash flow
-6.6%
Cash-on-Cash Return
4.6%
Cap rate
0.6%
Rent to Value Ratio
Active
$719,500
3
bds
|
2
ba
|
1,347
sqft
|
built
1986
12524 Jackson Heights Dr, El Cajon, CA 92021
$-1,087
Cash flow
-7.9%
Cash-on-Cash Return
4.3%
Cap rate
0.5%
Rent to Value Ratio
Active
$1,095,000
4
bds
|
3
ba
|
1,504
sqft
|
built
1948
9111 Sierra Alta Way, El Cajon, CA 92021
$-2,432
Cash flow
-11.6%
Cash-on-Cash Return
3.4%
Cap rate
0.4%
Rent to Value Ratio
Active
$775,000
3
bds
|
2
ba
|
1,250
sqft
|
built
1958
1314 Harol St, El Cajon, CA 92020
$-1,159
Cash flow
-7.8%
Cash-on-Cash Return
4.3%
Cap rate
0.5%
Rent to Value Ratio
Active
$709,000
3
bds
|
3
ba
|
1,418
sqft
|
built
2004
1227 Winter View Pl, El Cajon, CA 92021
$-1,226
Cash flow
-9.0%
Cash-on-Cash Return
4.0%
Cap rate
0.5%
Rent to Value Ratio
Active
$749,999
3
bds
|
2
ba
|
1,290
sqft
|
built
1974
1763 Summer Place Dr, El Cajon, CA 92021
$-1,101
Cash flow
-7.7%
Cash-on-Cash Return
4.3%
Cap rate
0.5%
Rent to Value Ratio
Active
$995,000
3
bds
|
2
ba
|
1,851
sqft
|
built
1955
729 Carlow Ct, El Cajon, CA 92020
$-1,857
Cash flow
-9.7%
Cash-on-Cash Return
3.8%
Cap rate
0.5%
Rent to Value Ratio
Active
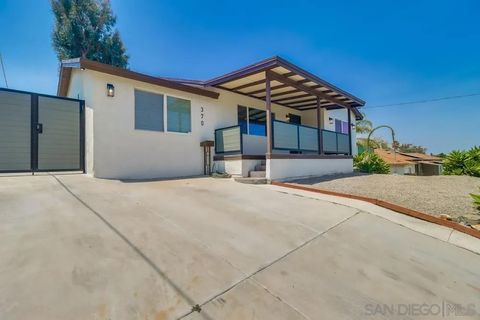
$889,000
3
bds
|
2
ba
|
1,300
sqft
|
built
1951
370 N Cuyamaca St, El Cajon, CA 92020
$-2,011
Cash flow
-11.8%
Cash-on-Cash Return
3.4%
Cap rate
0.4%
Rent to Value Ratio
Active
$1,149,000
5
bds
|
3
ba
|
2,162
sqft
|
built
1960
198 Croydon Ln, El Cajon, CA 92020
$-1,532
Cash flow
-7.0%
Cash-on-Cash Return
4.5%
Cap rate
0.5%
Rent to Value Ratio
Active
$1,199,900
4
bds
|
2
ba
|
2,387
sqft
|
built
1975
2528 Windmill View Rd, El Cajon, CA 92020
$-2,646
Cash flow
-11.5%
Cash-on-Cash Return
3.4%
Cap rate
0.4%
Rent to Value Ratio
Active
$1,300,000
6
bds
|
4
ba
|
0
sqft
|
built
1972
2297 1/2 Orchard Ave, El Cajon, CA 92019
$-3,124
Cash flow
-12.5%
Cash-on-Cash Return
3.2%
Cap rate
0.4%
Rent to Value Ratio
Active
$1,095,000
3
bds
|
2
ba
|
2,301
sqft
|
built
1970
1605 Swallow Dr, El Cajon, CA 92020
$-2,156
Cash flow
-10.3%
Cash-on-Cash Return
3.7%
Cap rate
0.4%
Rent to Value Ratio
Active
$879,000
4
bds
|
2
ba
|
1,608
sqft
|
built
1960
346 El Monte Rd, El Cajon, CA 92020
$-1,616
Cash flow
-9.6%
Cash-on-Cash Return
3.9%
Cap rate
0.5%
Rent to Value Ratio
Active
$945,000
4
bds
|
2
ba
|
2,010
sqft
|
built
1958
1807 Double D Dr, El Cajon, CA 92021
$-1,259
Cash flow
-7.0%
Cash-on-Cash Return
4.5%
Cap rate
0.5%
Rent to Value Ratio
Active
$1,650,000
5
bds
|
4
ba
|
3,377
sqft
|
built
1980
11651 Shadowglen Rd, El Cajon, CA 92020
$-2,340
Cash flow
-7.4%
Cash-on-Cash Return
4.4%
Cap rate
0.5%
Rent to Value Ratio
Active
$739,000
4
bds
|
2
ba
|
1,562
sqft
|
built
1960
992 Ednabelle Ct, El Cajon, CA 92021
$-977
Cash flow
-6.9%
Cash-on-Cash Return
4.5%
Cap rate
0.5%
Rent to Value Ratio
Active
$849,888
3
bds
|
2
ba
|
1,336
sqft
|
built
1961
812 Alveda Ave, El Cajon, CA 92019
$-1,814
Cash flow
-11.1%
Cash-on-Cash Return
3.5%
Cap rate
0.4%
Rent to Value Ratio
Active
$1,099,000
4
bds
|
4
ba
|
2,700
sqft
|
built
1977
12673 Jackson Hill Dr, El Cajon, CA 92021
$-1,210
Cash flow
-5.7%
Cash-on-Cash Return
4.7%
Cap rate
0.6%
Rent to Value Ratio
Active
$964,900
3
bds
|
2
ba
|
1,734
sqft
|
built
1947
2213 Chatham St, El Cajon, CA 92020
$-1,774
Cash flow
-9.6%
Cash-on-Cash Return
3.9%
Cap rate
0.5%
Rent to Value Ratio
Active
$1,799,900
4
bds
|
4
ba
|
3,671
sqft
|
built
1988
2257 Nielsen St, El Cajon, CA 92020
$-4,754
Cash flow
-13.8%
Cash-on-Cash Return
2.9%
Cap rate
0.4%
Rent to Value Ratio

Active
$1,049,000
3
bds
|
2
ba
|
2,164
sqft
|
built
1973
497 Vista Del Escuela, El Cajon, CA 92019
$-1,854
Cash flow
-9.2%
Cash-on-Cash Return
3.9%
Cap rate
0.5%
Rent to Value Ratio

Active
$589,000
2
bds
|
3
ba
|
1,374
sqft
|
built
1981
1138 Via Loma Vis, El Cajon, CA 92019
$-1,230
Cash flow
-10.9%
Cash-on-Cash Return
3.6%
Cap rate
0.5%
Rent to Value Ratio

Active
$759,950
3
bds
|
1
ba
|
962
sqft
|
built
1951
282 Garfield Ave, El Cajon, CA 92020
$-1,359
Cash flow
-9.3%
Cash-on-Cash Return
3.9%
Cap rate
0.5%
Rent to Value Ratio
Active
$1,425,000
5
bds
|
3
ba
|
2,871
sqft
|
built
2001
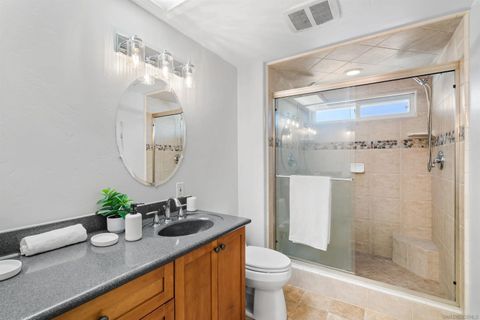
1752 Russet Leaf Ct, El Cajon, CA 92019
$-4,056
Cash flow
-14.9%
Cash-on-Cash Return
2.7%
Cap rate
0.4%
Rent to Value Ratio
Active
$1,150,000
4
bds
|
2
ba
|
2,302
sqft
|
built
1964
1658 Bartram Way, El Cajon, CA 92019
$-2,710
Cash flow
-12.3%
Cash-on-Cash Return
3.2%
Cap rate
0.4%
Rent to Value Ratio
Active
$1,438,990
4
bds
|
3
ba
|
2,279
sqft
|
built
1966
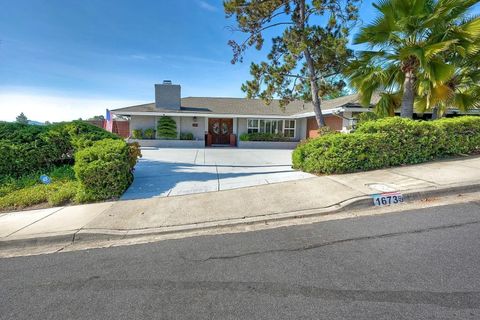
1673 Hillsmont Dr, El Cajon, CA 92020
$-2,791
Cash flow
-10.1%
Cash-on-Cash Return
3.7%
Cap rate
0.5%
Rent to Value Ratio
Active
$1,025,000
5
bds
|
3
ba
|
2,343
sqft
|
built
1995
9410 Brian Way, El Cajon, CA 92021
$-1,733
Cash flow
-8.8%
Cash-on-Cash Return
4.0%
Cap rate
0.5%
Rent to Value Ratio