Englewood, CO Investment Properties for Sale
Browse homes for sale and investment properties in Englewood, CO. Refine your search by price, property type, or more.
Best cash flowing properties in Englewood, CO
Active
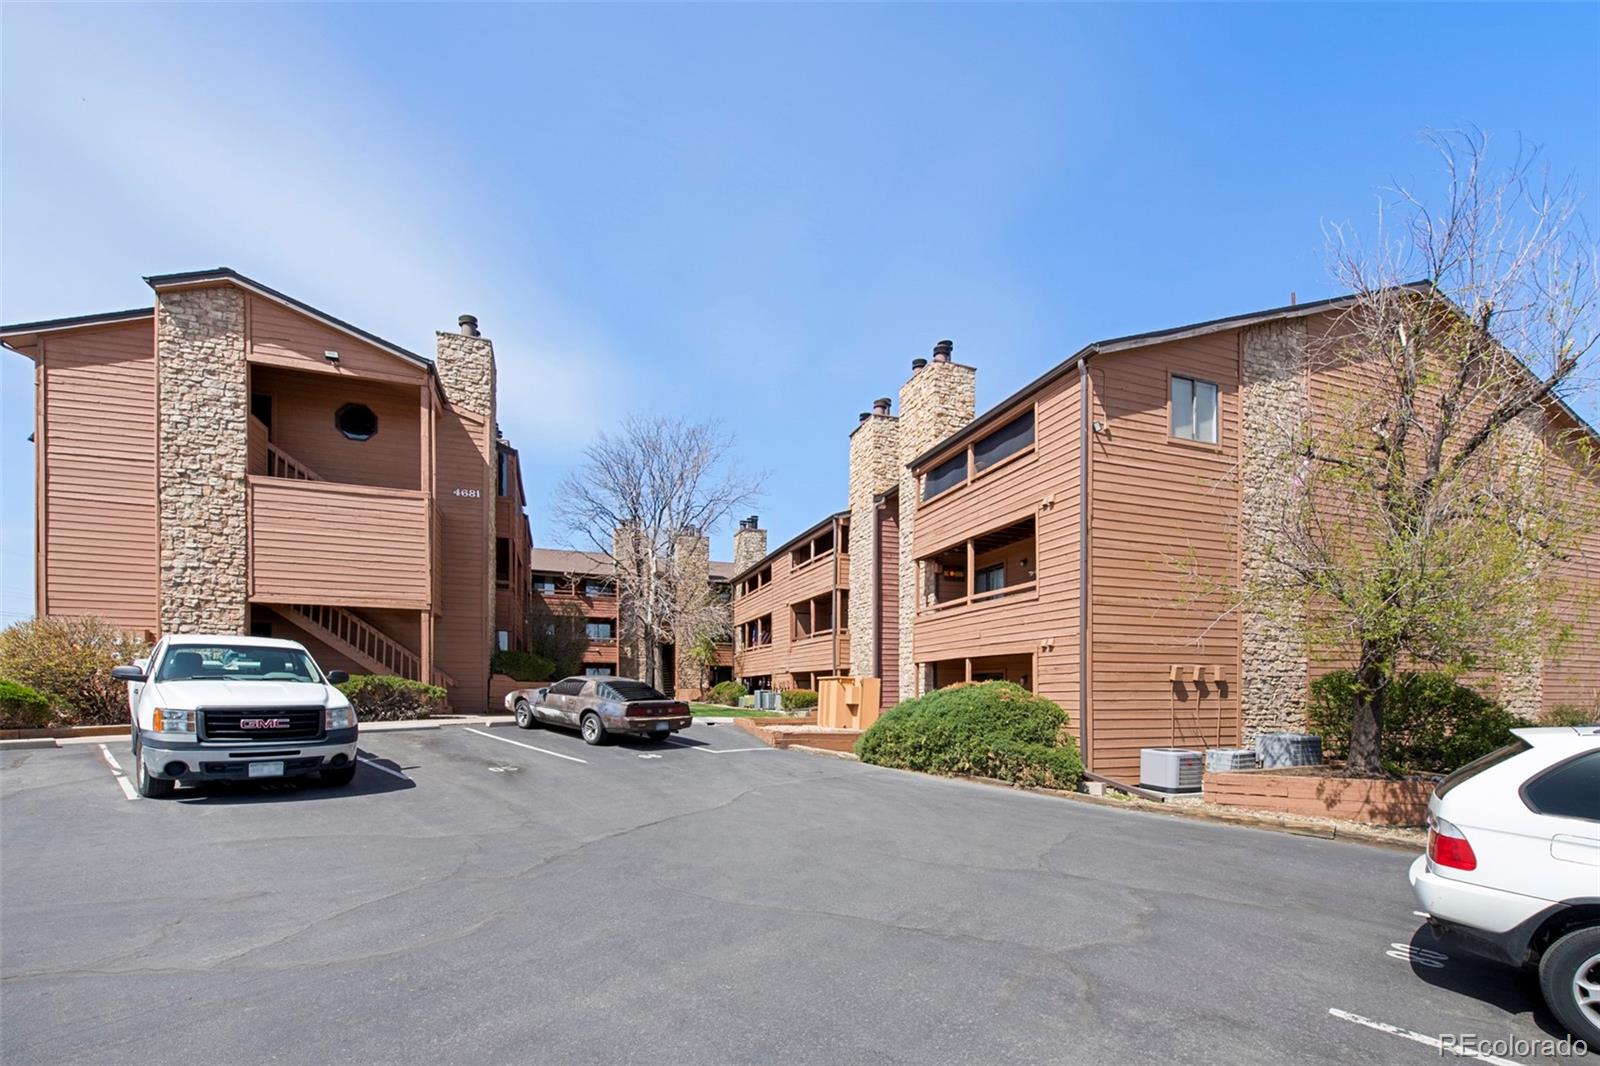
$220,000
1
bds
|
1
ba
|
648
sqft
|
built
1984
4681 S Decatur St, Englewood, CO 80110
$-282
Cash flow
-6.7%
Cash-on-Cash Return
4.1%
Cap rate
0.7%
Rent to Value Ratio
Active
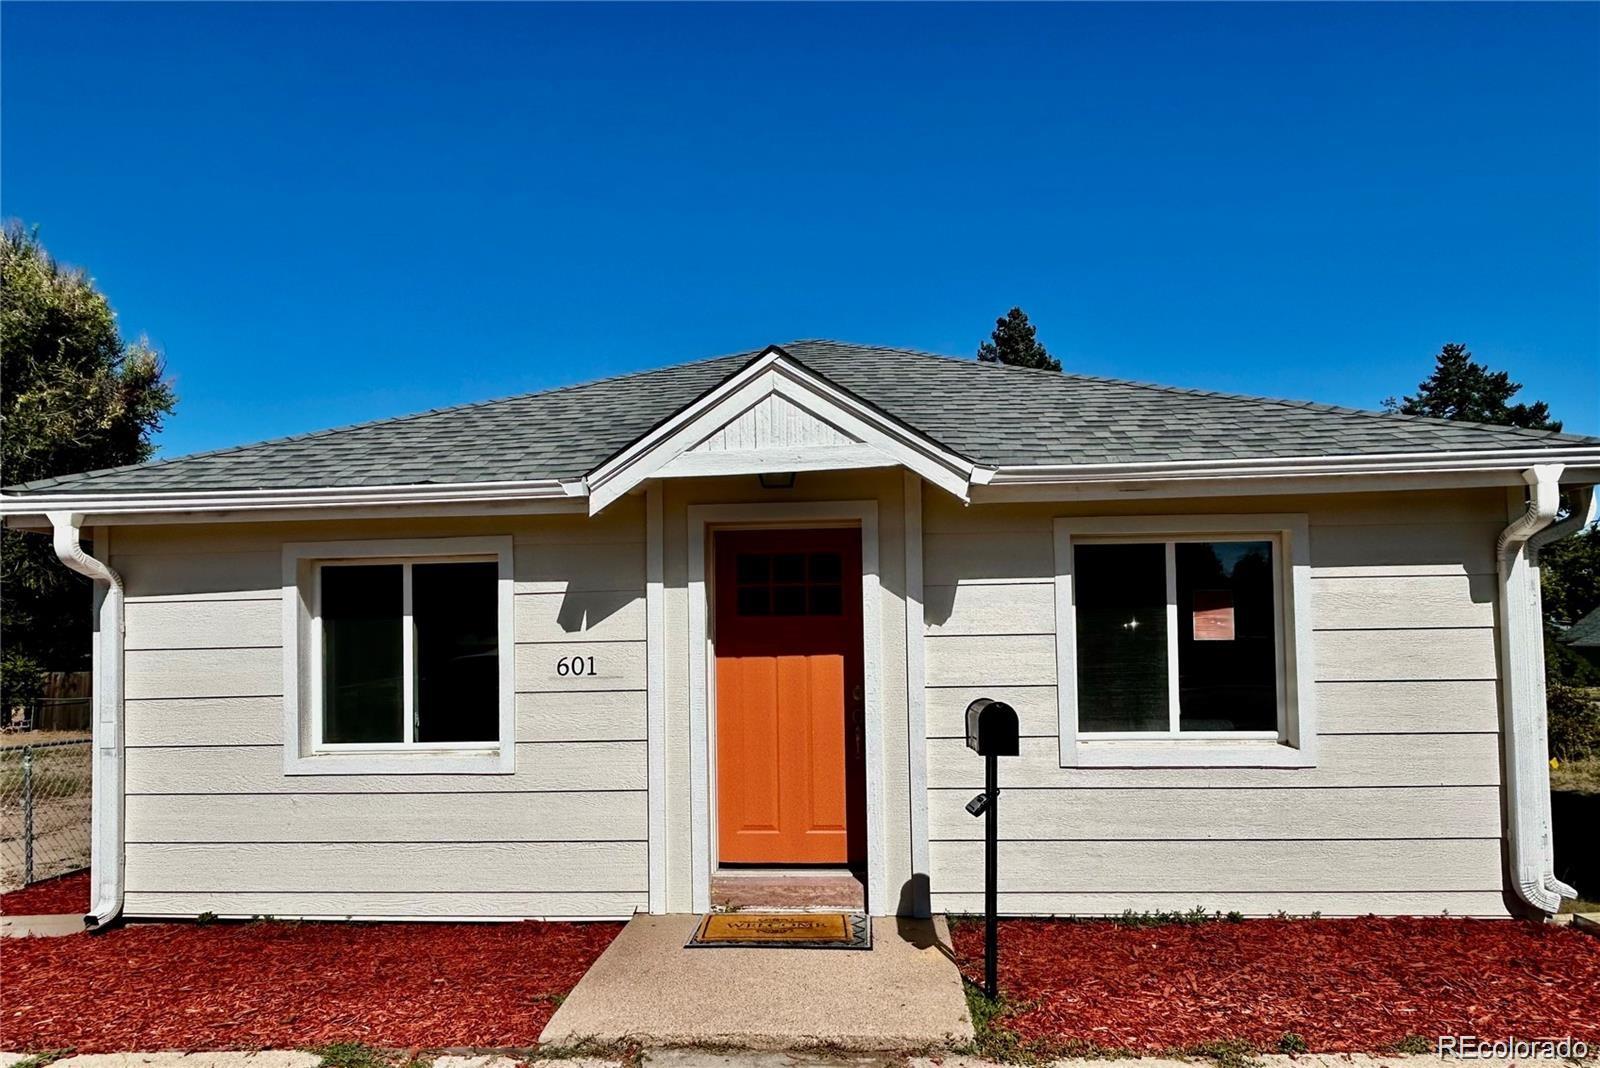
$570,000
4
bds
|
2
ba
|
1,196
sqft
|
built
1937
601 W Layton Ave, Englewood, CO 80110
$-477
Cash flow
-4.4%
Cash-on-Cash Return
4.7%
Cap rate
0.6%
Rent to Value Ratio
223 out of 255 properties for sale in Englewood, CO
Limited Results Shown
Create a free account, or log in to reveal all property listings and enjoy the complete experience.
Active
$575,000
4
bds
|
2
ba
|
2,564
sqft
|
built
1963
4960 S Fox St, Englewood, CO 80110
$-817
Cash flow
-7.4%
Cash-on-Cash Return
4.0%
Cap rate
0.5%
Rent to Value Ratio
Active
$567,000
2
bds
|
2
ba
|
978
sqft
|
built
1902
3024 S Sherman St, Englewood, CO 80113
$-882
Cash flow
-8.1%
Cash-on-Cash Return
3.8%
Cap rate
0.5%
Rent to Value Ratio
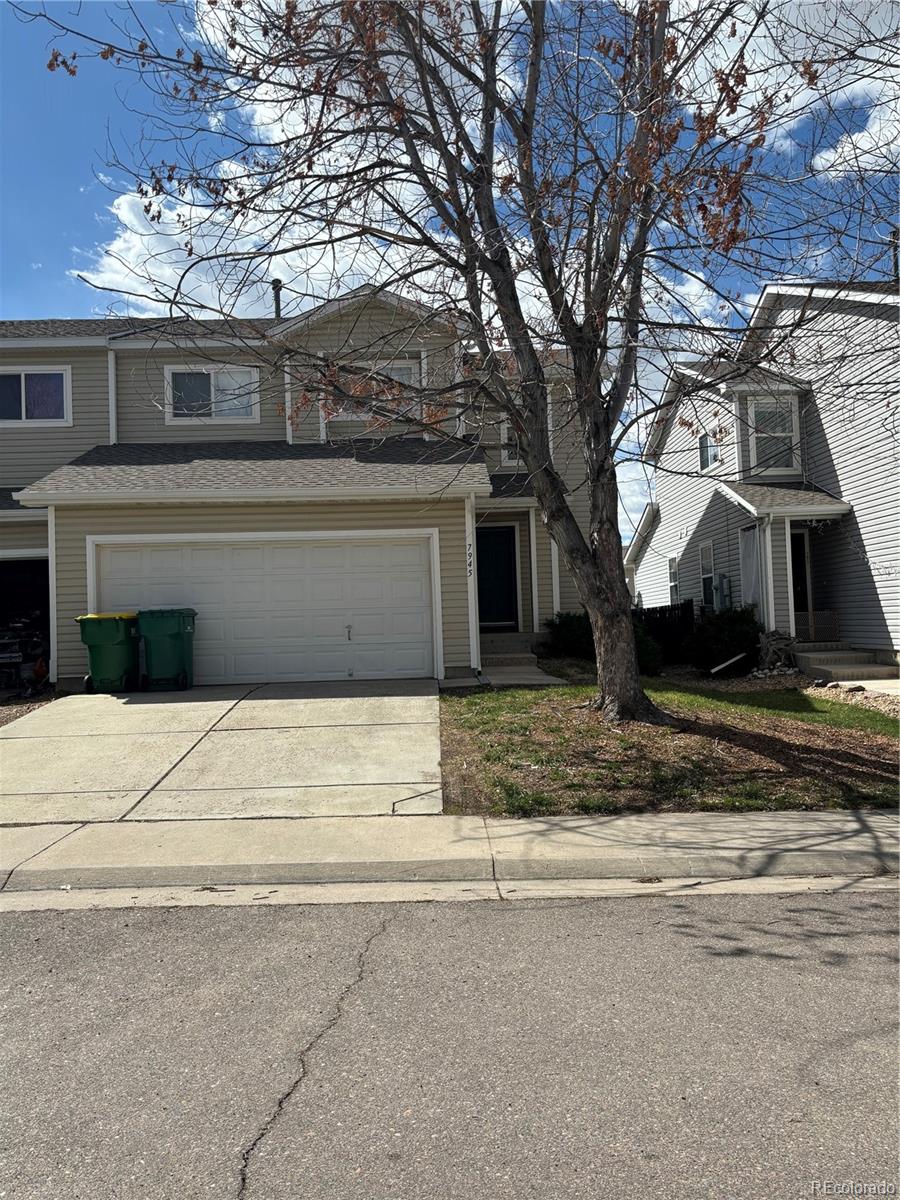
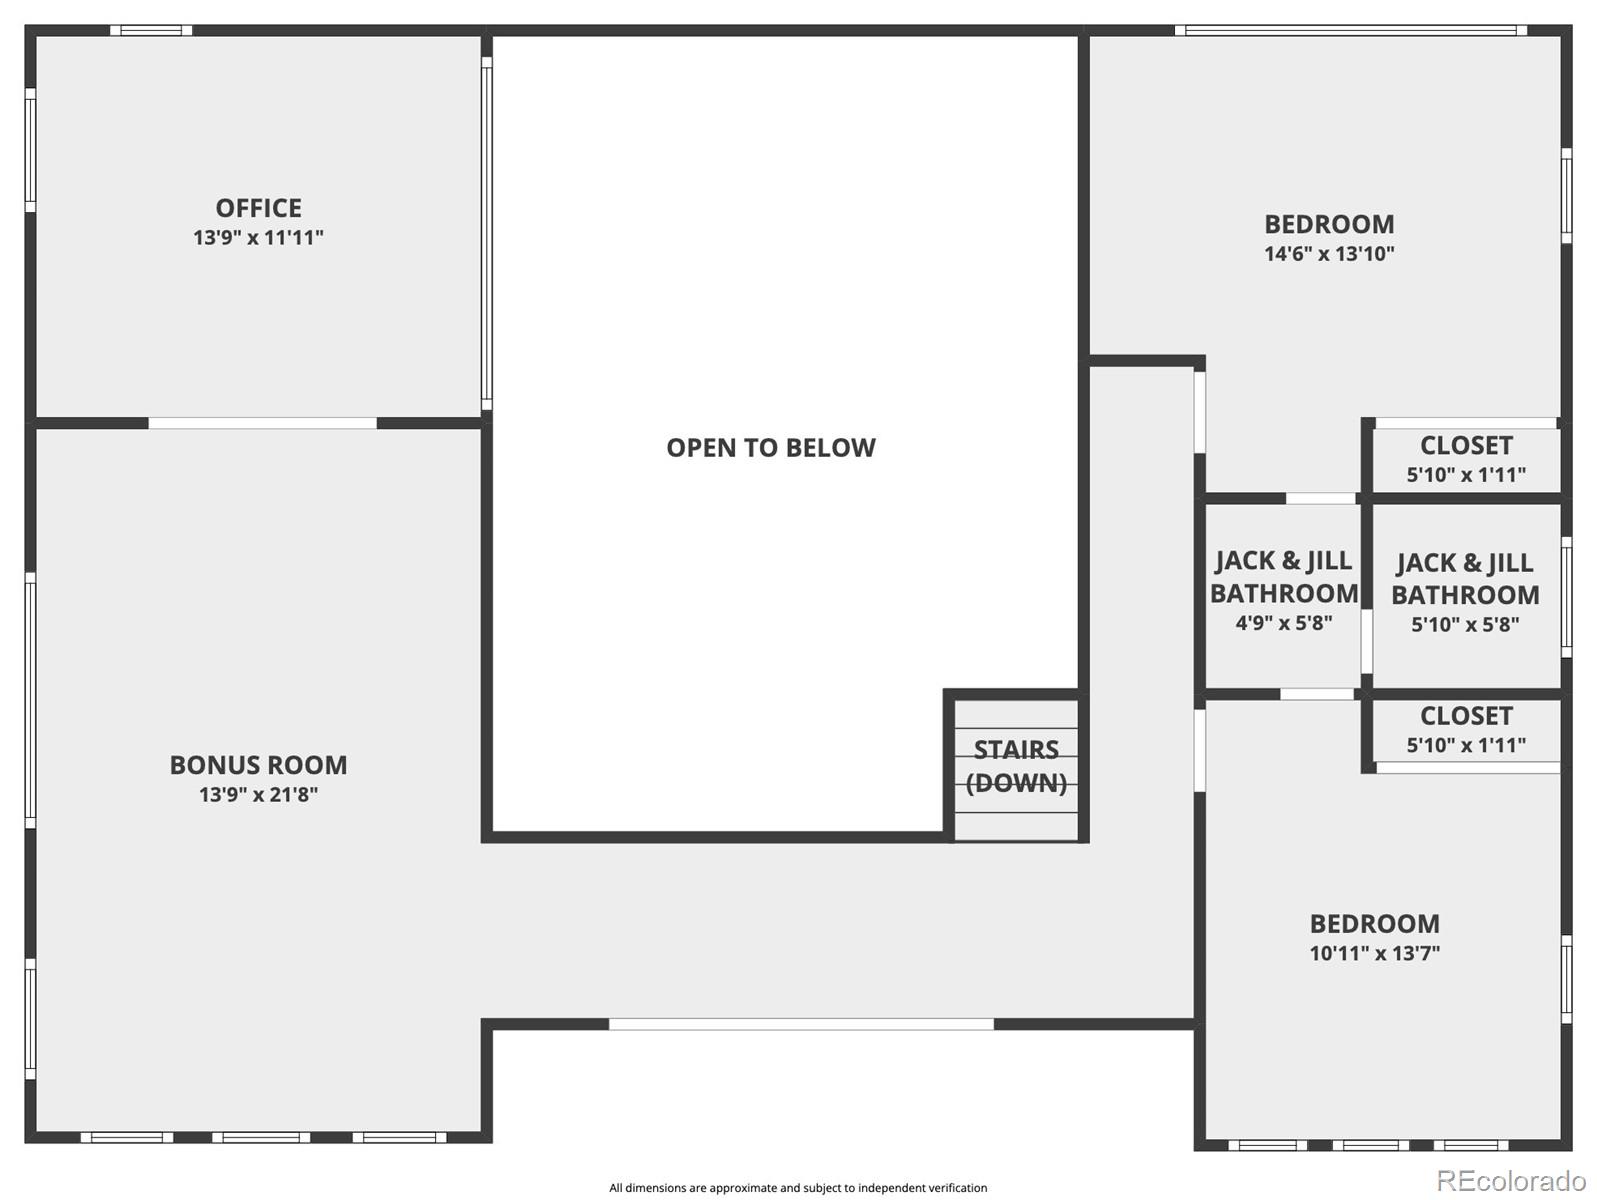
Active
$473,400
3
bds
|
3
ba
|
1,599
sqft
|
built
2000
7945 S Kittredge St, Englewood, CO 80112
$-848
Cash flow
-9.3%
Cash-on-Cash Return
3.5%
Cap rate
0.5%
Rent to Value Ratio
Active
$220,000
1
bds
|
1
ba
|
648
sqft
|
built
1984
4681 S Decatur St, Englewood, CO 80110
$-282
Cash flow
-6.7%
Cash-on-Cash Return
4.1%
Cap rate
0.7%
Rent to Value Ratio
Active
$1,999,998
8
bds
|
7
ba
|
6,088
sqft
|
built
2022
4960 S Lipan Dr, Englewood, CO 80110
$-3,356
Cash flow
-8.8%
Cash-on-Cash Return
3.7%
Cap rate
0.5%
Rent to Value Ratio
Active
$248,000
1
bds
|
1
ba
|
648
sqft
|
built
1984
4671 S Decatur St, Englewood, CO 80110
$-491
Cash flow
-10.3%
Cash-on-Cash Return
3.3%
Cap rate
0.6%
Rent to Value Ratio
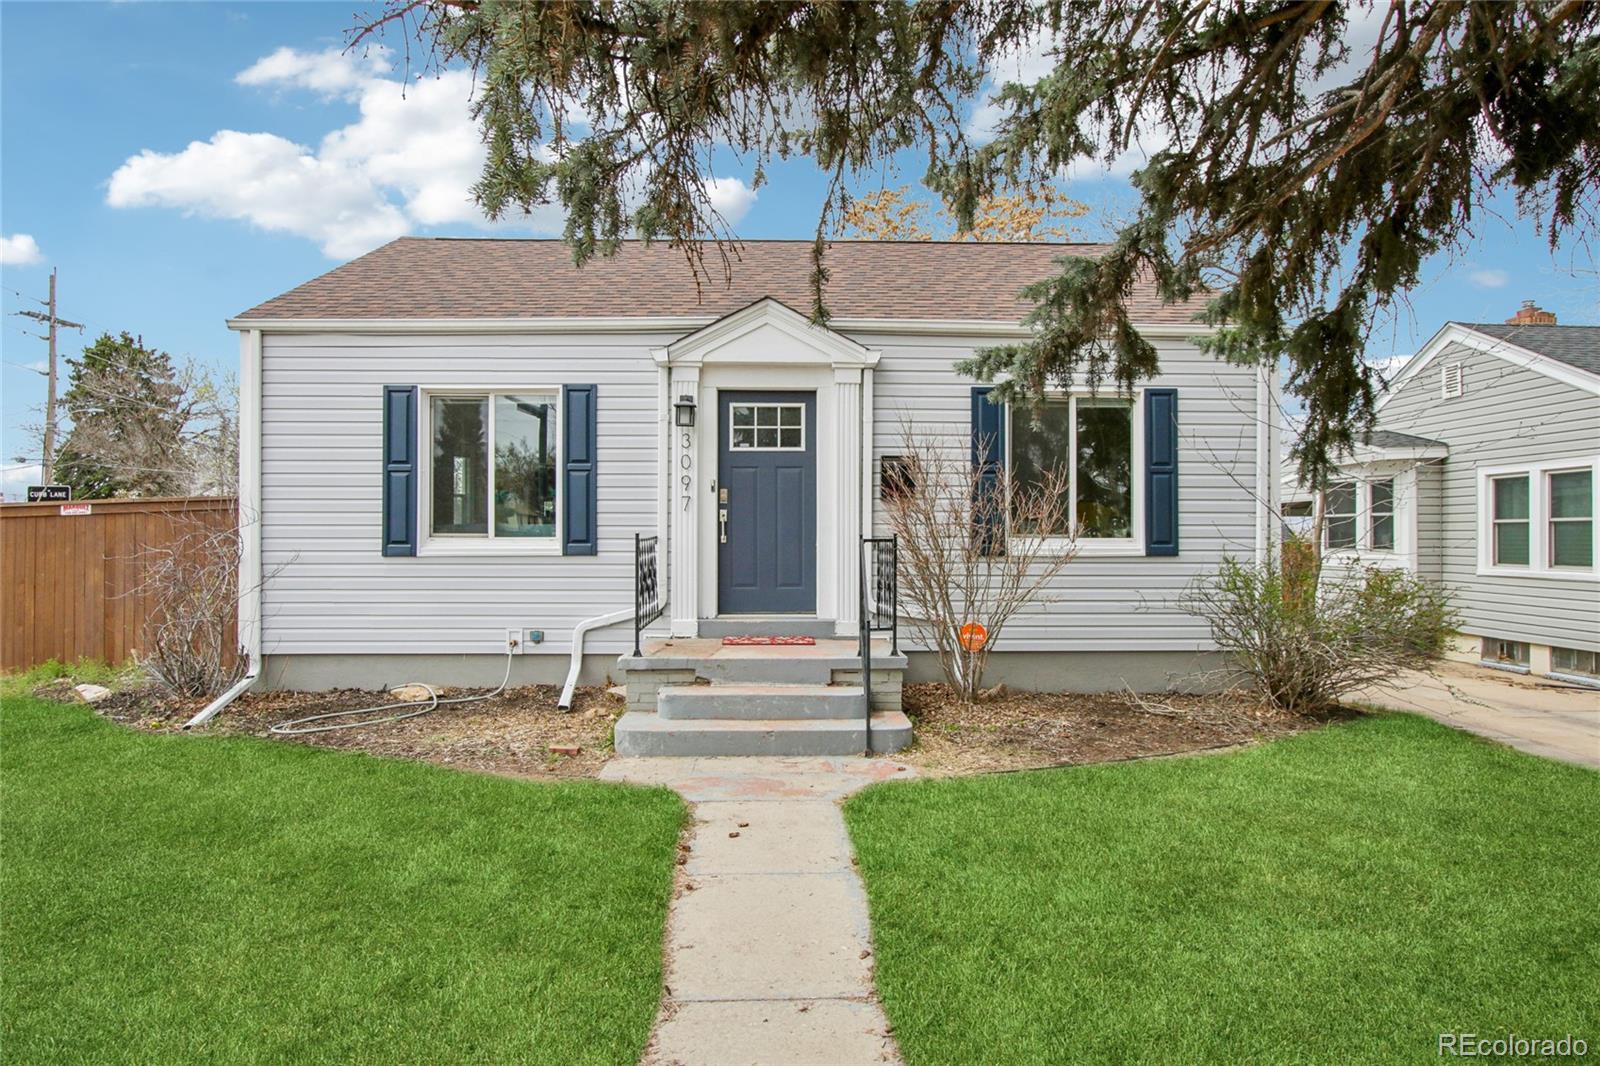
Active
$640,000
4
bds
|
2
ba
|
1,714
sqft
|
built
1927
3097 S Logan St, Englewood, CO 80113
$-1,166
Cash flow
-9.5%
Cash-on-Cash Return
3.5%
Cap rate
0.5%
Rent to Value Ratio
Active
$749,900
4
bds
|
3
ba
|
2,196
sqft
|
built
1978
6417 S Florence Way, Englewood, CO 80111
$-1,438
Cash flow
-10.0%
Cash-on-Cash Return
3.4%
Cap rate
0.5%
Rent to Value Ratio

Active
$2,290,000
5
bds
|
4
ba
|
3,886
sqft
|
built
1969
5880 S Happy Canyon Dr, Englewood, CO 80111
$-7,832
Cash flow
-17.8%
Cash-on-Cash Return
1.6%
Cap rate
0.2%
Rent to Value Ratio

Active
$1,025,000
4
bds
|
4
ba
|
2,312
sqft
|
built
2019
3522 S Ogden St, Englewood, CO 80113
$-2,147
Cash flow
-10.9%
Cash-on-Cash Return
3.2%
Cap rate
0.4%
Rent to Value Ratio
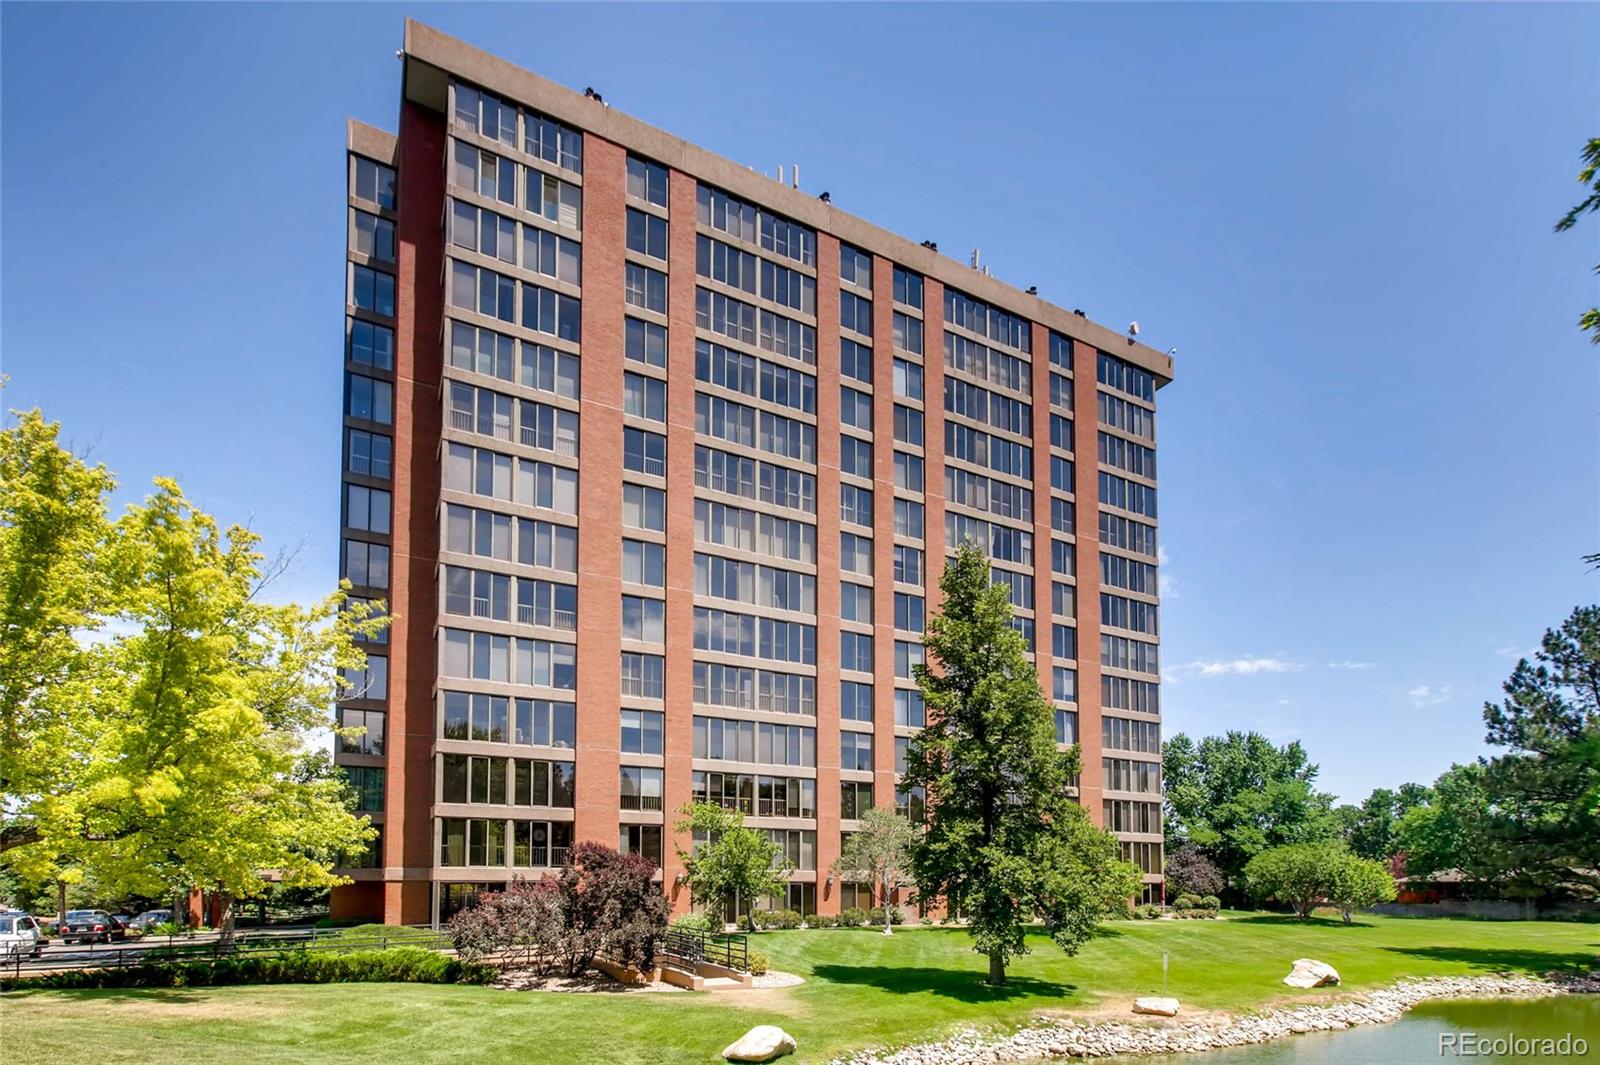
Active
$675,000
2
bds
|
3
ba
|
1,987
sqft
|
built
1982
1900 E Girard Pl, Englewood, CO 80113
$-2,985
Cash flow
-23.1%
Cash-on-Cash Return
0.4%
Cap rate
0.5%
Rent to Value Ratio
Active
$290,000
1
bds
|
1
ba
|
702
sqft
|
built
1994
8621 E Dry Creek Rd, Englewood, CO 80112
$-763
Cash flow
-13.7%
Cash-on-Cash Return
2.5%
Cap rate
0.6%
Rent to Value Ratio

Active under contract
$725,000
4
bds
|
3
ba
|
2,281
sqft
|
built
1962
295 E Amherst Ave, Englewood, CO 80113
$-1,285
Cash flow
-9.2%
Cash-on-Cash Return
3.6%
Cap rate
0.5%
Rent to Value Ratio
Active
$720,000
3
bds
|
3
ba
|
1,768
sqft
|
built
1950
3287 S Humboldt St, Englewood, CO 80113
$-1,873
Cash flow
-13.6%
Cash-on-Cash Return
2.6%
Cap rate
0.3%
Rent to Value Ratio
Active
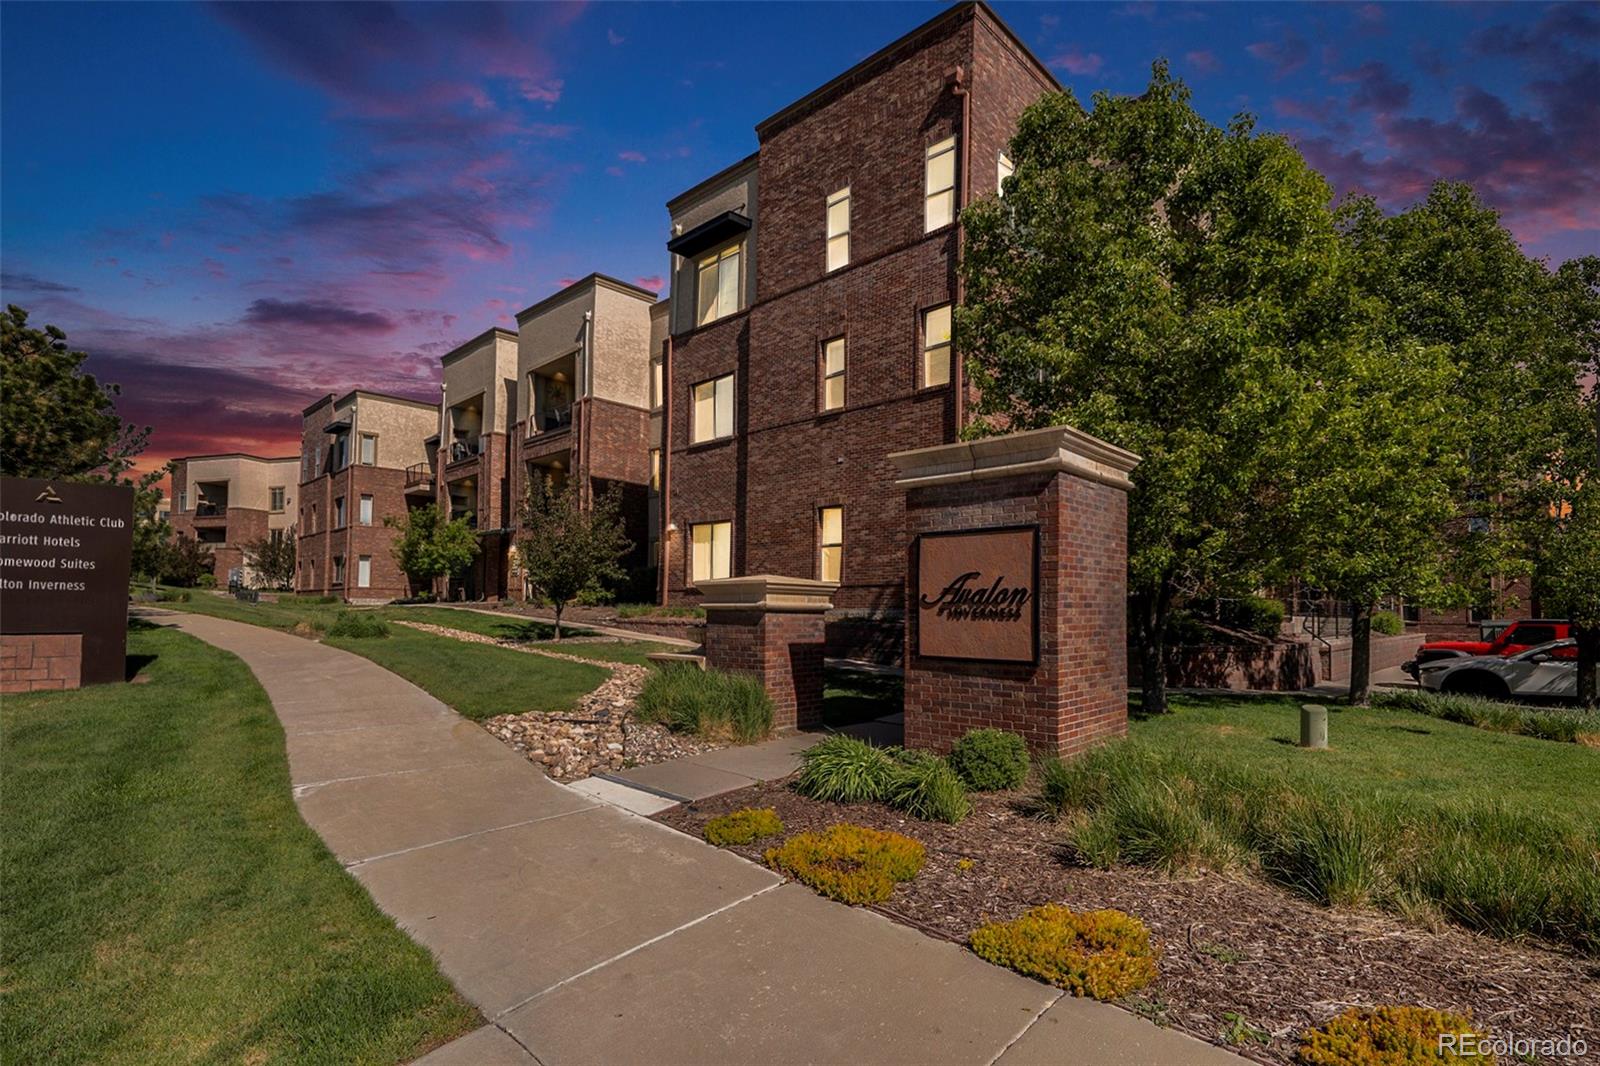
$450,000
2
bds
|
2
ba
|
1,255
sqft
|
built
2015
301 Inverness Way S, Englewood, CO 80112
$-998
Cash flow
-11.6%
Cash-on-Cash Return
3.0%
Cap rate
0.6%
Rent to Value Ratio
Active under contract
$386,000
2
bds
|
2
ba
|
1,634
sqft
|
built
1982
1900 E Girard Pl, Englewood, CO 80113
$-1,530
Cash flow
-20.7%
Cash-on-Cash Return
0.9%
Cap rate
0.6%
Rent to Value Ratio

Active
$1,275,000
5
bds
|
4
ba
|
4,190
sqft
|
built
1981
6062 S Emporia Cir, Englewood, CO 80111
$-3,722
Cash flow
-15.2%
Cash-on-Cash Return
2.2%
Cap rate
0.3%
Rent to Value Ratio

Active
$359,900
1
bds
|
1
ba
|
1,023
sqft
|
built
2009
307 Inverness Way S, Englewood, CO 80112
$-806
Cash flow
-11.7%
Cash-on-Cash Return
3.0%
Cap rate
0.6%
Rent to Value Ratio
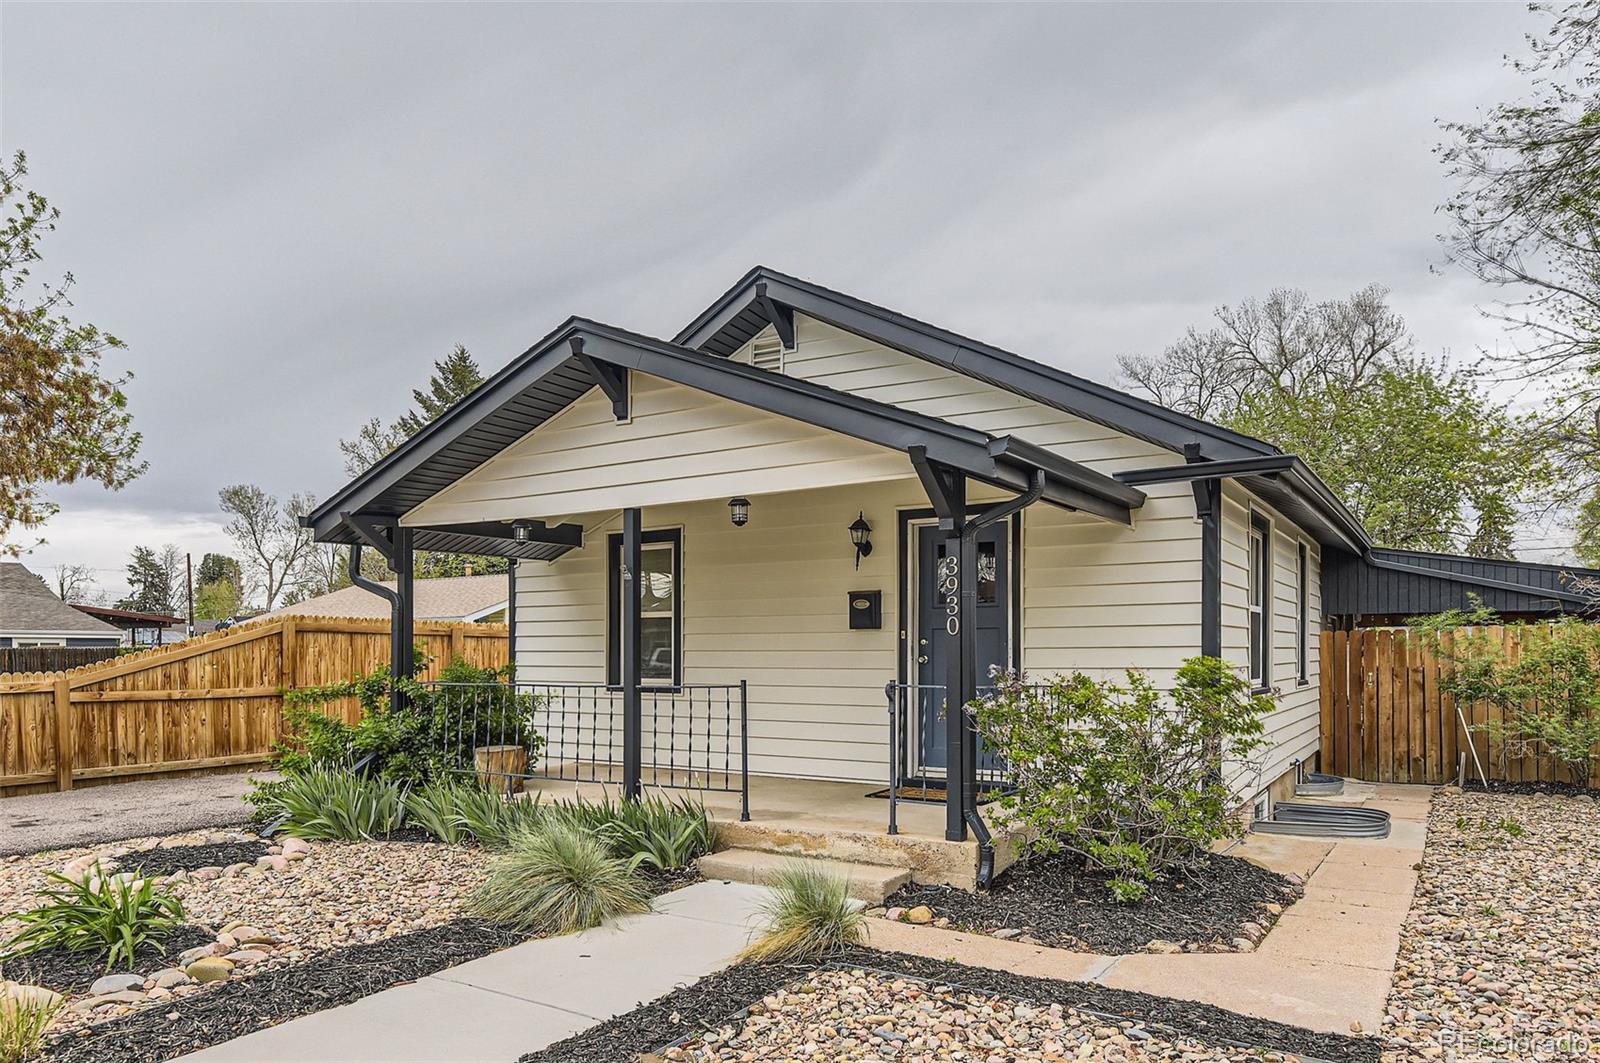
Active
$565,000
3
bds
|
2
ba
|
1,408
sqft
|
built
1923
3930 S Sherman St, Englewood, CO 80113
$-983
Cash flow
-9.1%
Cash-on-Cash Return
3.6%
Cap rate
0.5%
Rent to Value Ratio
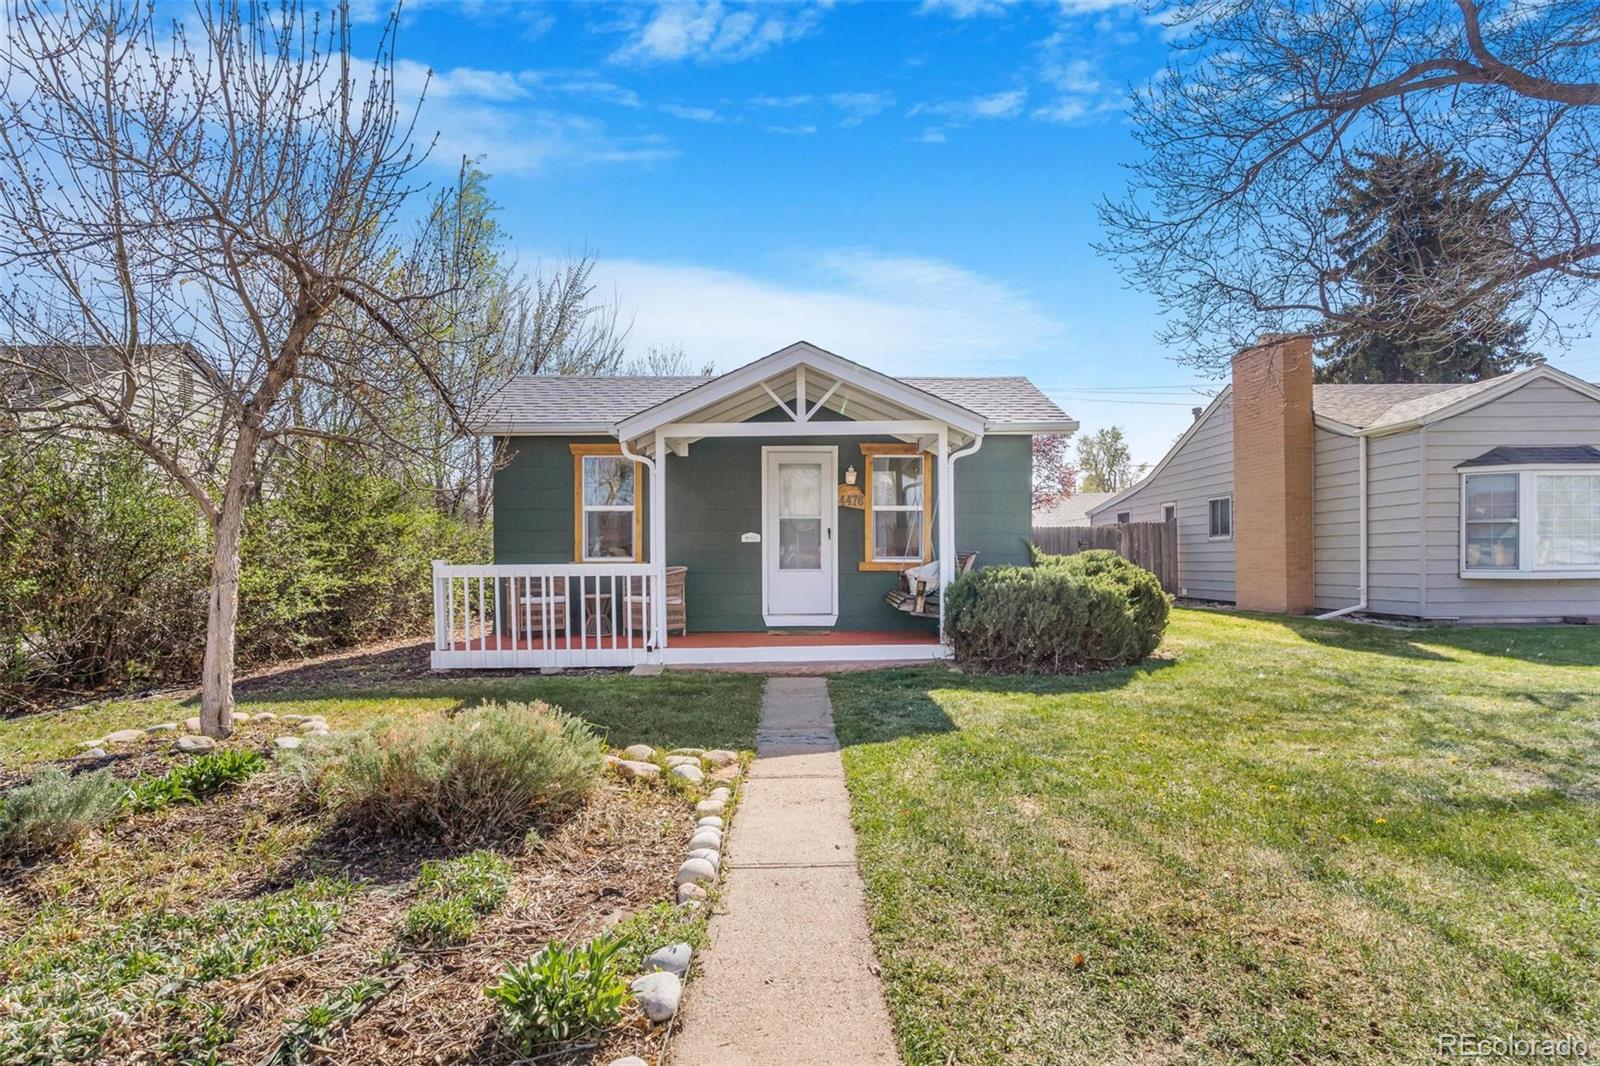
Active
$500,000
3
bds
|
1
ba
|
884
sqft
|
built
1925
4476 S Lincoln St, Englewood, CO 80113
$-856
Cash flow
-8.9%
Cash-on-Cash Return
3.6%
Cap rate
0.5%
Rent to Value Ratio
Active
$3,495,000
6
bds
|
6
ba
|
7,545
sqft
|
built
1968
4181 S Ivy Ln, Englewood, CO 80111
$-14,169
Cash flow
-21.2%
Cash-on-Cash Return
0.8%
Cap rate
0.2%
Rent to Value Ratio
Active
$540,000
2
bds
|
4
ba
|
1,728
sqft
|
built
1986
2060 W Iliff Ave, Englewood, CO 80110
$-1,044
Cash flow
-10.1%
Cash-on-Cash Return
3.4%
Cap rate
0.5%
Rent to Value Ratio
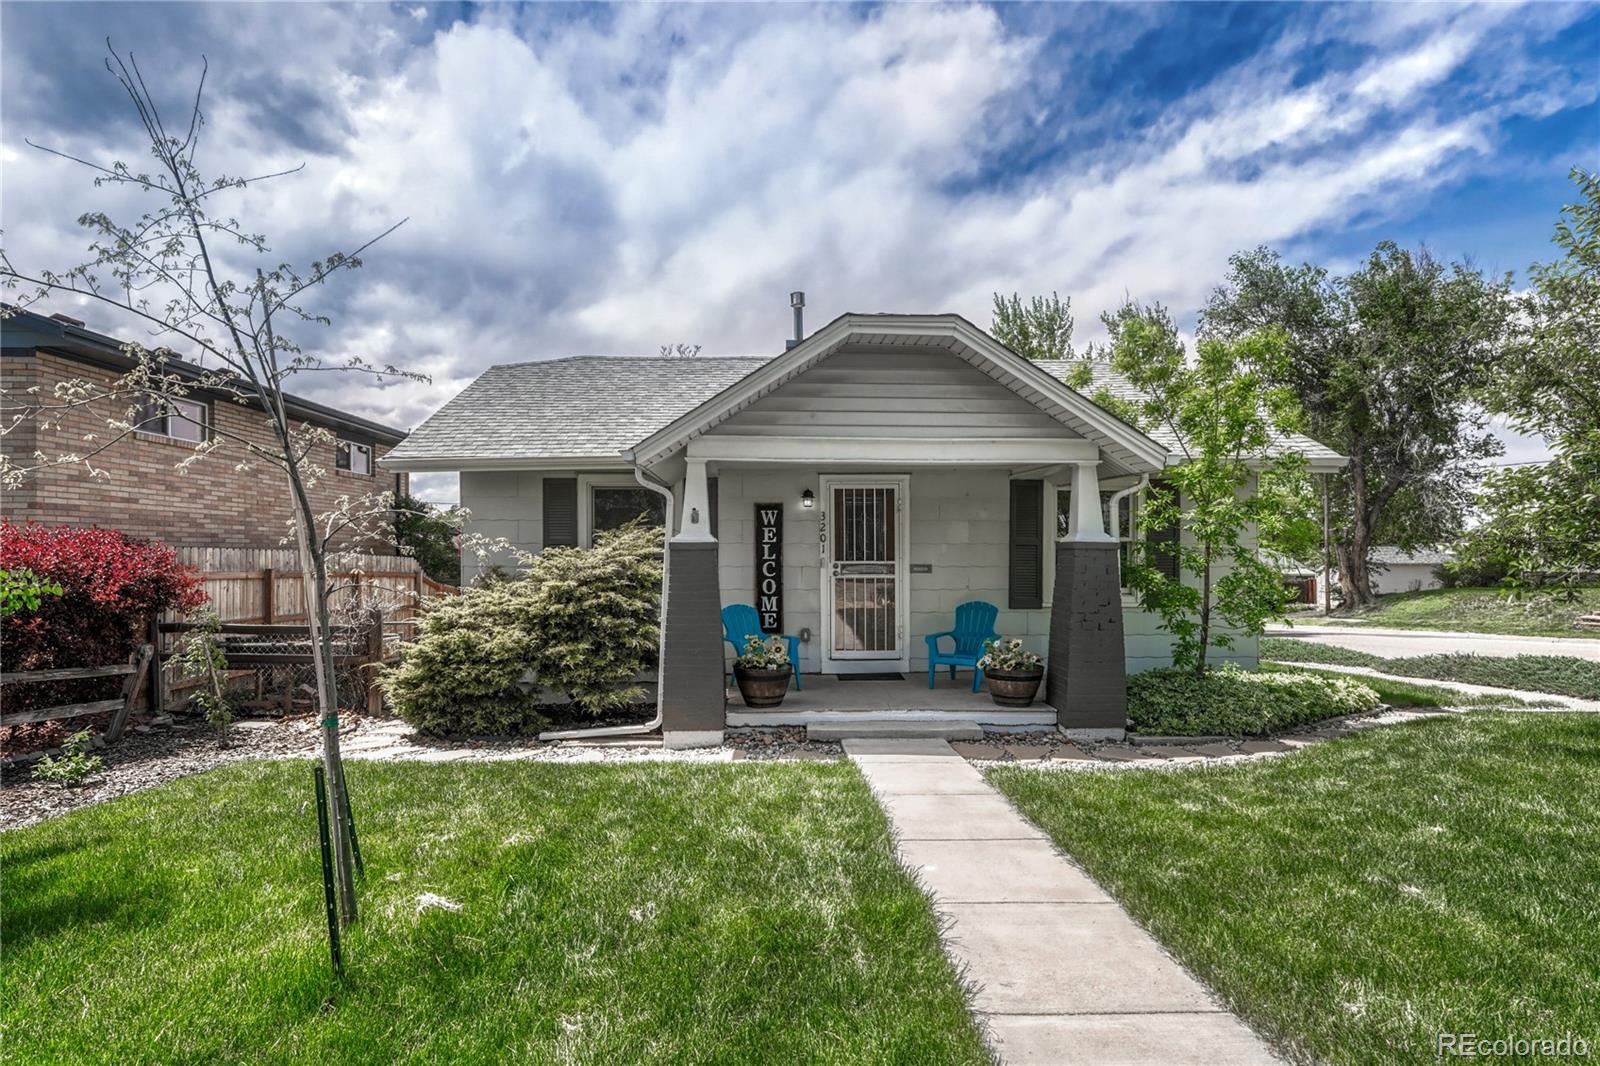
Active
$799,000
5
bds
|
3
ba
|
2,498
sqft
|
built
1940
3201 S Pearl St, Englewood, CO 80113
$-2,118
Cash flow
-13.8%
Cash-on-Cash Return
2.5%
Cap rate
0.4%
Rent to Value Ratio

Active
$552,000
3
bds
|
1
ba
|
1,632
sqft
|
built
1902
1111 E Dartmouth Ave, Englewood, CO 80113
$-598
Cash flow
-5.7%
Cash-on-Cash Return
4.4%
Cap rate
0.6%
Rent to Value Ratio
Active
$524,904
4
bds
|
2
ba
|
1,351
sqft
|
built
1950
2332 W Baltic Pl, Englewood, CO 80110
$-639
Cash flow
-6.4%
Cash-on-Cash Return
4.2%
Cap rate
0.6%
Rent to Value Ratio
Active
$695,000
3
bds
|
0
ba
|
0
sqft
|
built
1985
2000 W Iliff Ave, Englewood, CO 80110
$-1,315
Cash flow
-9.9%
Cash-on-Cash Return
3.4%
Cap rate
0.5%
Rent to Value Ratio
Active
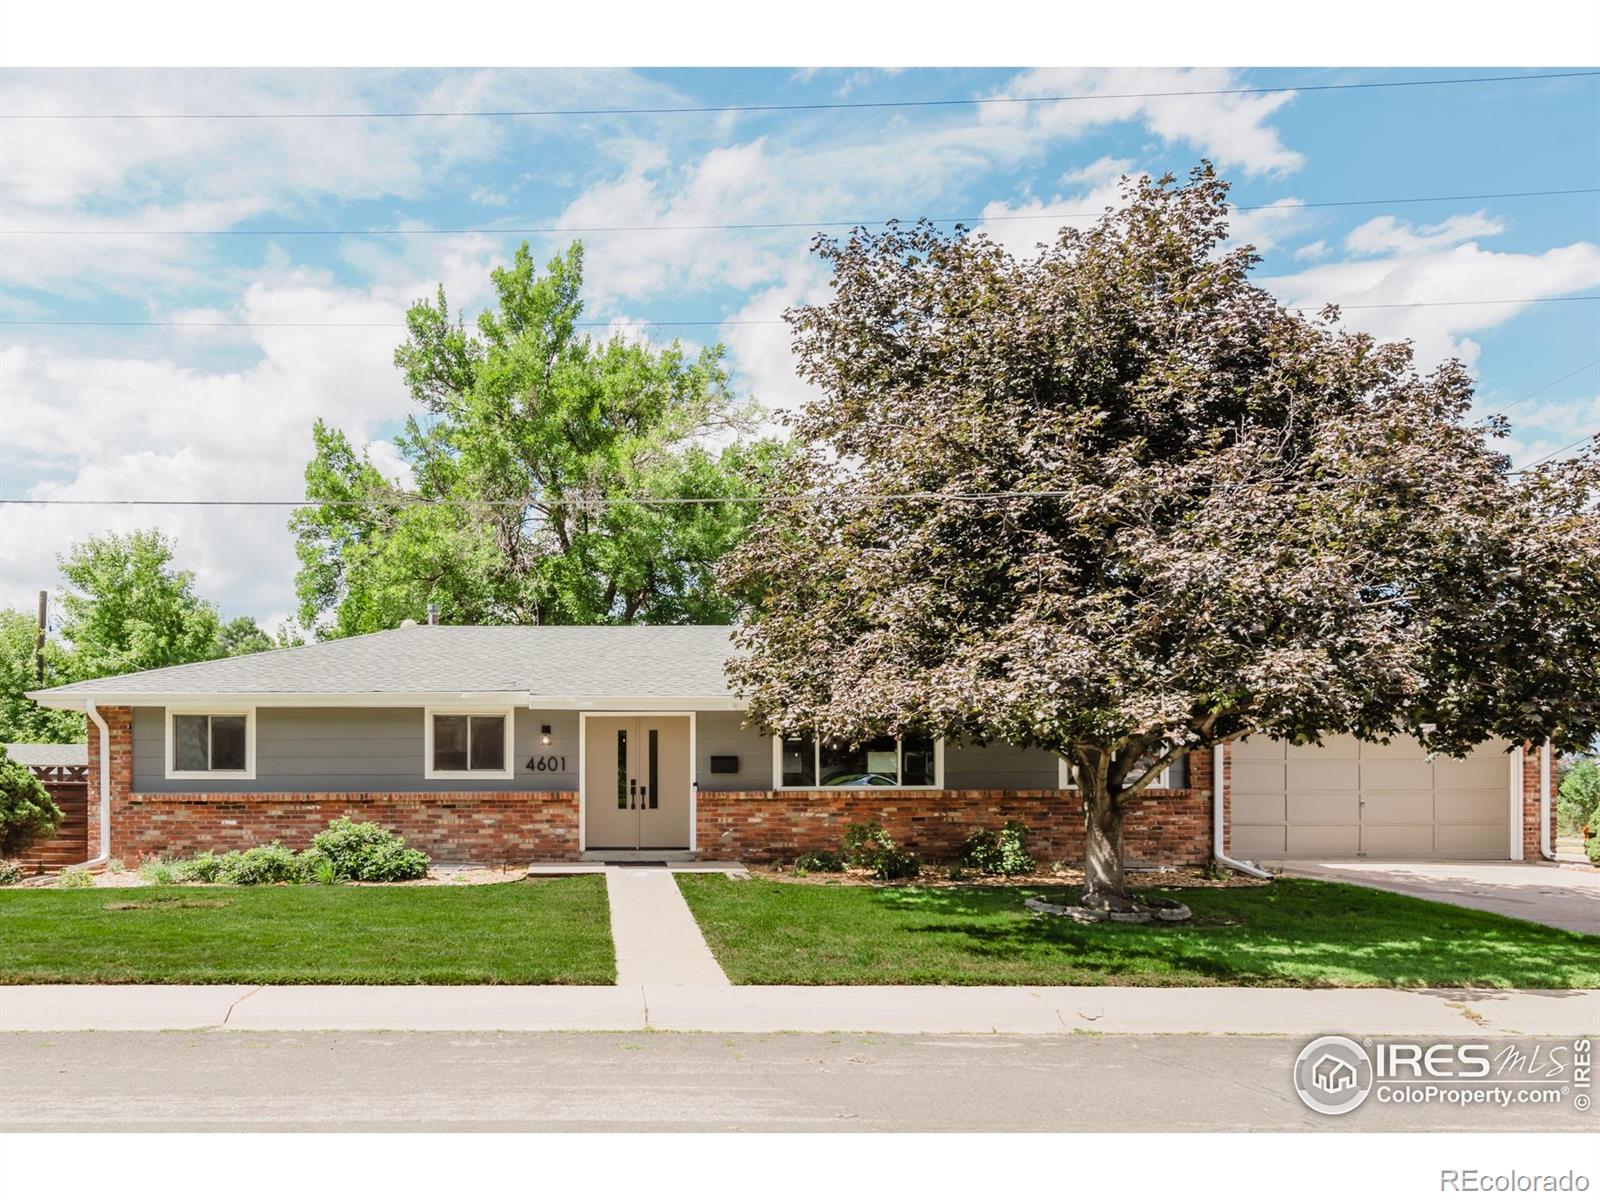
$835,000
5
bds
|
3
ba
|
3,136
sqft
|
built
1971
4601 S Lipan St, Englewood, CO 80110
$-1,089
Cash flow
-6.8%
Cash-on-Cash Return
4.1%
Cap rate
0.5%
Rent to Value Ratio
Active
$570,000
4
bds
|
2
ba
|
1,196
sqft
|
built
1937
601 W Layton Ave, Englewood, CO 80110
$-477
Cash flow
-4.4%
Cash-on-Cash Return
4.7%
Cap rate
0.6%
Rent to Value Ratio
Active
$3,375,000
6
bds
|
7
ba
|
6,396
sqft
|
built
1981
7 Cherry Hills Farm Dr, Englewood, CO 80113
$-13,933
Cash flow
-21.5%
Cash-on-Cash Return
0.7%
Cap rate
0.2%
Rent to Value Ratio
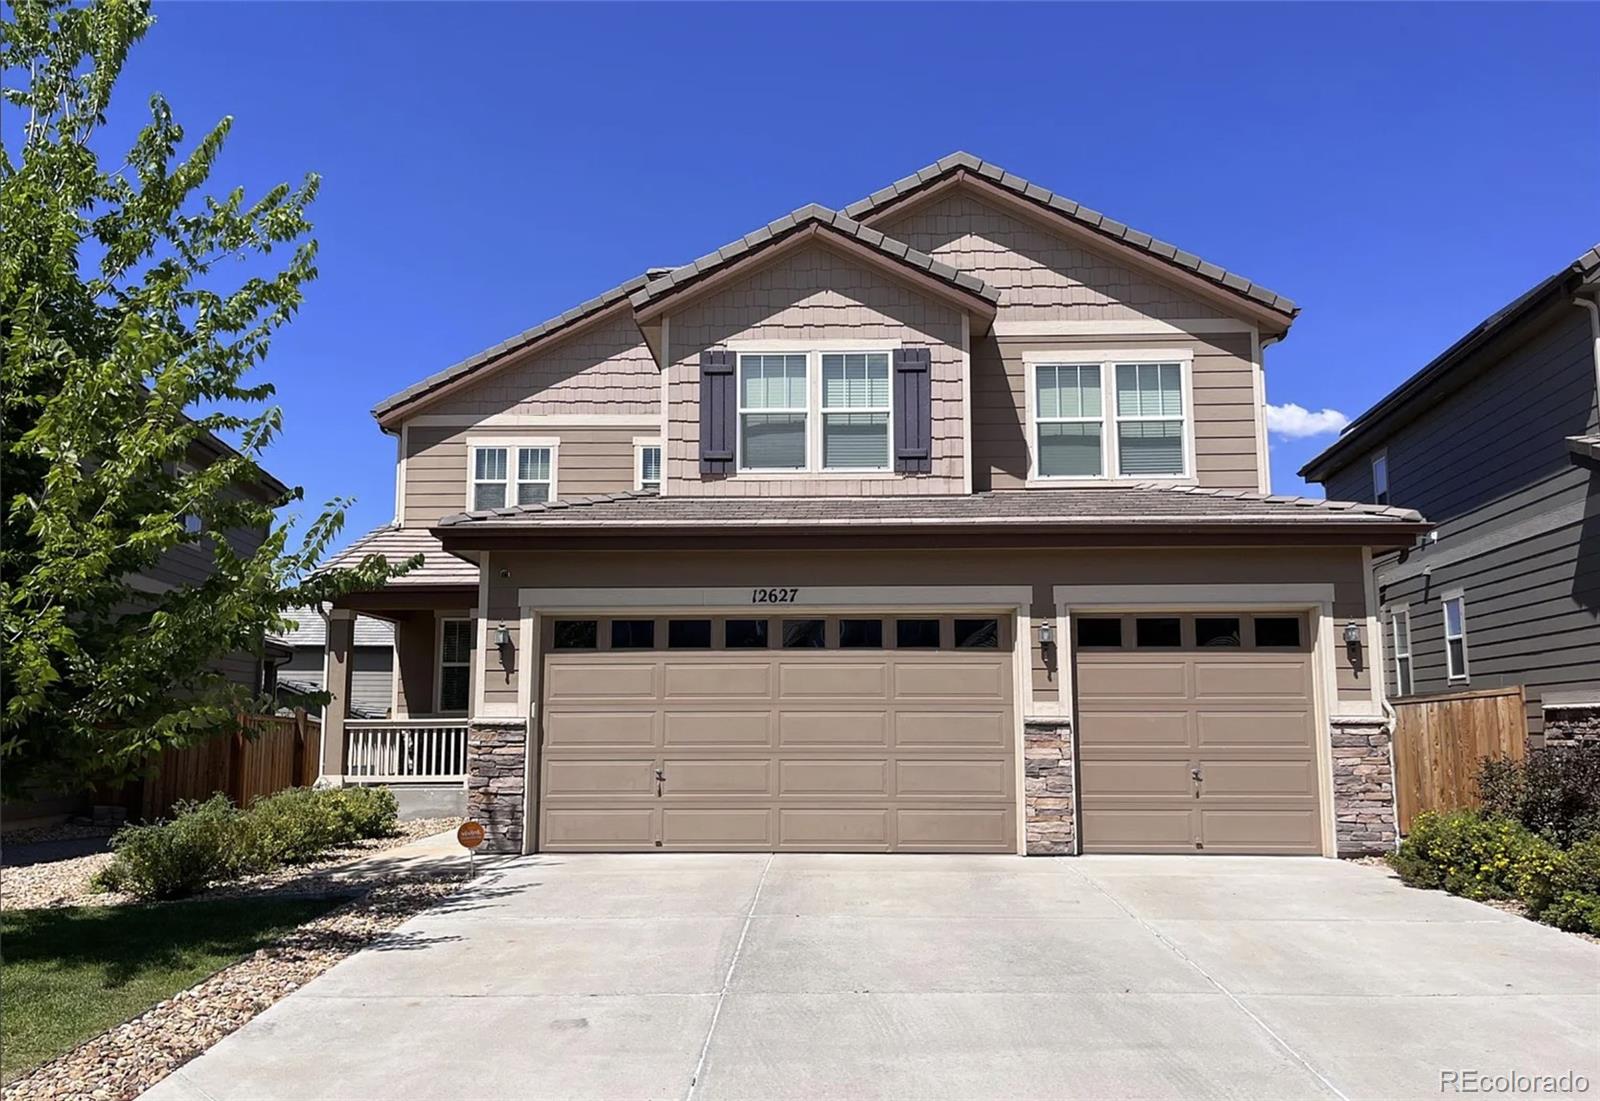
Active
$769,000
5
bds
|
4
ba
|
3,104
sqft
|
built
2015
12627 Fisher Dr, Englewood, CO 80112
$-1,726
Cash flow
-11.7%
Cash-on-Cash Return
3.0%
Cap rate
0.5%
Rent to Value Ratio

Active
$869,500
4
bds
|
3
ba
|
2,116
sqft
|
built
1979
6213 S Galena Way, Englewood, CO 80111
$-1,636
Cash flow
-9.8%
Cash-on-Cash Return
3.4%
Cap rate
0.5%
Rent to Value Ratio
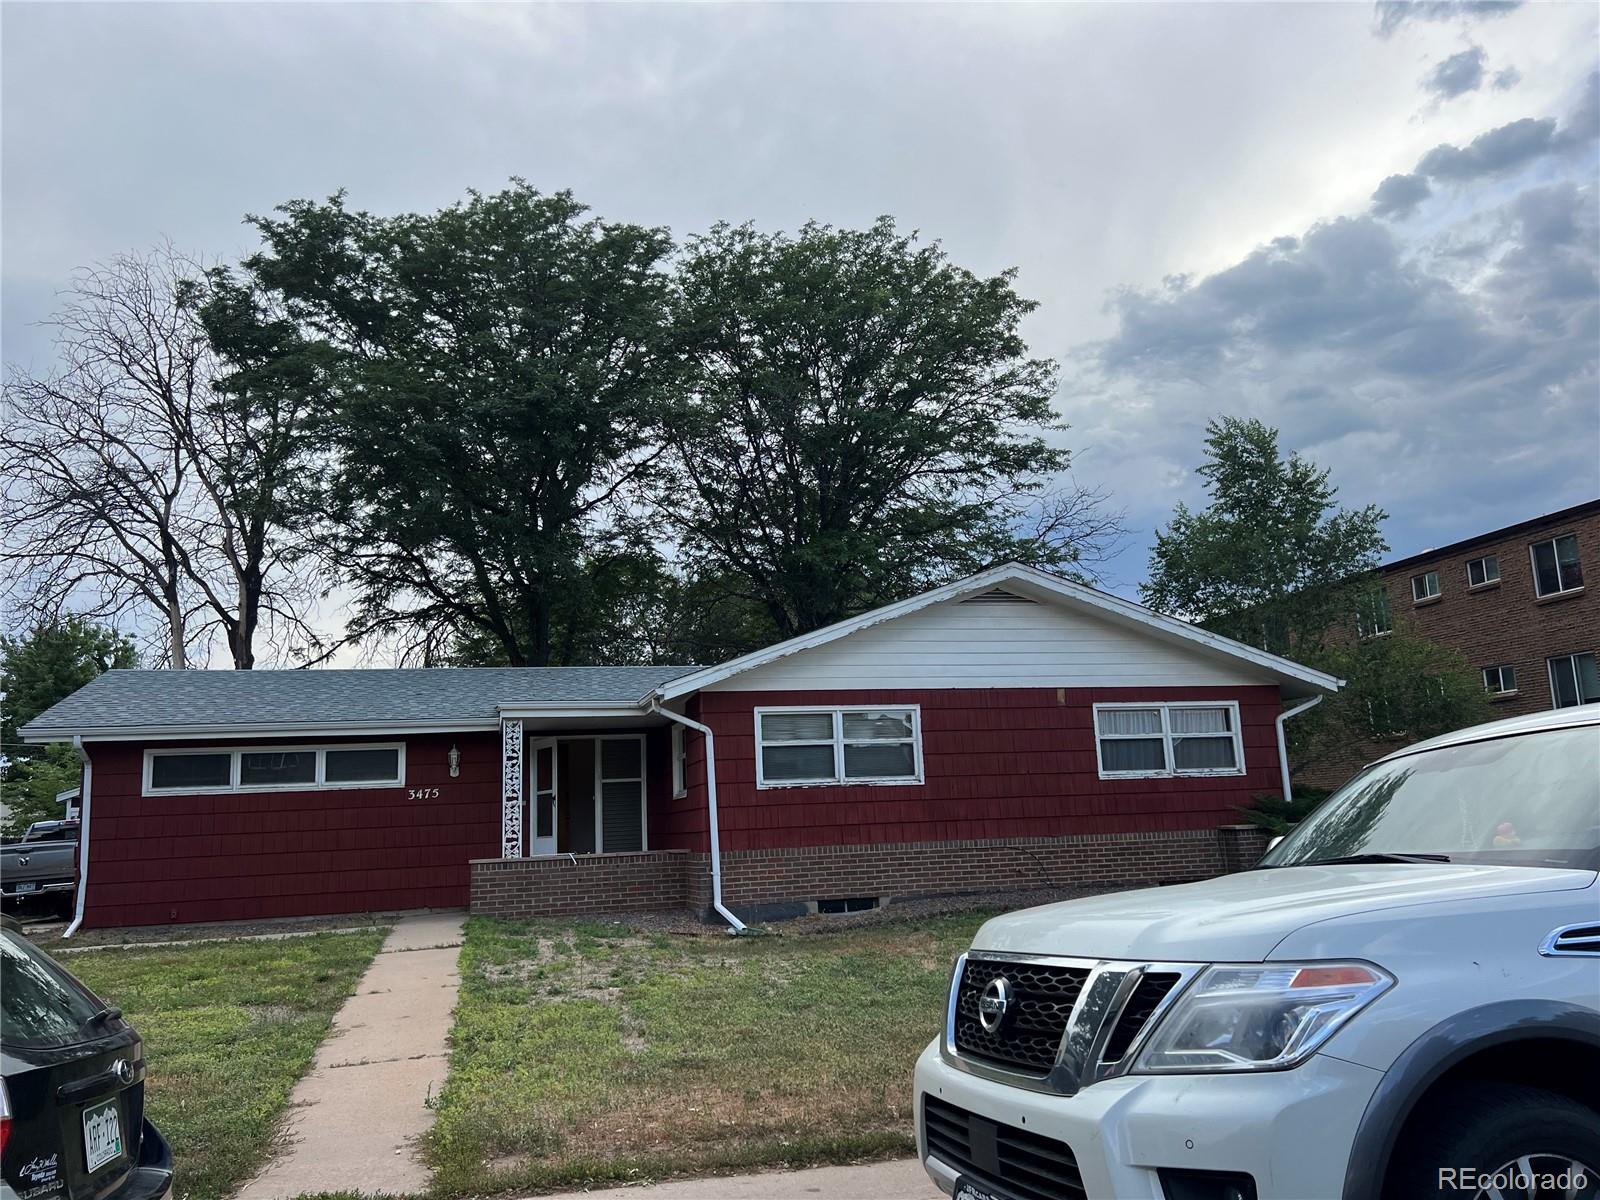
Active
$899,000
5
bds
|
2
ba
|
2,307
sqft
|
built
1960
3475 S Marion St, Englewood, CO 80113
$-2,513
Cash flow
-14.6%
Cash-on-Cash Return
2.3%
Cap rate
0.3%
Rent to Value Ratio
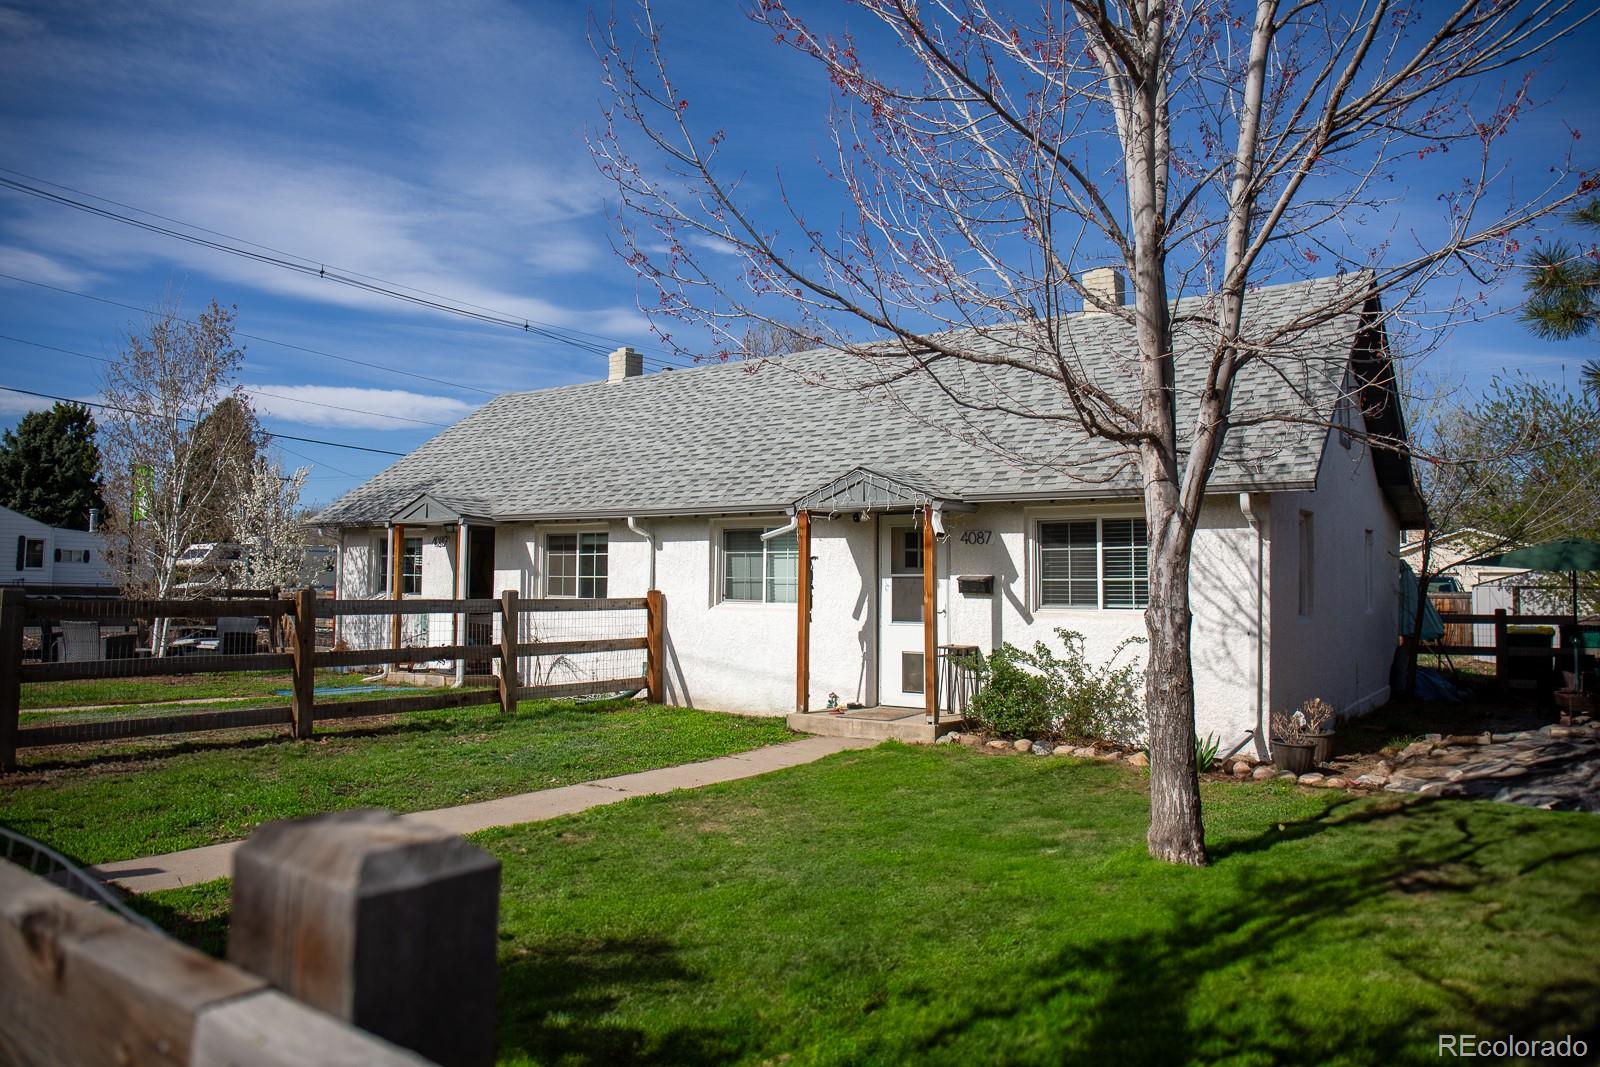
Active
$1,350,000
8
bds
|
4
ba
|
3,308
sqft
|
built
1931
4087 S Clarkson St, Englewood, CO 80113
$-5,627
Cash flow
-21.7%
Cash-on-Cash Return
0.7%
Cap rate
0.1%
Rent to Value Ratio
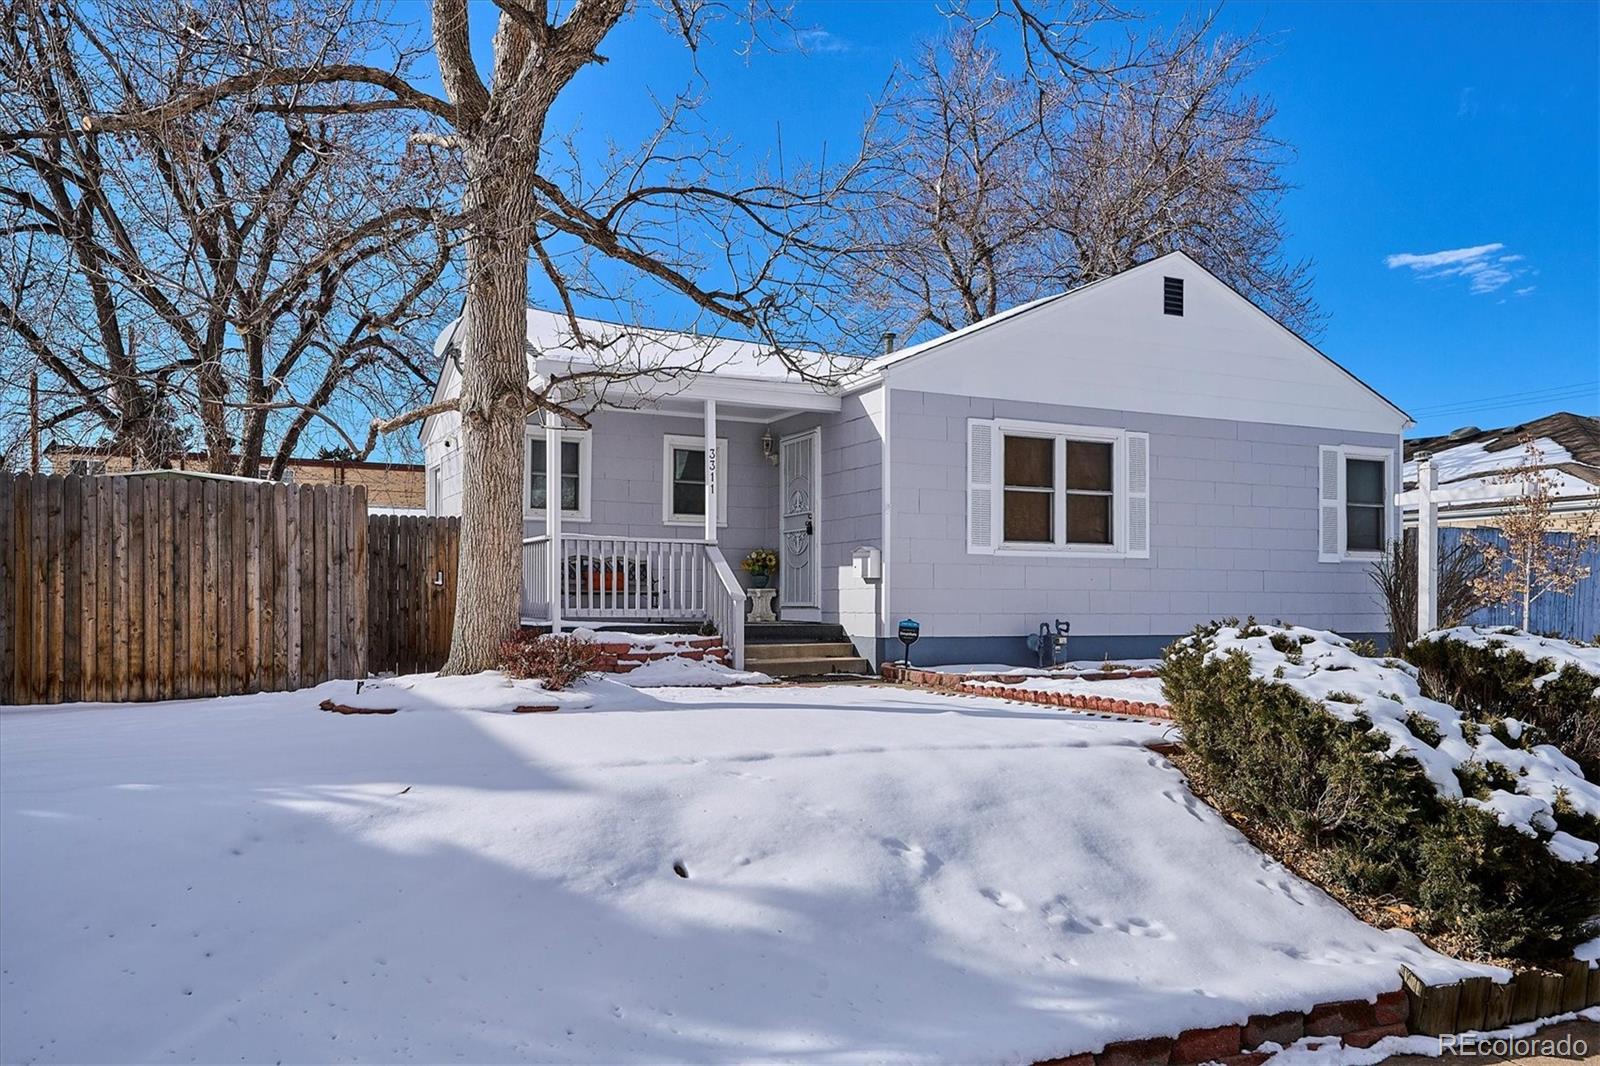
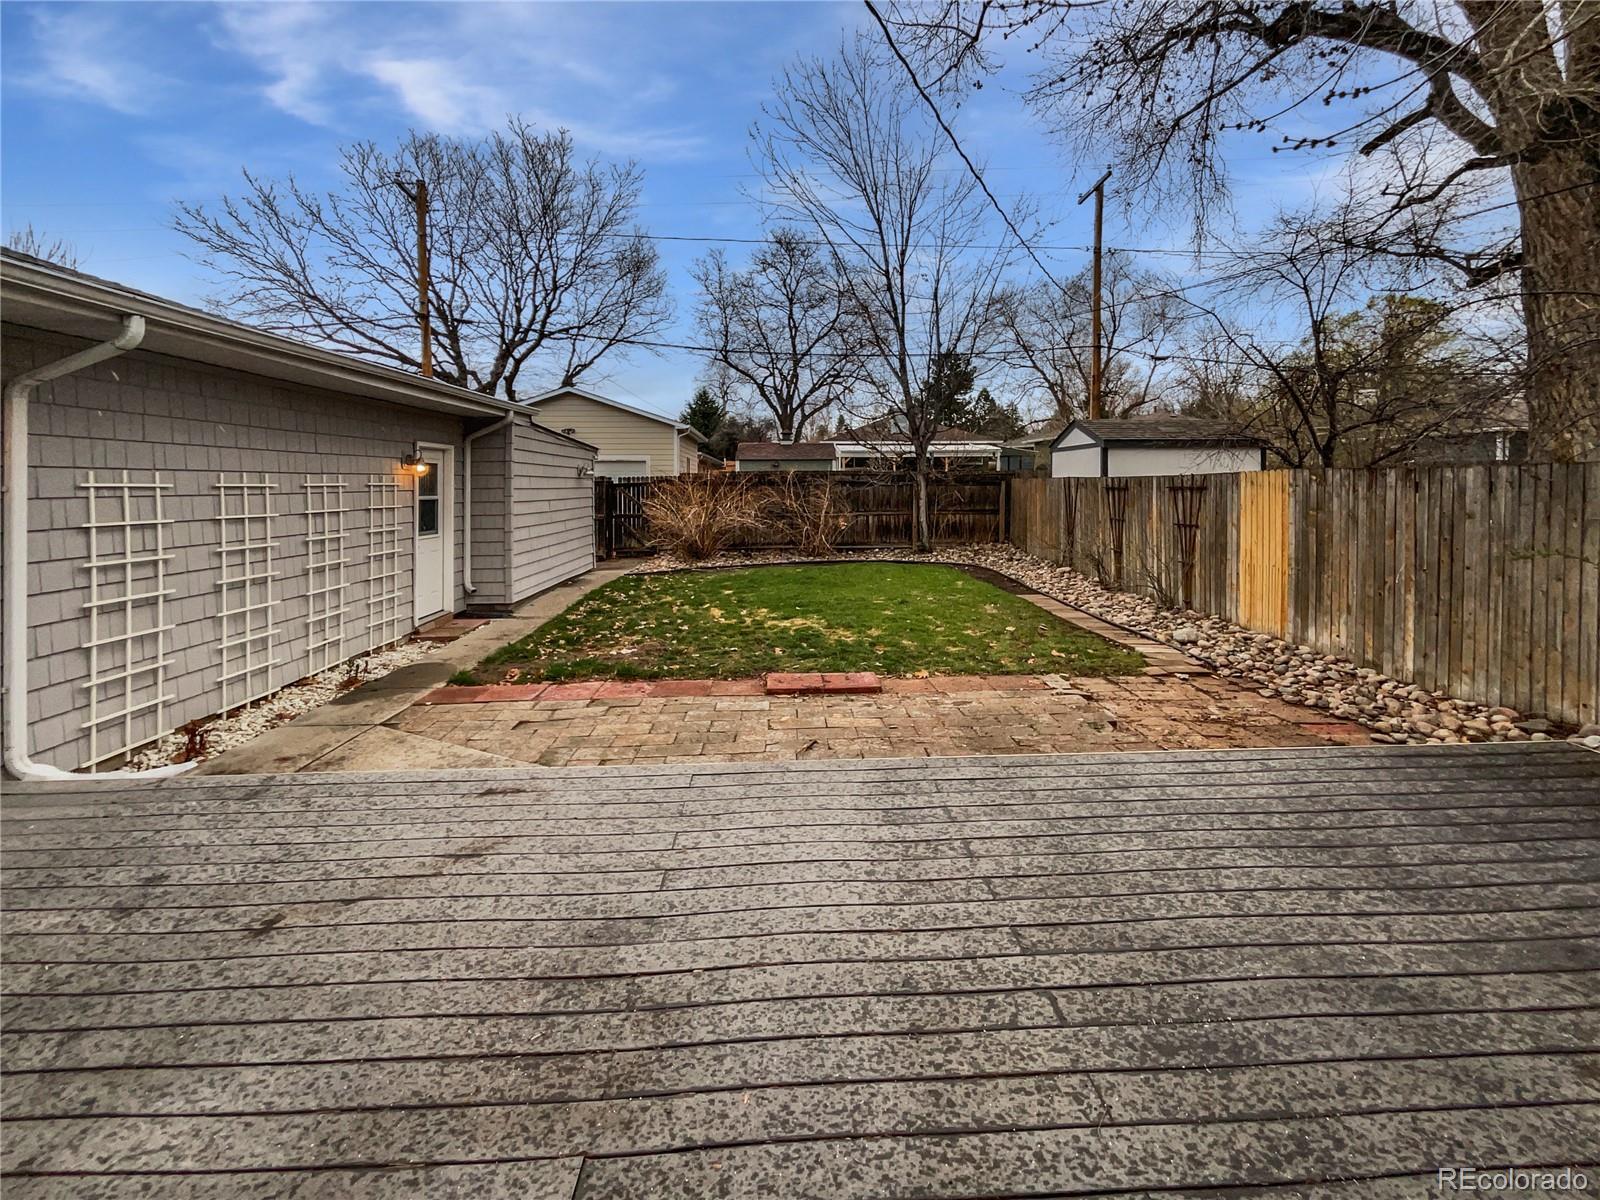
Active
$648,888
4
bds
|
2
ba
|
1,813
sqft
|
built
1910
3311 S Logan St, Englewood, CO 80113
$-1,581
Cash flow
-12.7%
Cash-on-Cash Return
2.8%
Cap rate
0.4%
Rent to Value Ratio
Active
$686,000
2
bds
|
2
ba
|
1,540
sqft
|
built
1963
2900 S Downing St, Englewood, CO 80113
$-1,408
Cash flow
-10.7%
Cash-on-Cash Return
3.2%
Cap rate
0.5%
Rent to Value Ratio
Active
$1,829,900
4
bds
|
3
ba
|
2,886
sqft
|
built
1967
4011 S Ivy Ln, Englewood, CO 80111
$-6,163
Cash flow
-17.6%
Cash-on-Cash Return
1.6%
Cap rate
0.3%
Rent to Value Ratio
Active
$350,000
2
bds
|
2
ba
|
1,095
sqft
|
built
1979
6485 S Havana St, Englewood, CO 80111
$-960
Cash flow
-14.3%
Cash-on-Cash Return
2.4%
Cap rate
0.6%
Rent to Value Ratio
Active
$2,075,000
5
bds
|
4
ba
|
3,734
sqft
|
built
1952
4600 S University Blvd, Englewood, CO 80113
$-6,742
Cash flow
-17.0%
Cash-on-Cash Return
1.8%
Cap rate
0.3%
Rent to Value Ratio
Active
$500,000
2
bds
|
1
ba
|
934
sqft
|
built
1931
3798 S Grant St, Englewood, CO 80113
$-1,032
Cash flow
-10.8%
Cash-on-Cash Return
3.2%
Cap rate
0.4%
Rent to Value Ratio
Active
$489,000
2
bds
|
2
ba
|
961
sqft
|
built
2020
3500 S Corona St, Englewood, CO 80113
$-1,186
Cash flow
-12.7%
Cash-on-Cash Return
2.8%
Cap rate
0.5%
Rent to Value Ratio