Englewood, CO Investment Properties for Sale
Browse homes for sale and investment properties in Englewood, CO. Refine your search by price, property type, or more.
Best cash flowing properties in Englewood, CO
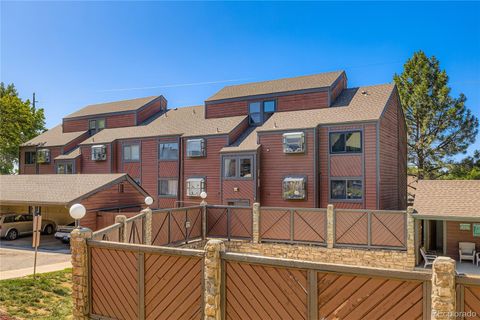
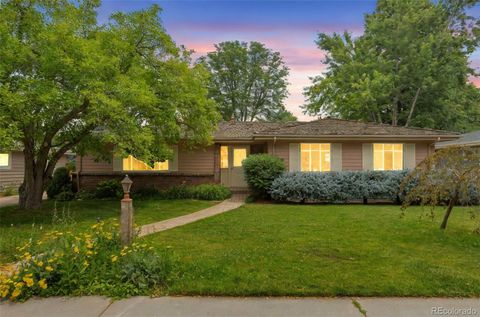
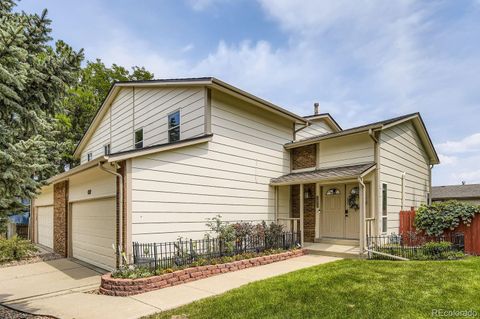
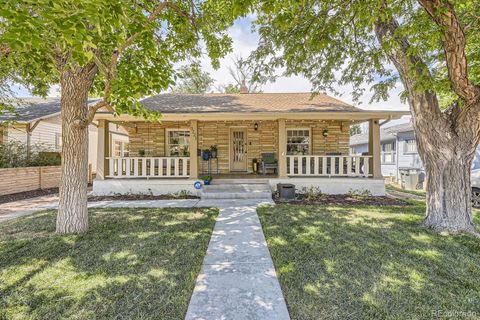
Active
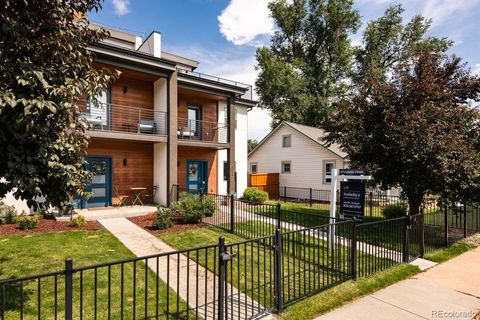
$280,000
3
bds
|
1
ba
|
1,004
sqft
|
built
1982
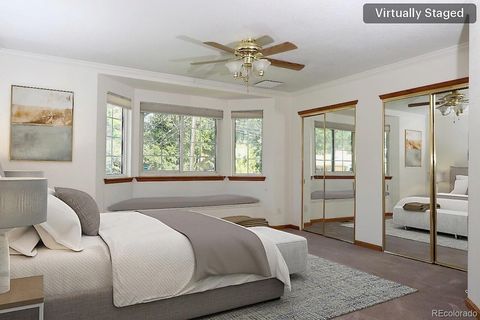
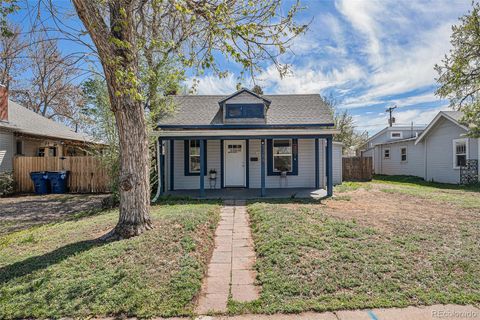
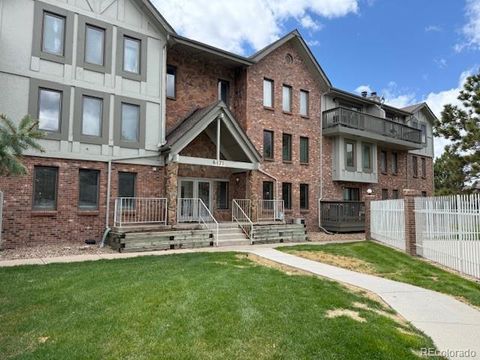
303 W Lehow Ave, Englewood, CO 80110
$-278
Cash flow
-5.2%
Cash-on-Cash Return
4.5%
Cap rate
0.8%
Rent to Value Ratio
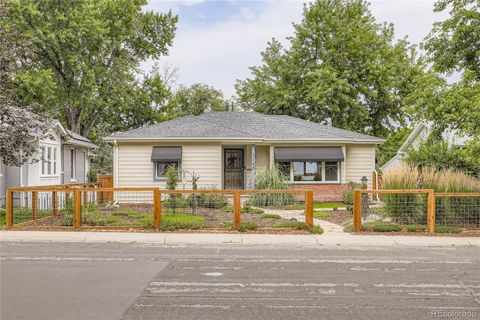
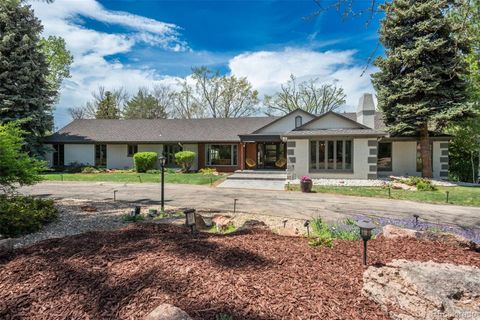
Active
$424,850
2
bds
|
1
ba
|
954
sqft
|
built
1940
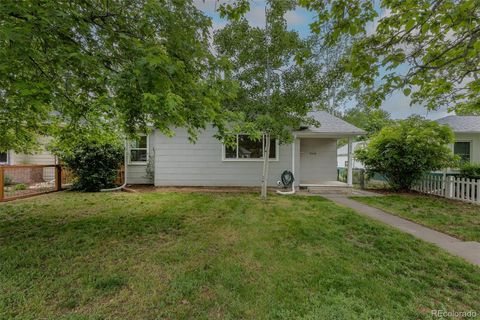
2995 S Bannock St, Englewood, CO 80110
$-410
Cash flow
-5.0%
Cash-on-Cash Return
4.5%
Cap rate
0.6%
Rent to Value Ratio
133 out of 150 properties for sale in Englewood, CO
Limited Results Shown
Create a free account, or log in to reveal all property listings and enjoy the complete experience.
Active
$557,000
2
bds
|
2
ba
|
978
sqft
|
built
1902
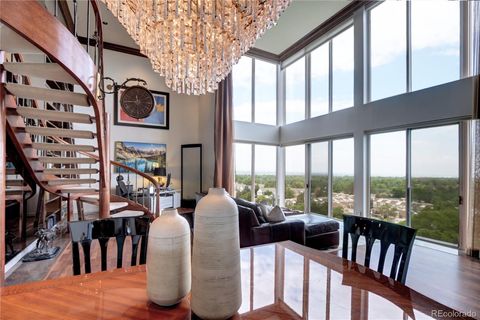
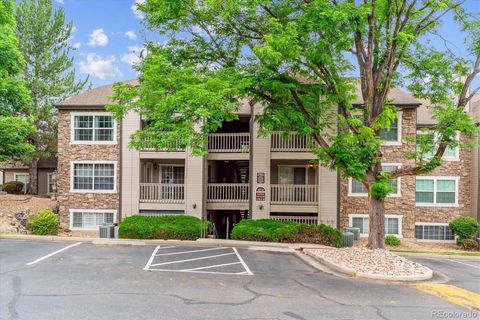
3024 S Sherman St, Englewood, CO 80113
$-835
Cash flow
-7.8%
Cash-on-Cash Return
3.9%
Cap rate
0.5%
Rent to Value Ratio
Active
$248,000
1
bds
|
1
ba
|
648
sqft
|
built
1984
4671 S Decatur St, Englewood, CO 80110
$-491
Cash flow
-10.3%
Cash-on-Cash Return
3.3%
Cap rate
0.6%
Rent to Value Ratio
Active
$1,025,000
4
bds
|
4
ba
|
2,312
sqft
|
built
2019
3522 S Ogden St, Englewood, CO 80113
$-2,147
Cash flow
-10.9%
Cash-on-Cash Return
3.2%
Cap rate
0.4%
Rent to Value Ratio
Active
$1,100,000
2
bds
|
3
ba
|
2,764
sqft
|
built
1982
1900 E Girard Pl, Englewood, CO 80113
$-5,336
Cash flow
-25.3%
Cash-on-Cash Return
-0.1%
Cap rate
0.3%
Rent to Value Ratio
Active
$382,500
2
bds
|
2
ba
|
1,228
sqft
|
built
2001
7889 S Kittredge Cir, Englewood, CO 80112
$-859
Cash flow
-11.7%
Cash-on-Cash Return
3.0%
Cap rate
0.6%
Rent to Value Ratio
Active
$380,000
2
bds
|
2
ba
|
1,228
sqft
|
built
2001
7751 S Kittredge Ct, Englewood, CO 80112
$-852
Cash flow
-11.7%
Cash-on-Cash Return
3.0%
Cap rate
0.6%
Rent to Value Ratio
Active
$750,000
3
bds
|
3
ba
|
2,820
sqft
|
built
1955
2309 E Floyd Pl, Englewood, CO 80113
$-1,423
Cash flow
-9.9%
Cash-on-Cash Return
3.4%
Cap rate
0.5%
Rent to Value Ratio
Active
$750,000
3
bds
|
2
ba
|
2,109
sqft
|
built
1951
3248 S Ogden St, Englewood, CO 80113
$-1,787
Cash flow
-12.4%
Cash-on-Cash Return
2.8%
Cap rate
0.4%
Rent to Value Ratio
Active
$313,000
1
bds
|
1
ba
|
866
sqft
|
built
2007
9079 E Panorama Cir, Englewood, CO 80112
$-696
Cash flow
-11.6%
Cash-on-Cash Return
3.0%
Cap rate
0.6%
Rent to Value Ratio
Active
$835,000
3
bds
|
2
ba
|
1,924
sqft
|
built
1949
1350 E Amherst Ave, Englewood, CO 80113
$-1,831
Cash flow
-11.4%
Cash-on-Cash Return
3.0%
Cap rate
0.4%
Rent to Value Ratio
Active
$649,999
3
bds
|
2
ba
|
1,388
sqft
|
built
1993
3100 S Corona St, Englewood, CO 80113
$-1,172
Cash flow
-9.4%
Cash-on-Cash Return
3.5%
Cap rate
0.5%
Rent to Value Ratio
Active
$455,000
2
bds
|
1
ba
|
1,260
sqft
|
built
1915
3768 S Acoma St, Englewood, CO 80110
$-607
Cash flow
-7.0%
Cash-on-Cash Return
4.1%
Cap rate
0.5%
Rent to Value Ratio
Active
$859,000
2
bds
|
4
ba
|
2,505
sqft
|
built
1982
1900 E Girard Pl, Englewood, CO 80113
$-4,559
Cash flow
-27.7%
Cash-on-Cash Return
-0.7%
Cap rate
0.4%
Rent to Value Ratio
Active
$645,000
2
bds
|
2
ba
|
1,387
sqft
|
built
2008
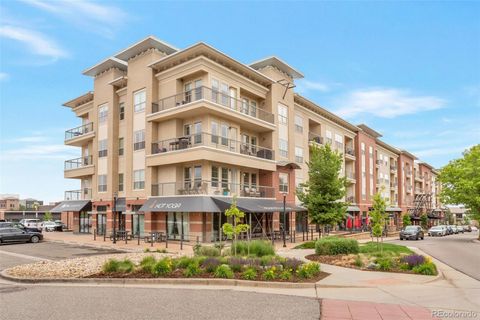
10111 Inverness Main St, Englewood, CO 80112
$-1,722
Cash flow
-13.9%
Cash-on-Cash Return
2.5%
Cap rate
0.5%
Rent to Value Ratio
Active
$829,000
4
bds
|
4
ba
|
2,760
sqft
|
built
1979
10724 E Maplewood Pl, Englewood, CO 80111
$-1,991
Cash flow
-12.5%
Cash-on-Cash Return
2.8%
Cap rate
0.4%
Rent to Value Ratio
Active
$1,350,000
8
bds
|
4
ba
|
3,308
sqft
|
built
1931
4087 S Clarkson St, Englewood, CO 80113
$-5,627
Cash flow
-21.7%
Cash-on-Cash Return
0.7%
Cap rate
0.1%
Rent to Value Ratio
Active
$648,888
4
bds
|
2
ba
|
1,813
sqft
|
built
1910
3311 S Logan St, Englewood, CO 80113
$-1,581
Cash flow
-12.7%
Cash-on-Cash Return
2.8%
Cap rate
0.4%
Rent to Value Ratio
Active
$899,000
5
bds
|
2
ba
|
2,307
sqft
|
built
1960
3475 S Marion St, Englewood, CO 80113
$-2,513
Cash flow
-14.6%
Cash-on-Cash Return
2.3%
Cap rate
0.3%
Rent to Value Ratio
Active
$340,000
3
bds
|
2
ba
|
1,352
sqft
|
built
2006
8489 Canyon Rim Cir, Englewood, CO 80112
$-641
Cash flow
-9.8%
Cash-on-Cash Return
3.4%
Cap rate
0.6%
Rent to Value Ratio
Active
$470,000
4
bds
|
3
ba
|
1,590
sqft
|
built
2000
7951 S Kittredge Way, Englewood, CO 80112
$-1,187
Cash flow
-13.2%
Cash-on-Cash Return
2.6%
Cap rate
0.5%
Rent to Value Ratio
Active
$485,000
2
bds
|
2
ba
|
944
sqft
|
built
1946
4280 S Lincoln St, Englewood, CO 80113
$-679
Cash flow
-7.3%
Cash-on-Cash Return
4.0%
Cap rate
0.5%
Rent to Value Ratio
Active
$385,000
2
bds
|
1
ba
|
720
sqft
|
built
1955
4055 S Hazel Ct, Englewood, CO 80110
$-531
Cash flow
-7.2%
Cash-on-Cash Return
4.0%
Cap rate
0.6%
Rent to Value Ratio
Active
$648,900
4
bds
|
4
ba
|
2,325
sqft
|
built
1976
5630 S Lansing Way, Englewood, CO 80111
$-1,254
Cash flow
-10.1%
Cash-on-Cash Return
3.4%
Cap rate
0.5%
Rent to Value Ratio
Active
$1,650,000
4
bds
|
3
ba
|
2,921
sqft
|
built
1966
5850 S Happy Canyon Dr, Englewood, CO 80111
$-5,033
Cash flow
-15.9%
Cash-on-Cash Return
2.0%
Cap rate
0.3%
Rent to Value Ratio
Active
$850,000
5
bds
|
3
ba
|
2,398
sqft
|
built
1966
2201 E Floyd Ave, Englewood, CO 80113
$-1,731
Cash flow
-10.6%
Cash-on-Cash Return
3.2%
Cap rate
0.5%
Rent to Value Ratio
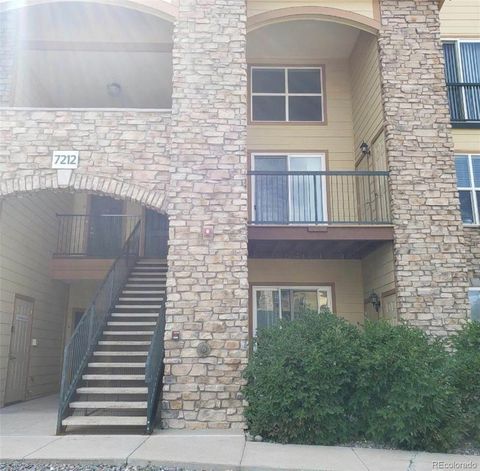
Active
$300,000
1
bds
|
1
ba
|
942
sqft
|
built
2006
7212 S Blackhawk St, Englewood, CO 80112
$-682
Cash flow
-11.9%
Cash-on-Cash Return
3.0%
Cap rate
0.6%
Rent to Value Ratio
Active
$670,000
4
bds
|
3
ba
|
1,478
sqft
|
built
1915
3221 S Grant St, Englewood, CO 80113
$-1,298
Cash flow
-10.1%
Cash-on-Cash Return
3.4%
Cap rate
0.5%
Rent to Value Ratio
Active
$3,095,000
6
bds
|
6
ba
|
6,183
sqft
|
built
1971
4285 S Hudson Pkwy, Englewood, CO 80113
$-12,021
Cash flow
-20.3%
Cash-on-Cash Return
1.0%
Cap rate
0.2%
Rent to Value Ratio
Active
$429,900
4
bds
|
1
ba
|
1,260
sqft
|
built
1956
3685 S Hooker St, Englewood, CO 80110
$-525
Cash flow
-6.4%
Cash-on-Cash Return
4.2%
Cap rate
0.6%
Rent to Value Ratio
Active
$420,000
3
bds
|
1
ba
|
837
sqft
|
built
1965
4210 S Dale Ct, Englewood, CO 80110
$-719
Cash flow
-8.9%
Cash-on-Cash Return
3.6%
Cap rate
0.5%
Rent to Value Ratio
Active
$420,000
3
bds
|
3
ba
|
1,771
sqft
|
built
1988
6475 S Dayton St, Englewood, CO 80111
$-1,061
Cash flow
-13.2%
Cash-on-Cash Return
2.6%
Cap rate
0.6%
Rent to Value Ratio
Active
$520,000
3
bds
|
2
ba
|
2,214
sqft
|
built
1951
4051 S Cherokee St, Englewood, CO 80110
$-562
Cash flow
-5.6%
Cash-on-Cash Return
4.4%
Cap rate
0.6%
Rent to Value Ratio
Active
$649,999
4
bds
|
2
ba
|
1,680
sqft
|
built
1953
3256 S Ogden St, Englewood, CO 80113
$-1,360
Cash flow
-10.9%
Cash-on-Cash Return
3.2%
Cap rate
0.4%
Rent to Value Ratio
Active
$264,999
1
bds
|
1
ba
|
697
sqft
|
built
1987
9212 E Arbor Cir, Englewood, CO 80111
$-511
Cash flow
-10.1%
Cash-on-Cash Return
3.4%
Cap rate
0.6%
Rent to Value Ratio
Active
$410,000
2
bds
|
2
ba
|
1,105
sqft
|
built
2014
303 Inverness Way S, Englewood, CO 80112
$-992
Cash flow
-12.6%
Cash-on-Cash Return
2.8%
Cap rate
0.6%
Rent to Value Ratio
Active
$545,000
4
bds
|
2
ba
|
1,628
sqft
|
built
1937
3140 W Girard Ave, Englewood, CO 80110
$-1,190
Cash flow
-11.4%
Cash-on-Cash Return
3.1%
Cap rate
0.4%
Rent to Value Ratio
Active
$575,000
4
bds
|
3
ba
|
2,240
sqft
|
built
1959
2904 W Chenango Ave, Englewood, CO 80110
$-891
Cash flow
-8.1%
Cash-on-Cash Return
3.8%
Cap rate
0.5%
Rent to Value Ratio
Active
$985,000
5
bds
|
4
ba
|
3,745
sqft
|
built
1982
6180 S Jamaica Ct, Englewood, CO 80111
$-2,524
Cash flow
-13.4%
Cash-on-Cash Return
2.6%
Cap rate
0.4%
Rent to Value Ratio