Englewood, CO Investment Properties for Sale
Browse homes for sale and investment properties in Englewood, CO. Refine your search by price, property type, or more.
Best cash flowing properties in Englewood, CO
Active
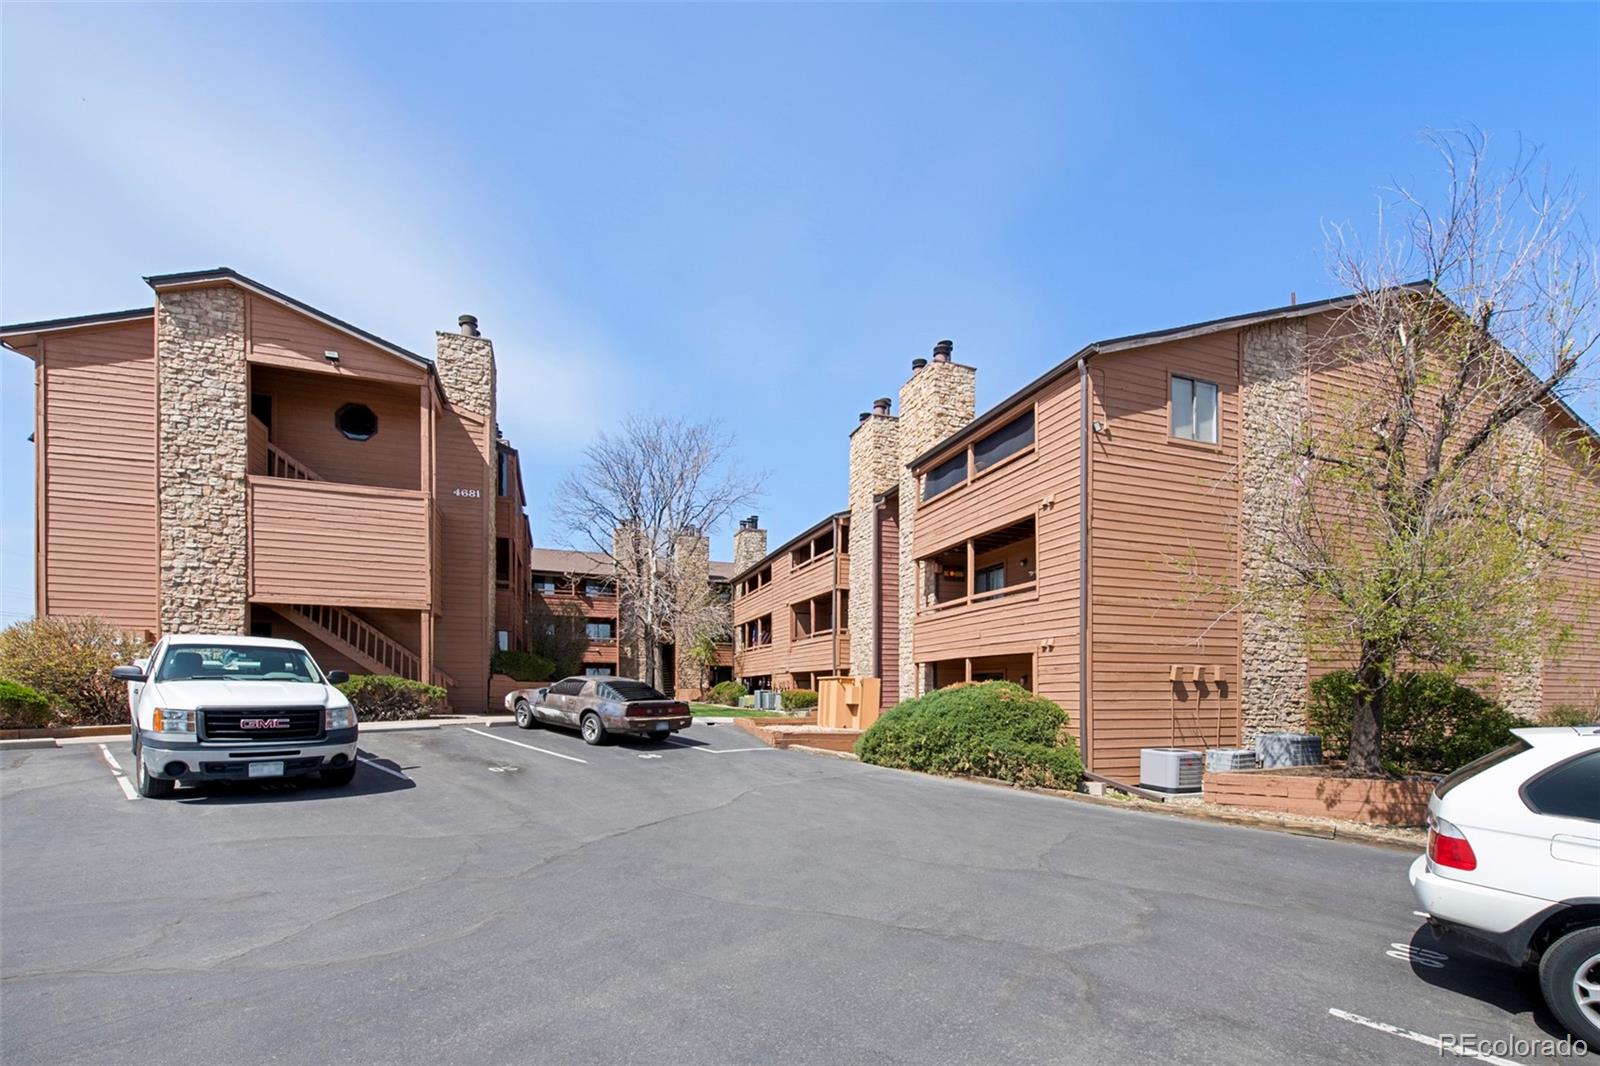
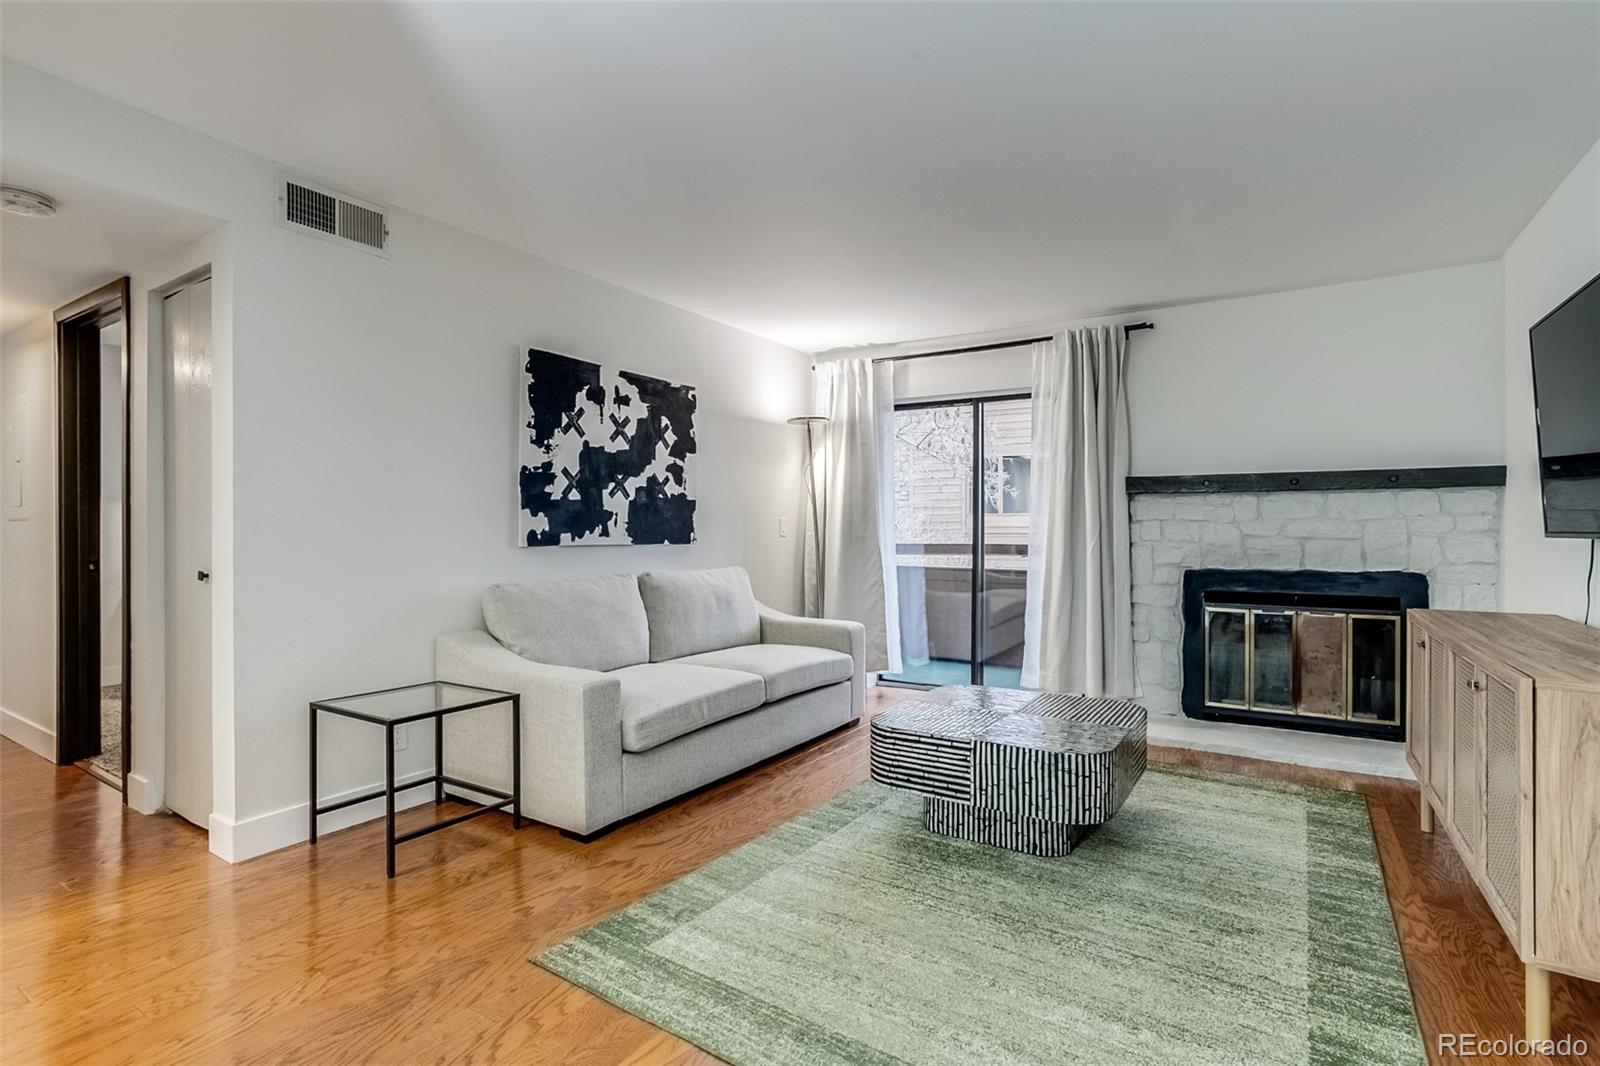
$220,000
1
bds
|
1
ba
|
648
sqft
|
built
1984
4681 S Decatur St, Englewood, CO 80110
$-393
Cash flow
-9.3%
Cash-on-Cash Return
4.1%
Cap rate
0.7%
Rent to Value Ratio
Active
$248,000
1
bds
|
1
ba
|
648
sqft
|
built
1984
4671 S Decatur St, Englewood, CO 80110
$-616
Cash flow
-13.0%
Cash-on-Cash Return
3.3%
Cap rate
0.6%
Rent to Value Ratio
220 out of 251 properties for sale in Englewood, CO
Limited Results Shown
Create a free account, or log in to reveal all property listings and enjoy the complete experience.
Active
$575,000
4
bds
|
2
ba
|
2,564
sqft
|
built
1963
4960 S Fox St, Englewood, CO 80110
$-1,107
Cash flow
-10.0%
Cash-on-Cash Return
4.0%
Cap rate
0.5%
Rent to Value Ratio
Active
$567,000
2
bds
|
2
ba
|
978
sqft
|
built
1902
3024 S Sherman St, Englewood, CO 80113
$-1,168
Cash flow
-10.7%
Cash-on-Cash Return
3.8%
Cap rate
0.5%
Rent to Value Ratio
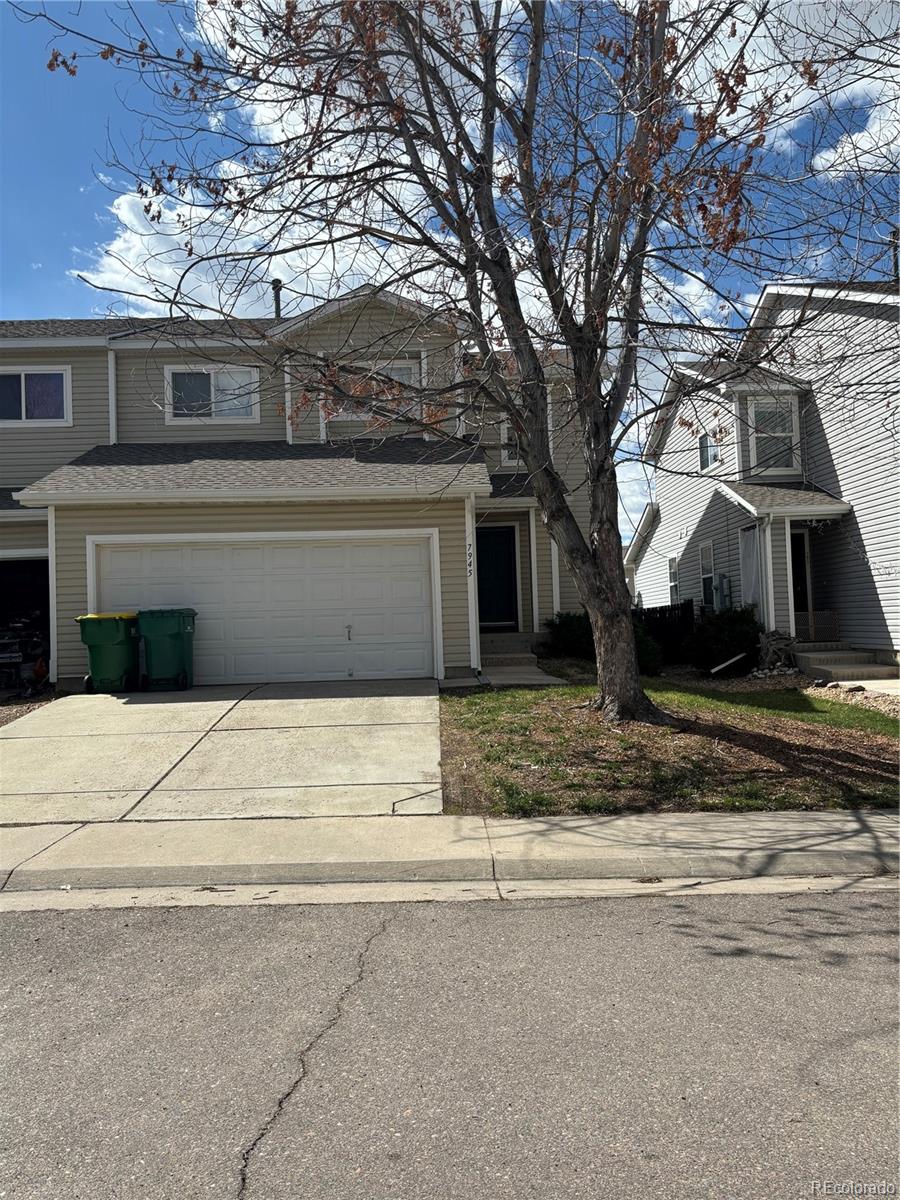
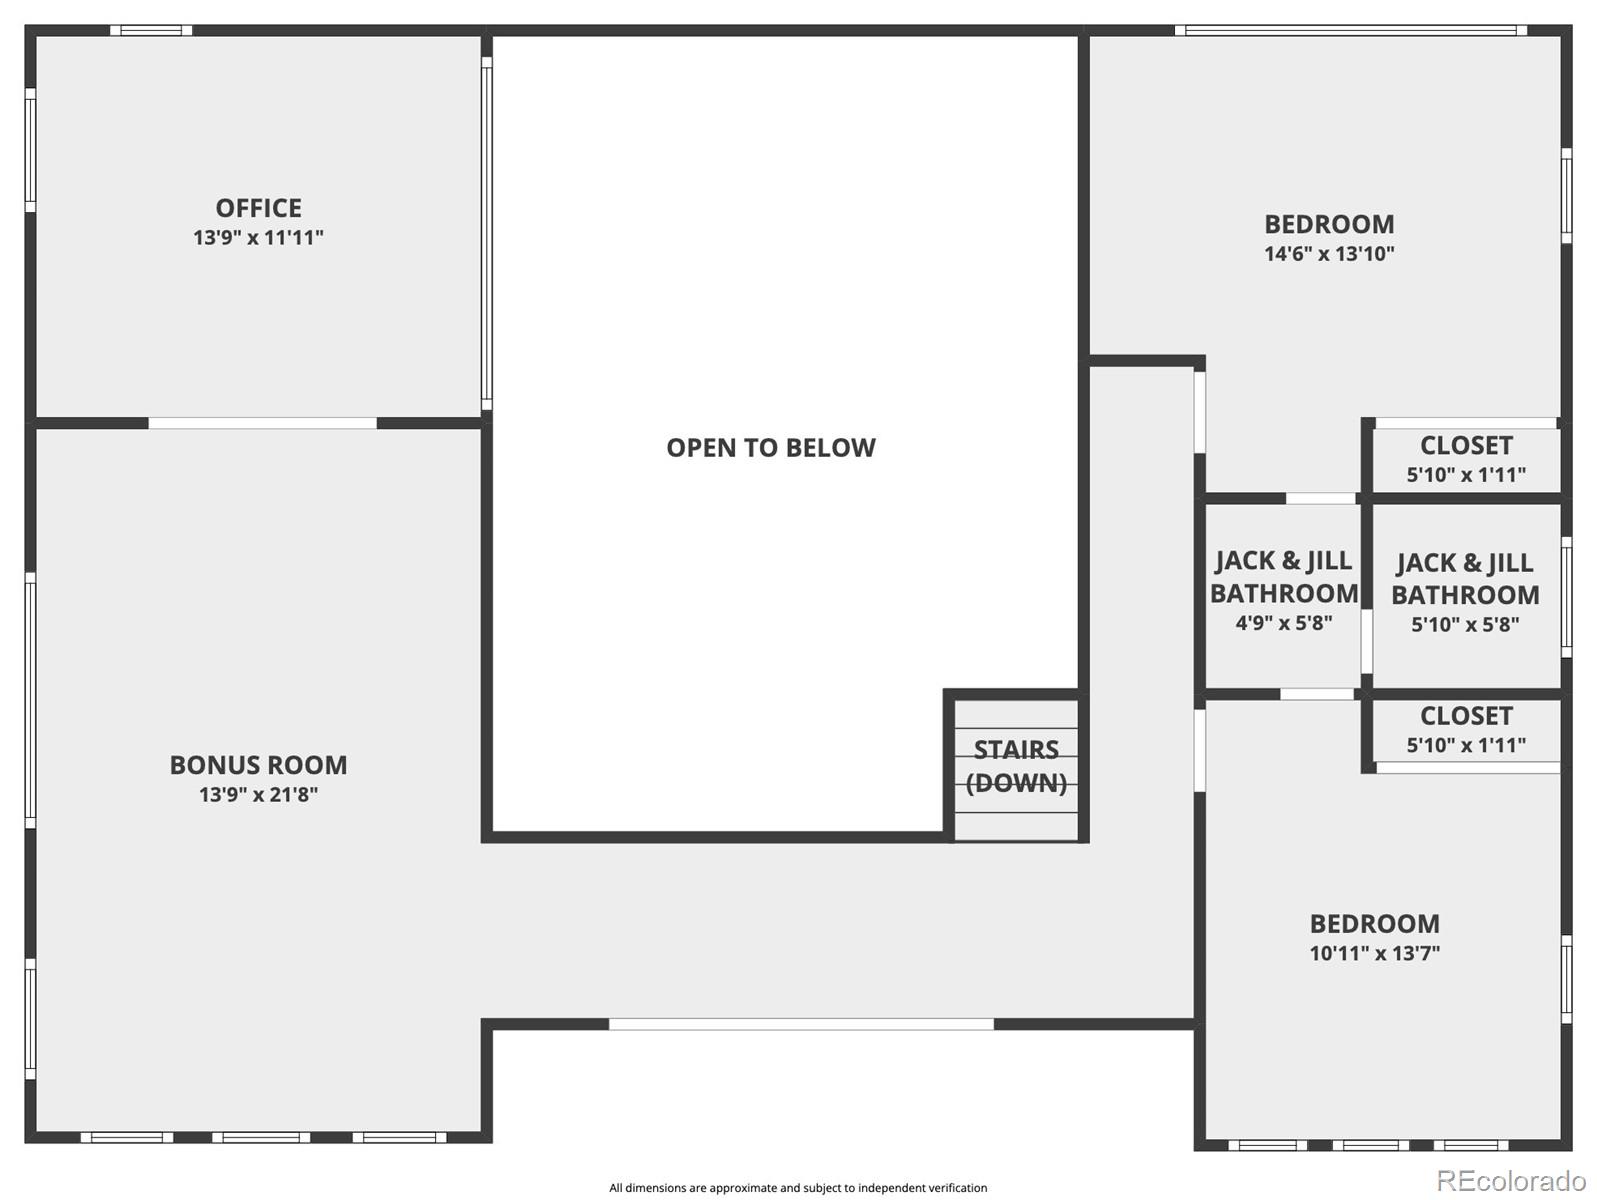
Active
$473,400
3
bds
|
3
ba
|
1,599
sqft
|
built
2000
7945 S Kittredge St, Englewood, CO 80112
$-1,087
Cash flow
-12.0%
Cash-on-Cash Return
3.5%
Cap rate
0.5%
Rent to Value Ratio
Active
$220,000
1
bds
|
1
ba
|
648
sqft
|
built
1984
4681 S Decatur St, Englewood, CO 80110
$-393
Cash flow
-9.3%
Cash-on-Cash Return
4.1%
Cap rate
0.7%
Rent to Value Ratio
Active
$1,999,998
8
bds
|
7
ba
|
6,088
sqft
|
built
2022
4960 S Lipan Dr, Englewood, CO 80110
$-4,364
Cash flow
-11.4%
Cash-on-Cash Return
3.7%
Cap rate
0.5%
Rent to Value Ratio
Active
$248,000
1
bds
|
1
ba
|
648
sqft
|
built
1984
4671 S Decatur St, Englewood, CO 80110
$-616
Cash flow
-13.0%
Cash-on-Cash Return
3.3%
Cap rate
0.6%
Rent to Value Ratio
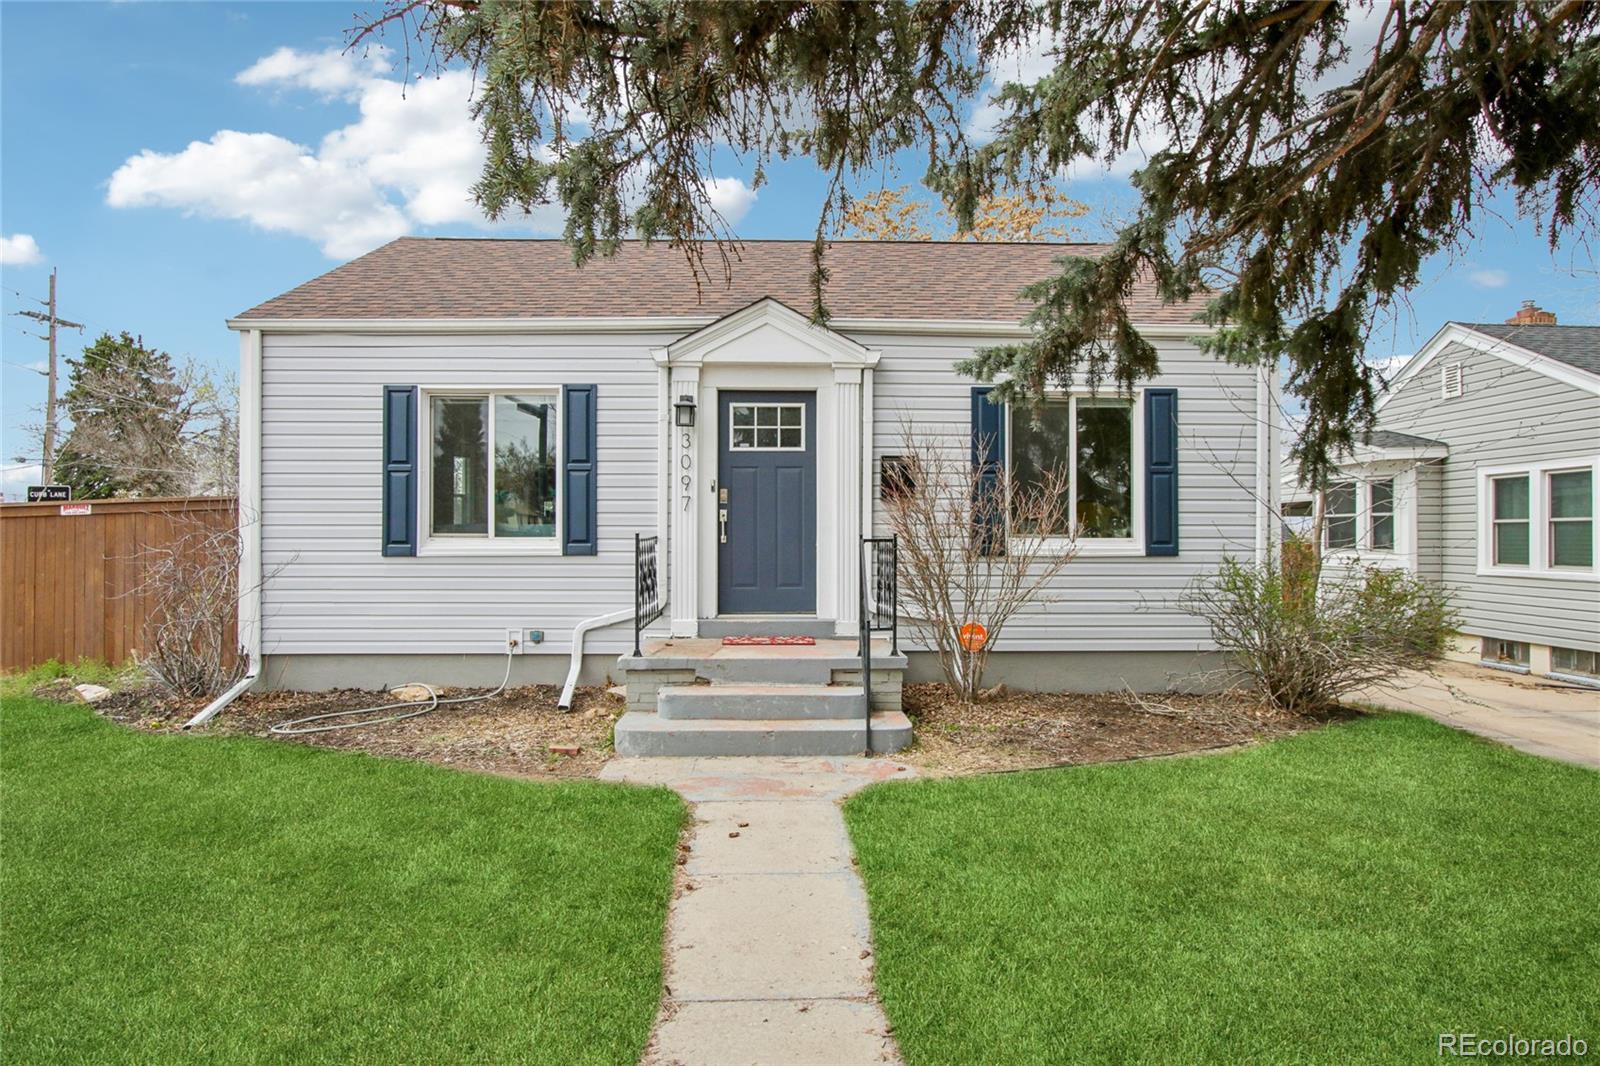
Active
$615,000
4
bds
|
2
ba
|
1,714
sqft
|
built
1927
3097 S Logan St, Englewood, CO 80113
$-1,358
Cash flow
-11.5%
Cash-on-Cash Return
3.6%
Cap rate
0.5%
Rent to Value Ratio
Active
$749,900
4
bds
|
3
ba
|
2,196
sqft
|
built
1978
6417 S Florence Way, Englewood, CO 80111
$-1,816
Cash flow
-12.6%
Cash-on-Cash Return
3.4%
Cap rate
0.5%
Rent to Value Ratio

Active
$2,290,000
5
bds
|
4
ba
|
3,886
sqft
|
built
1969
5880 S Happy Canyon Dr, Englewood, CO 80111
$-8,987
Cash flow
-20.5%
Cash-on-Cash Return
1.6%
Cap rate
0.2%
Rent to Value Ratio

Active
$1,025,000
4
bds
|
4
ba
|
2,312
sqft
|
built
2019
3522 S Ogden St, Englewood, CO 80113
$-2,664
Cash flow
-13.6%
Cash-on-Cash Return
3.2%
Cap rate
0.4%
Rent to Value Ratio
Active
$675,000
2
bds
|
3
ba
|
1,987
sqft
|
built
1982
1900 E Girard Pl, Englewood, CO 80113
$-3,326
Cash flow
-25.7%
Cash-on-Cash Return
0.4%
Cap rate
0.5%
Rent to Value Ratio
Active
$290,000
1
bds
|
1
ba
|
702
sqft
|
built
1994
8621 E Dry Creek Rd, Englewood, CO 80112
$-910
Cash flow
-16.4%
Cash-on-Cash Return
2.5%
Cap rate
0.6%
Rent to Value Ratio

Active under contract
$725,000
4
bds
|
3
ba
|
2,281
sqft
|
built
1962
295 E Amherst Ave, Englewood, CO 80113
$-1,651
Cash flow
-11.9%
Cash-on-Cash Return
3.6%
Cap rate
0.5%
Rent to Value Ratio
Active
$450,000
2
bds
|
2
ba
|
1,255
sqft
|
built
2015
301 Inverness Way S, Englewood, CO 80112
$-1,225
Cash flow
-14.2%
Cash-on-Cash Return
3.0%
Cap rate
0.6%
Rent to Value Ratio
Active under contract
$386,000
2
bds
|
2
ba
|
1,634
sqft
|
built
1982
1900 E Girard Pl, Englewood, CO 80113
$-1,724
Cash flow
-23.3%
Cash-on-Cash Return
0.9%
Cap rate
0.6%
Rent to Value Ratio
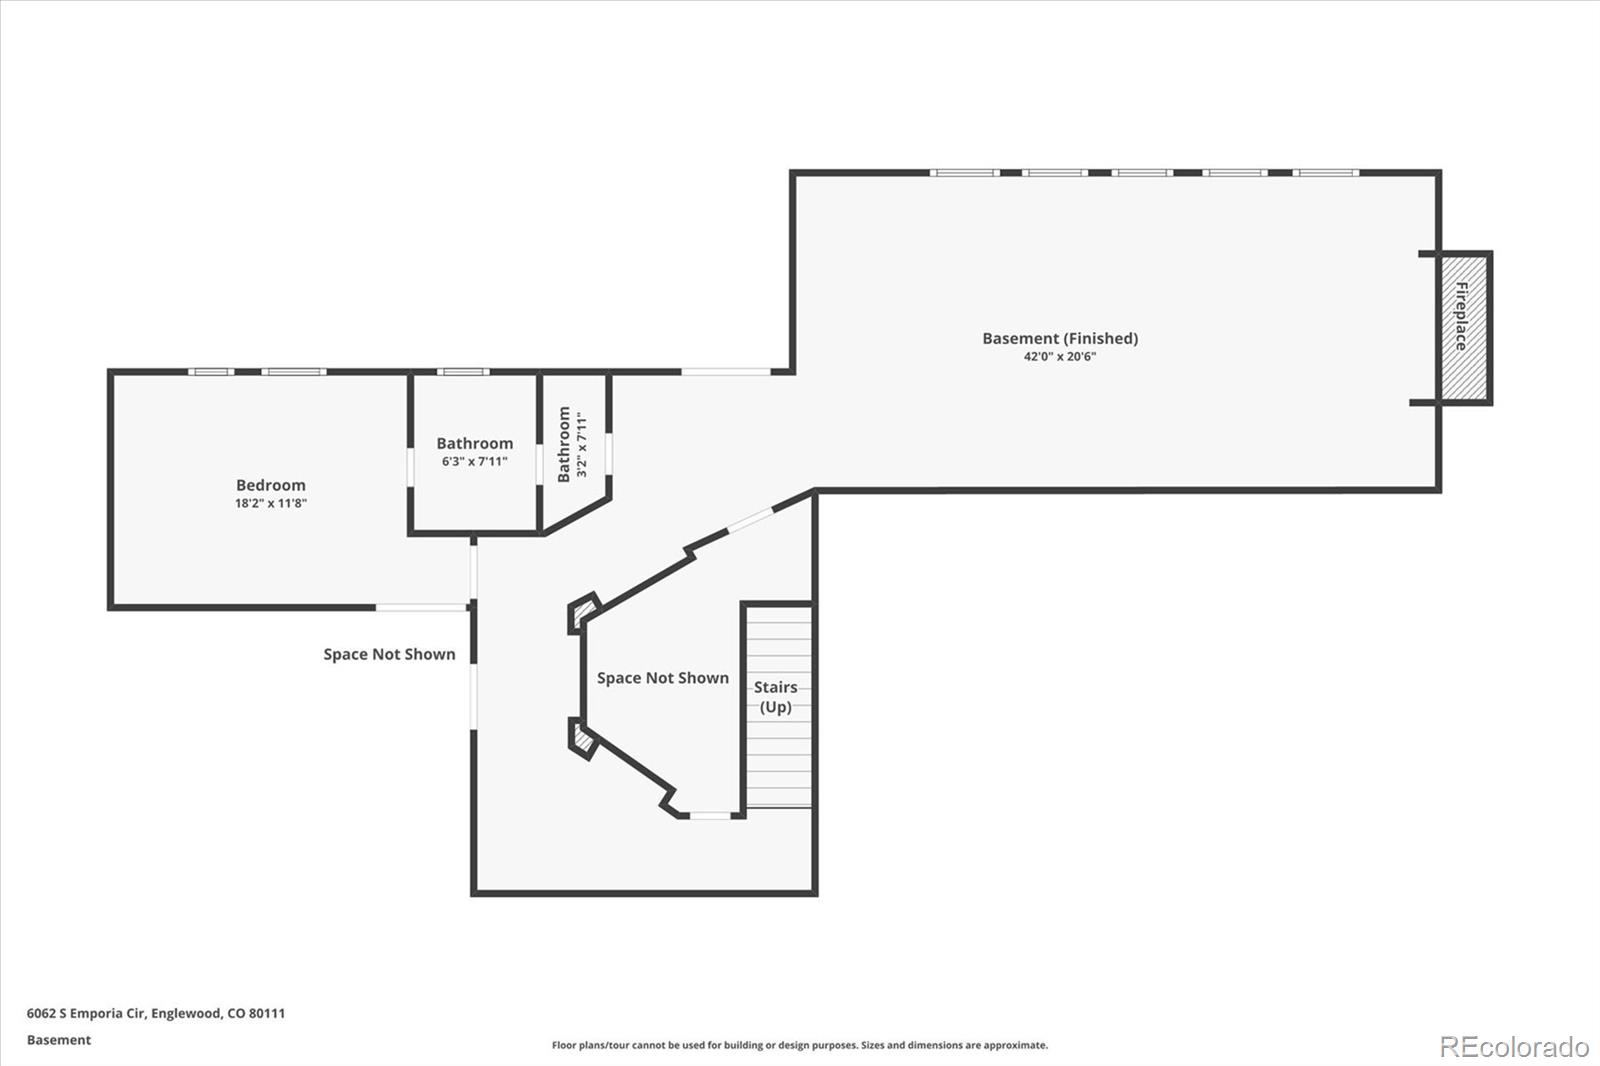
Active
$1,242,000
5
bds
|
4
ba
|
4,190
sqft
|
built
1981
6062 S Emporia Cir, Englewood, CO 80111
$-4,192
Cash flow
-17.6%
Cash-on-Cash Return
2.2%
Cap rate
0.4%
Rent to Value Ratio

Active
$359,900
1
bds
|
1
ba
|
1,023
sqft
|
built
2009
307 Inverness Way S, Englewood, CO 80112
$-988
Cash flow
-14.3%
Cash-on-Cash Return
3.0%
Cap rate
0.6%
Rent to Value Ratio
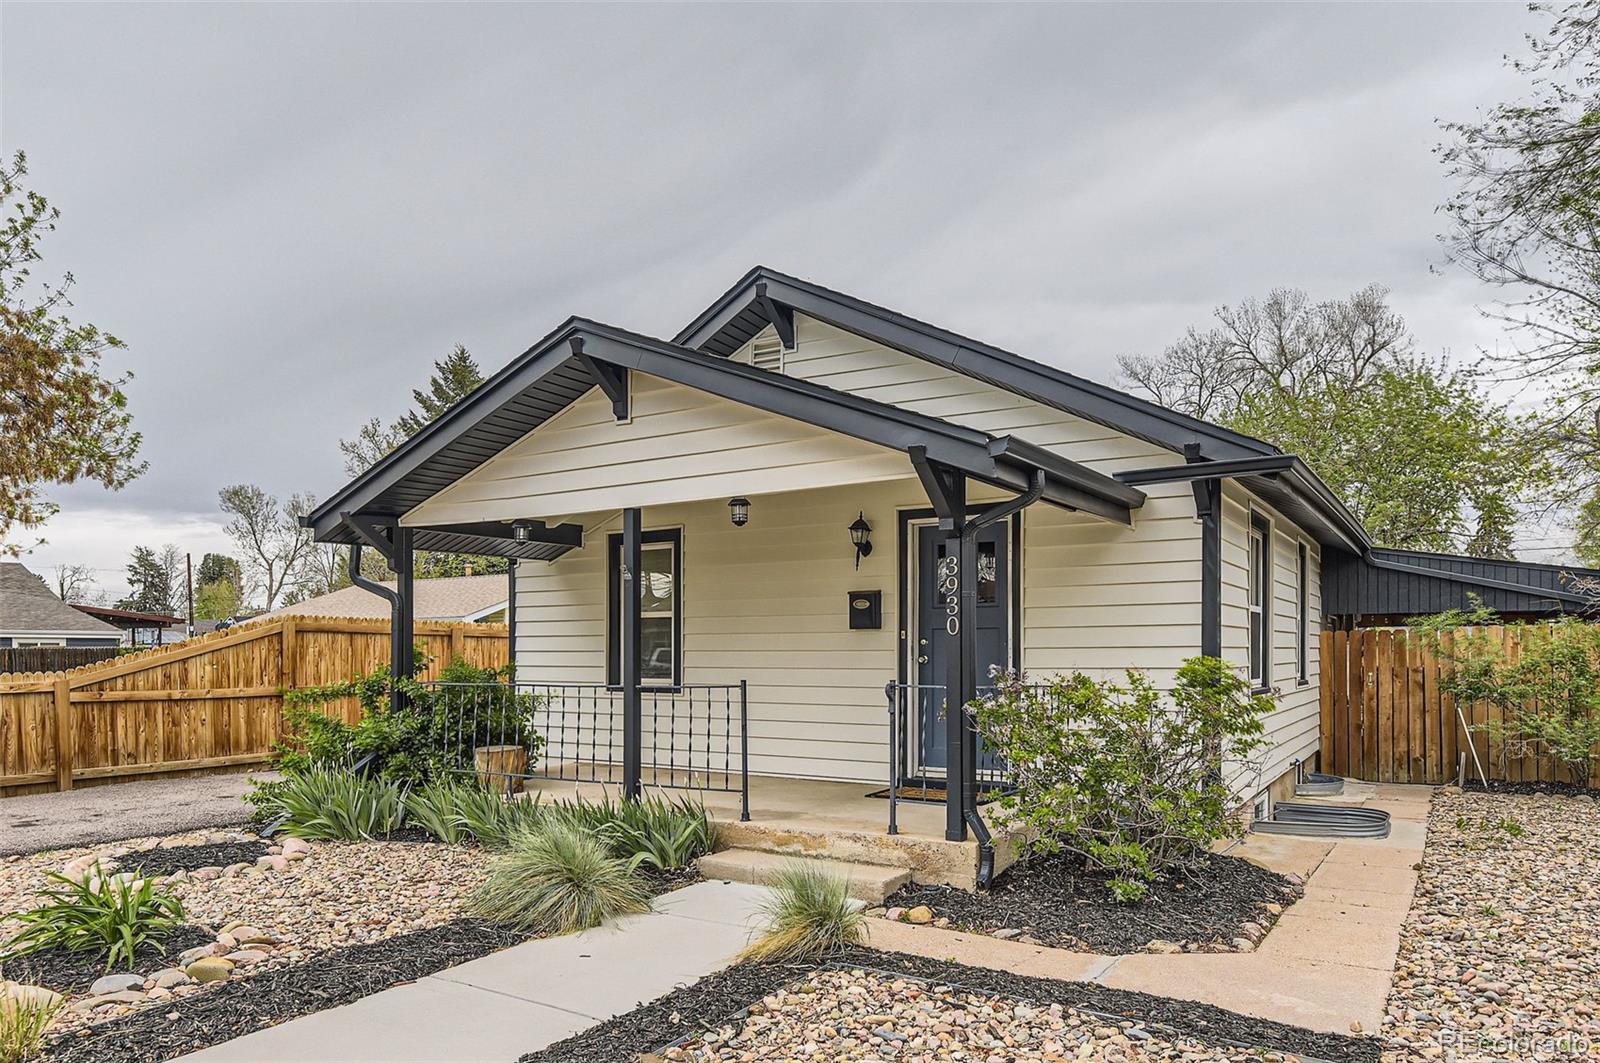
Active
$565,000
3
bds
|
2
ba
|
1,408
sqft
|
built
1923
3930 S Sherman St, Englewood, CO 80113
$-1,268
Cash flow
-11.7%
Cash-on-Cash Return
3.6%
Cap rate
0.5%
Rent to Value Ratio
Active
$500,000
3
bds
|
1
ba
|
884
sqft
|
built
1925
4476 S Lincoln St, Englewood, CO 80113
$-1,108
Cash flow
-11.6%
Cash-on-Cash Return
3.6%
Cap rate
0.5%
Rent to Value Ratio
Active
$3,495,000
6
bds
|
6
ba
|
7,545
sqft
|
built
1968
4181 S Ivy Ln, Englewood, CO 80111
$-15,932
Cash flow
-23.8%
Cash-on-Cash Return
0.8%
Cap rate
0.2%
Rent to Value Ratio
Active
$540,000
2
bds
|
4
ba
|
1,728
sqft
|
built
1986
2060 W Iliff Ave, Englewood, CO 80110
$-1,317
Cash flow
-12.7%
Cash-on-Cash Return
3.4%
Cap rate
0.5%
Rent to Value Ratio
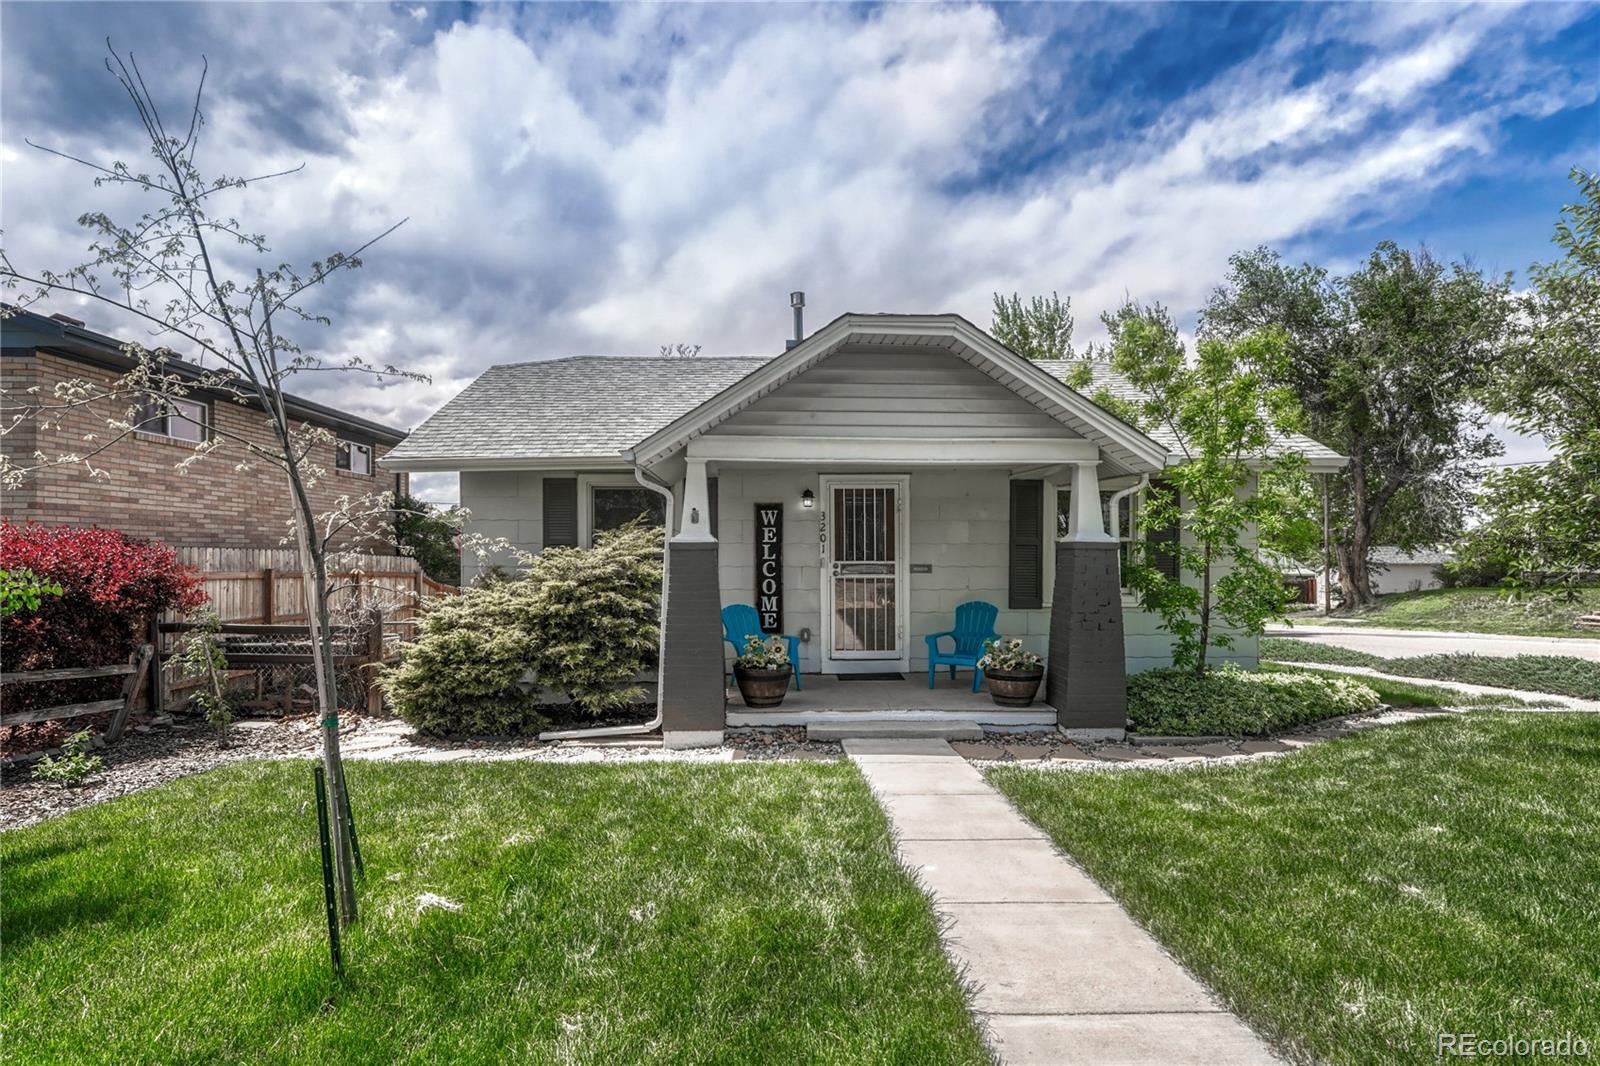
Active
$799,000
5
bds
|
3
ba
|
2,498
sqft
|
built
1940
3201 S Pearl St, Englewood, CO 80113
$-2,521
Cash flow
-16.5%
Cash-on-Cash Return
2.5%
Cap rate
0.4%
Rent to Value Ratio
Active
$524,904
4
bds
|
2
ba
|
1,351
sqft
|
built
1950
2332 W Baltic Pl, Englewood, CO 80110
$-904
Cash flow
-9.0%
Cash-on-Cash Return
4.2%
Cap rate
0.6%
Rent to Value Ratio
Active
$695,000
3
bds
|
0
ba
|
0
sqft
|
built
1985
2000 W Iliff Ave, Englewood, CO 80110
$-1,666
Cash flow
-12.5%
Cash-on-Cash Return
3.4%
Cap rate
0.5%
Rent to Value Ratio

Active
$542,000
3
bds
|
1
ba
|
1,632
sqft
|
built
1902
1111 E Dartmouth Ave, Englewood, CO 80113
$-824
Cash flow
-7.9%
Cash-on-Cash Return
4.5%
Cap rate
0.6%
Rent to Value Ratio
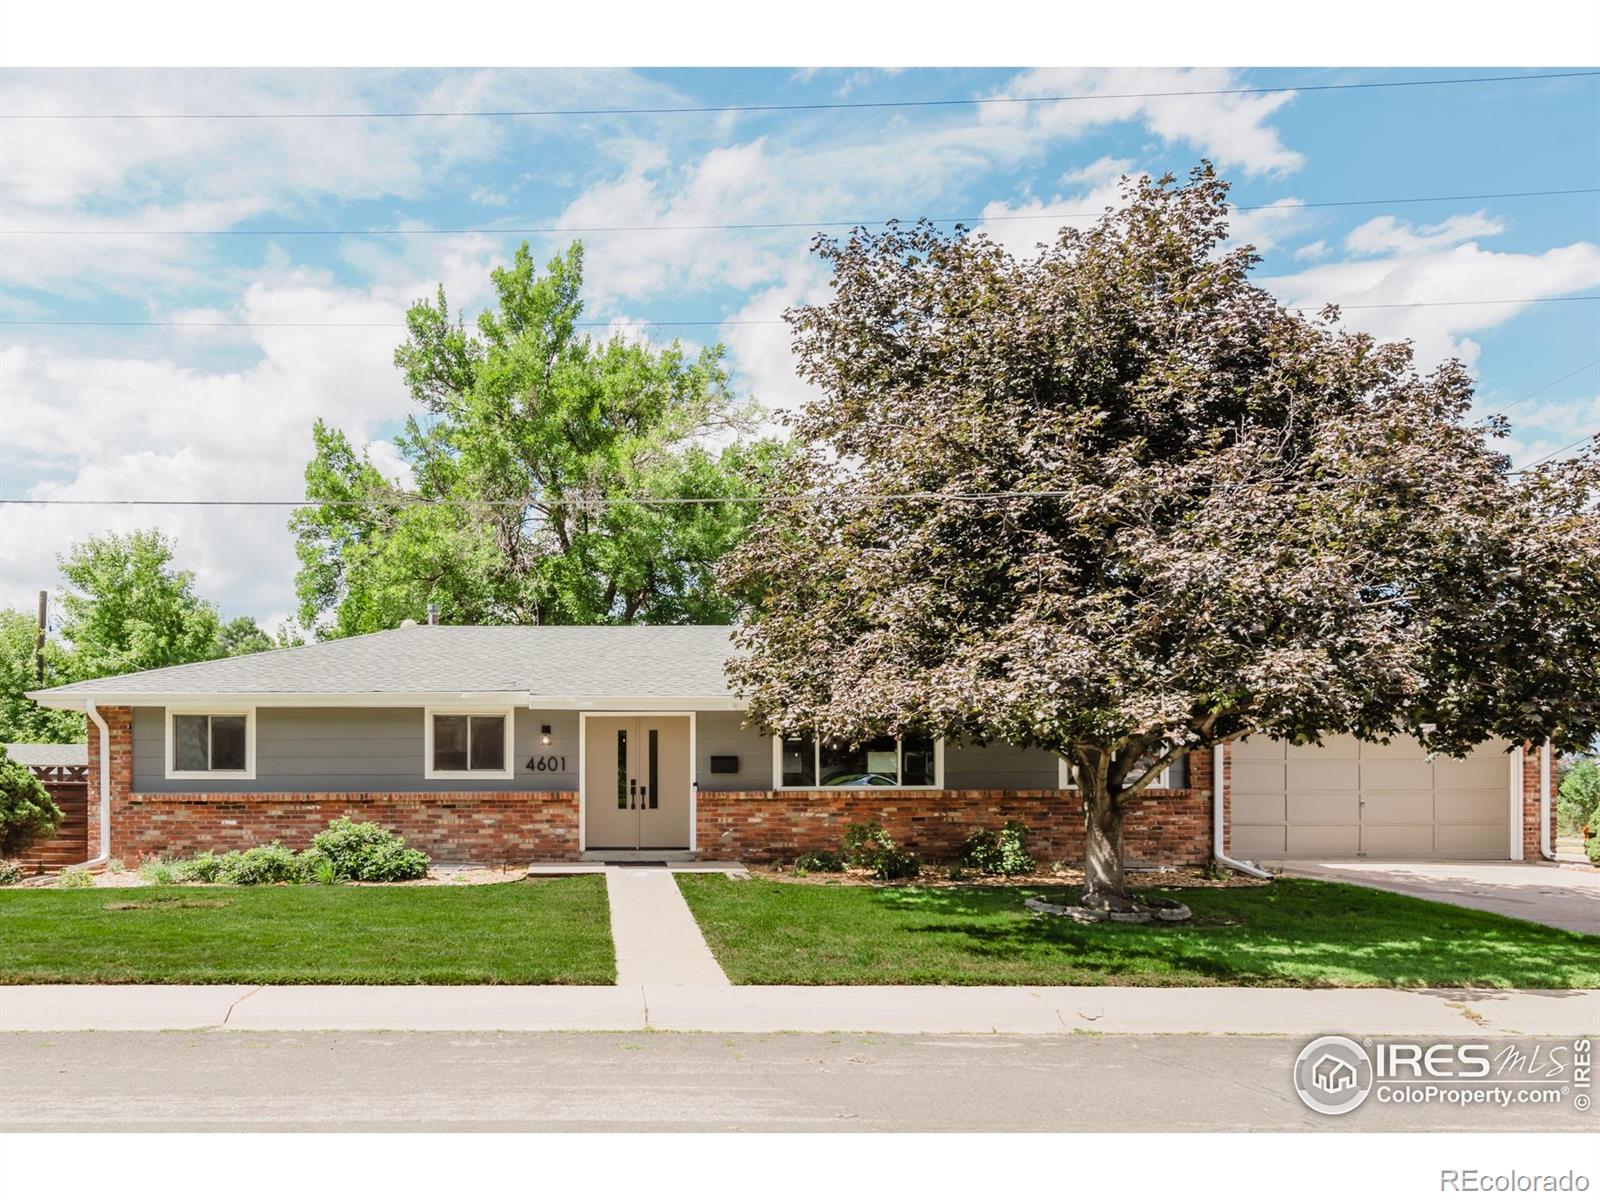
Active
$835,000
5
bds
|
3
ba
|
3,136
sqft
|
built
1971
4601 S Lipan St, Englewood, CO 80110
$-1,511
Cash flow
-9.4%
Cash-on-Cash Return
4.1%
Cap rate
0.5%
Rent to Value Ratio
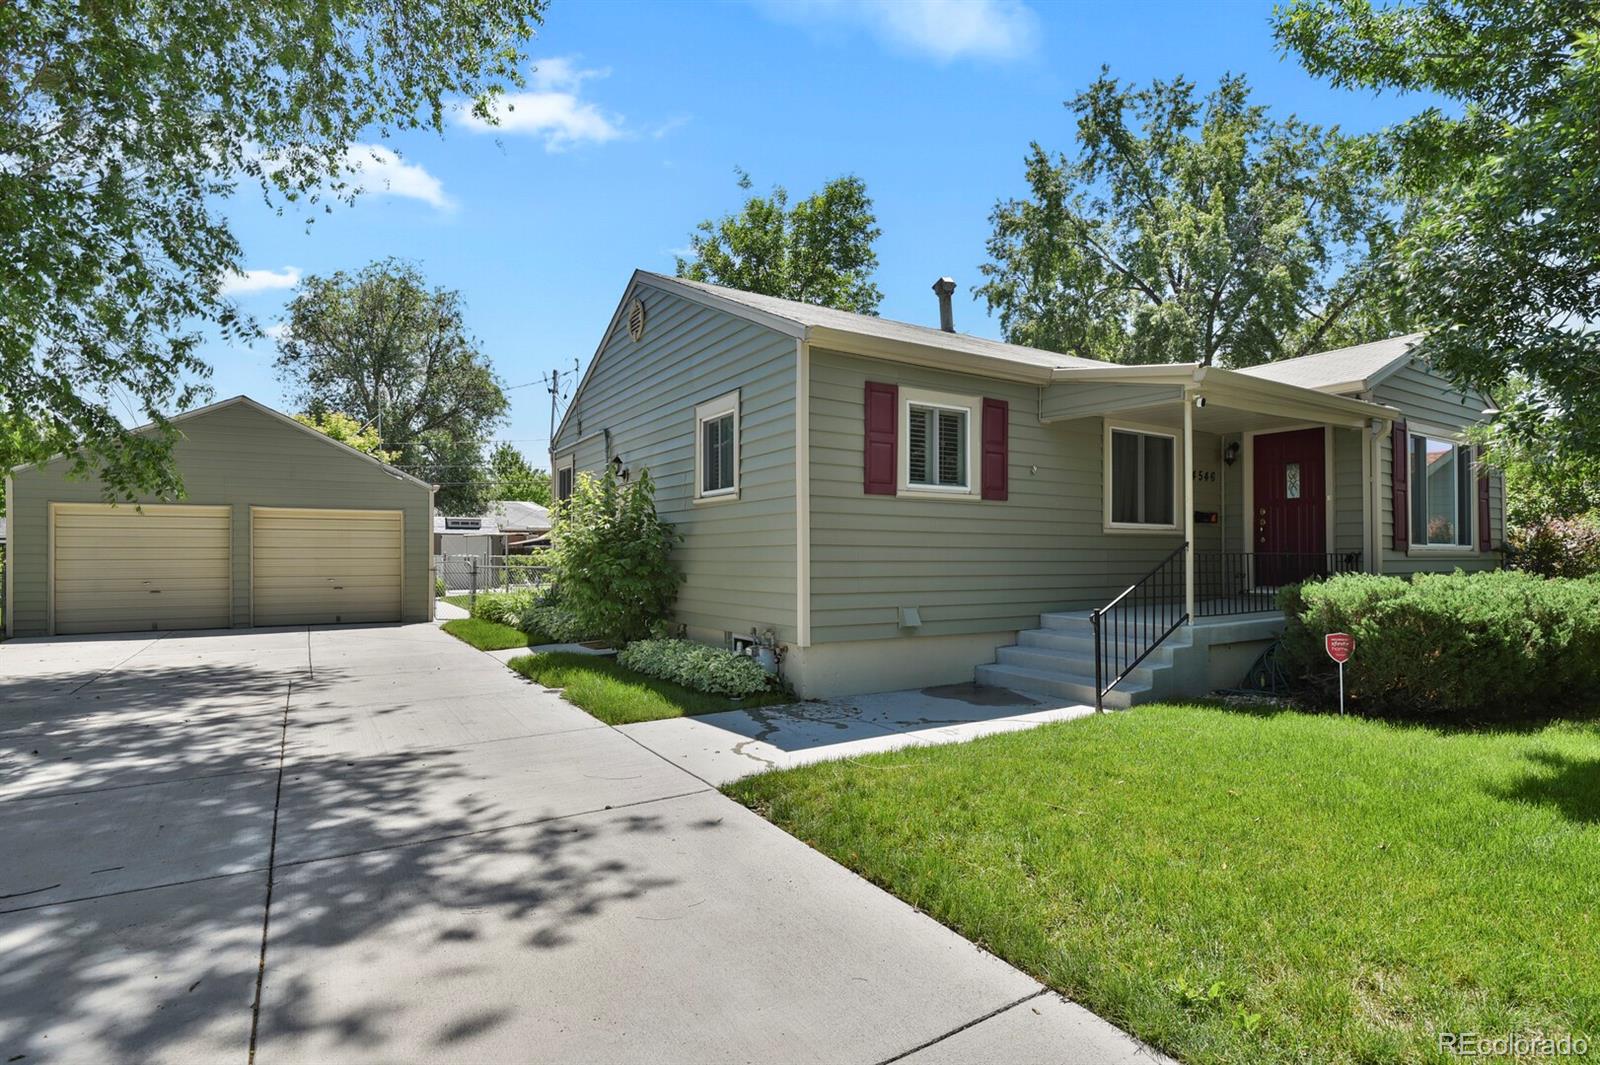
Active
$599,950
3
bds
|
2
ba
|
1,856
sqft
|
built
1947
4546 S Logan St, Englewood, CO 80113
$-1,606
Cash flow
-14.0%
Cash-on-Cash Return
3.1%
Cap rate
0.4%
Rent to Value Ratio
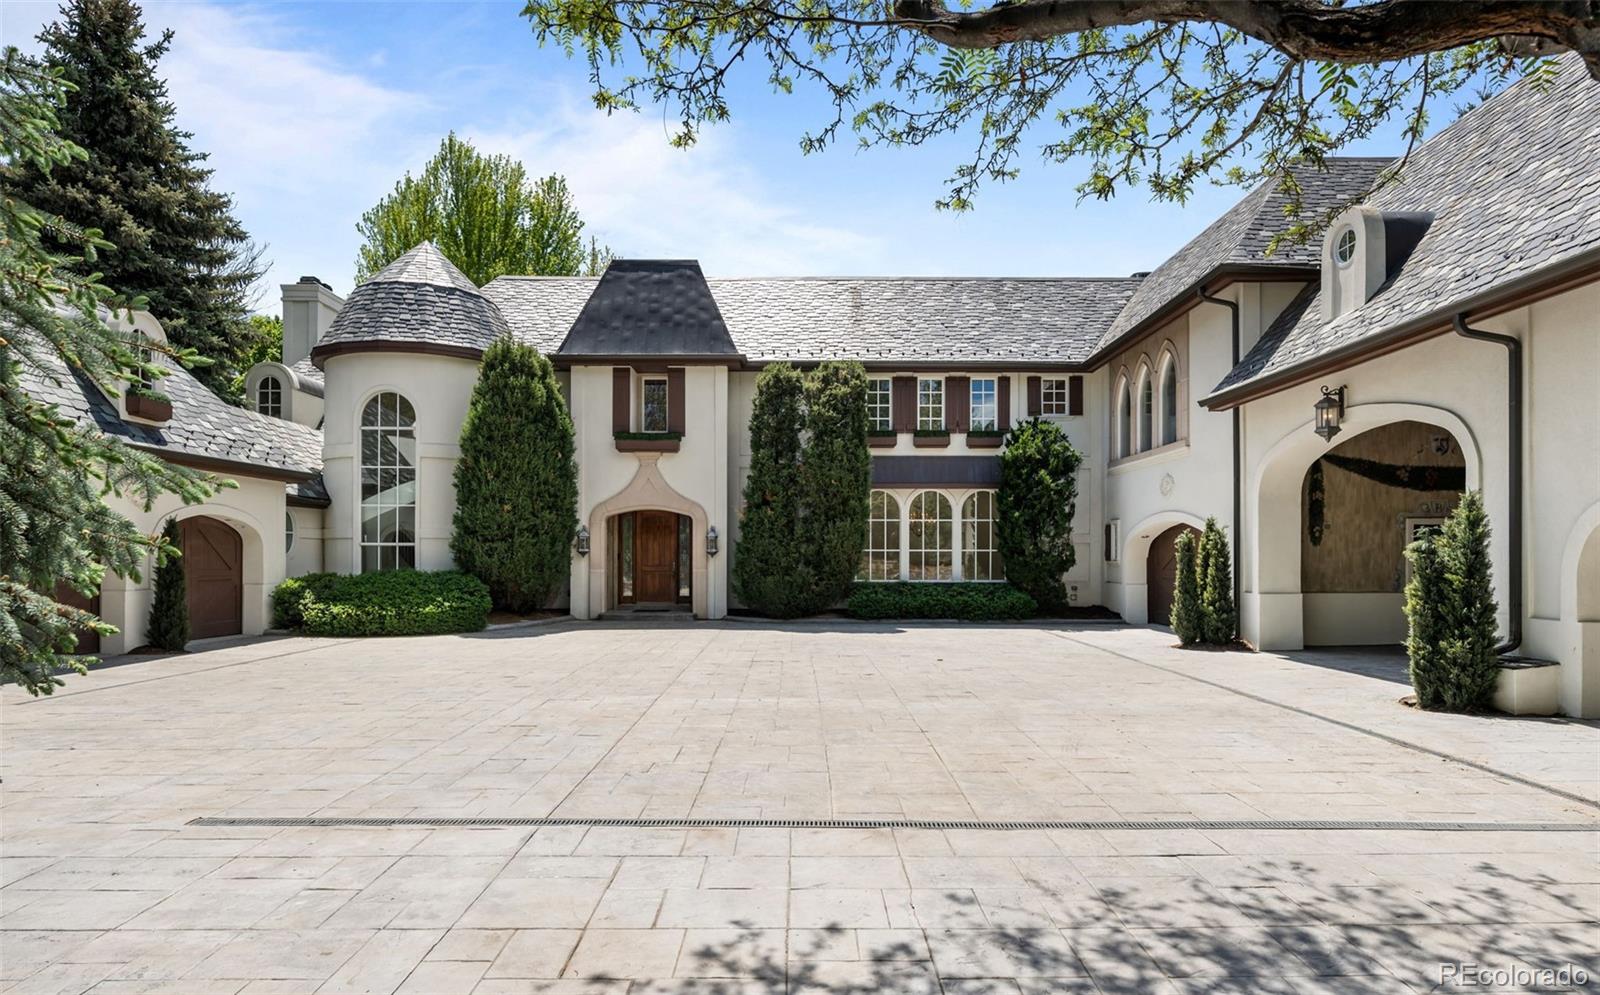
Active
$8,650,000
5
bds
|
9
ba
|
12,356
sqft
|
built
1997
5 Churchill Dr, Englewood, CO 80113
$-42,613
Cash flow
-25.7%
Cash-on-Cash Return
0.4%
Cap rate
0.1%
Rent to Value Ratio
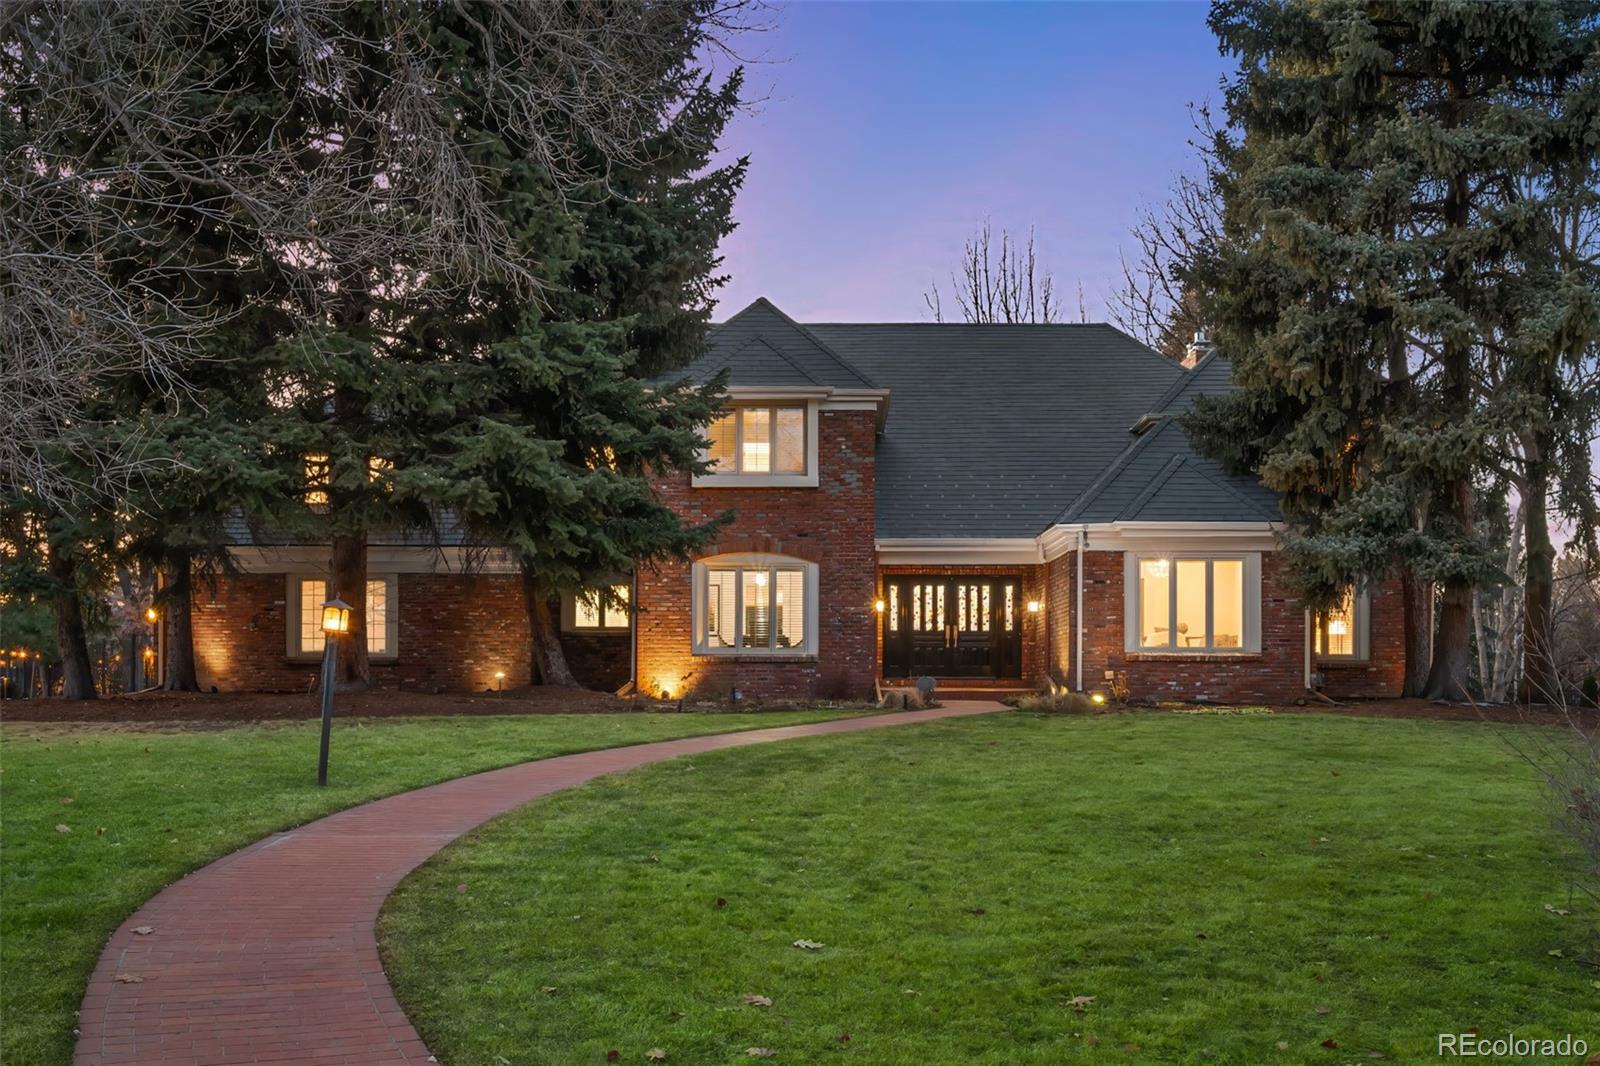
Active
$3,250,000
6
bds
|
7
ba
|
6,396
sqft
|
built
1981
7 Cherry Hills Farm Dr, Englewood, CO 80113
$-14,980
Cash flow
-24.0%
Cash-on-Cash Return
0.8%
Cap rate
0.2%
Rent to Value Ratio
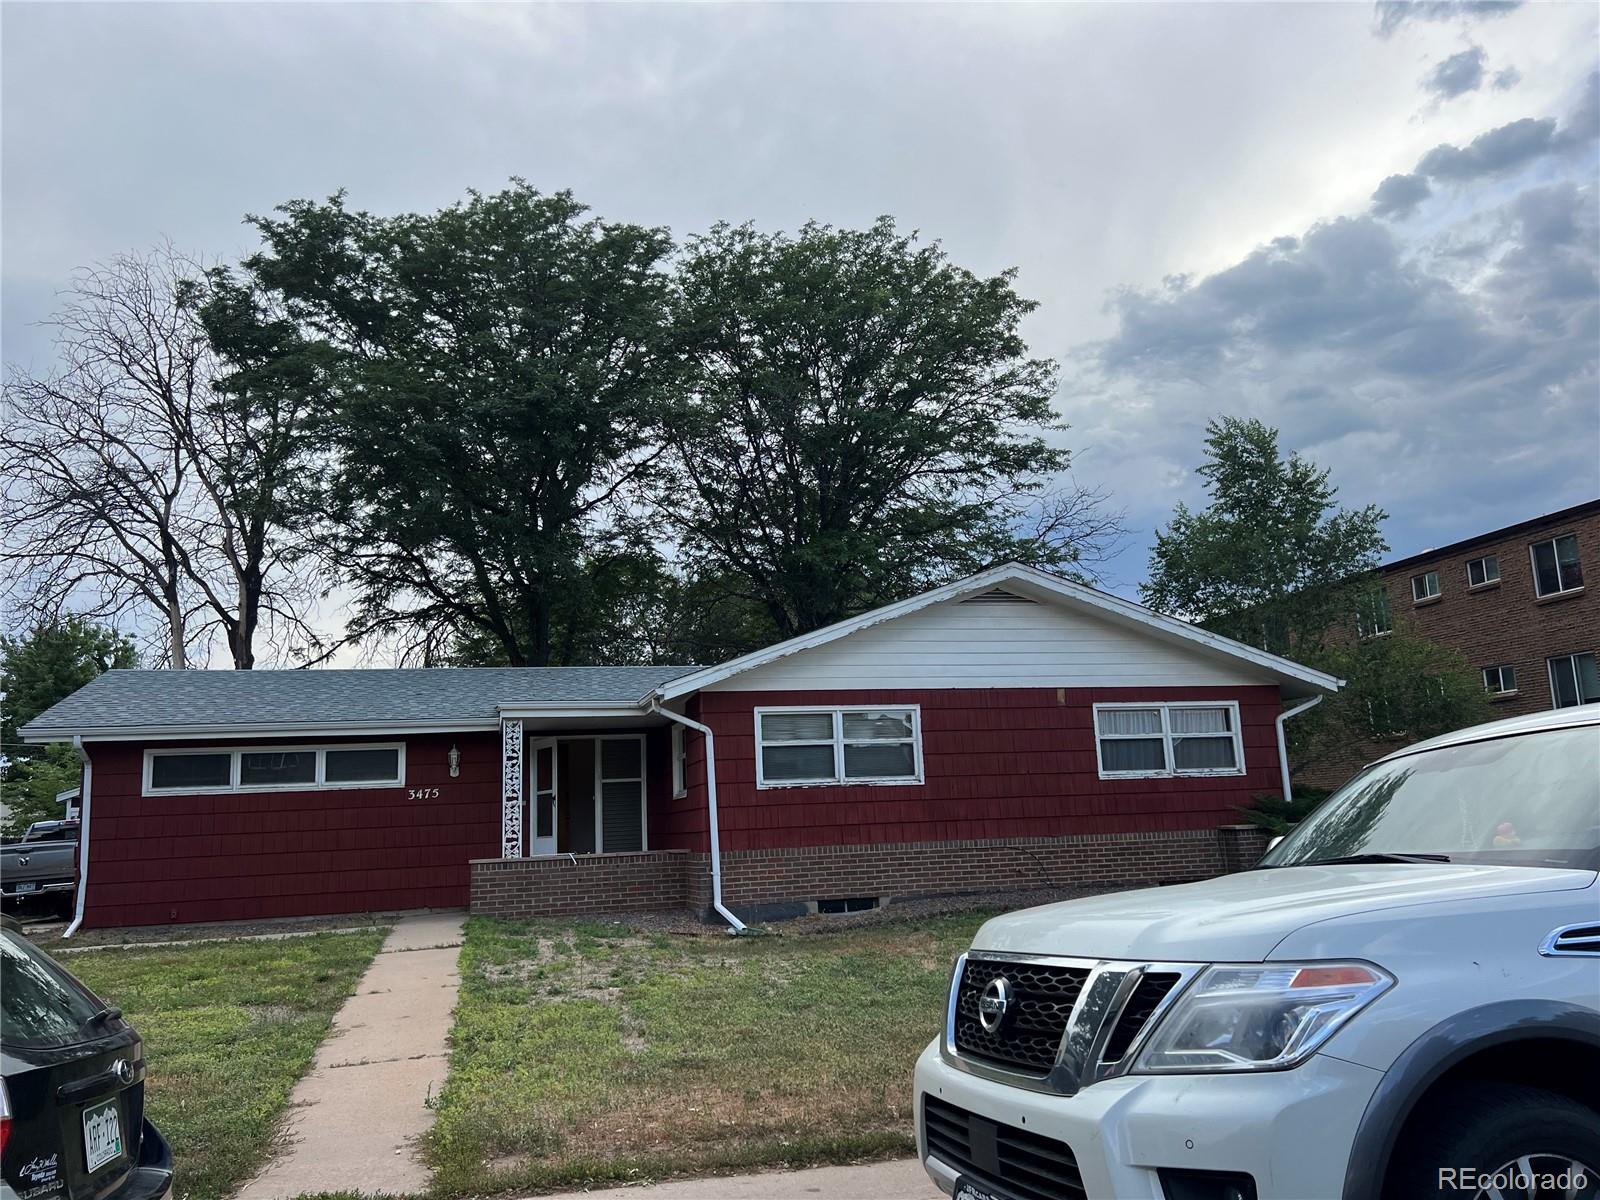
Active
$899,000
5
bds
|
2
ba
|
2,307
sqft
|
built
1960
3475 S Marion St, Englewood, CO 80113
$-2,967
Cash flow
-17.2%
Cash-on-Cash Return
2.3%
Cap rate
0.3%
Rent to Value Ratio
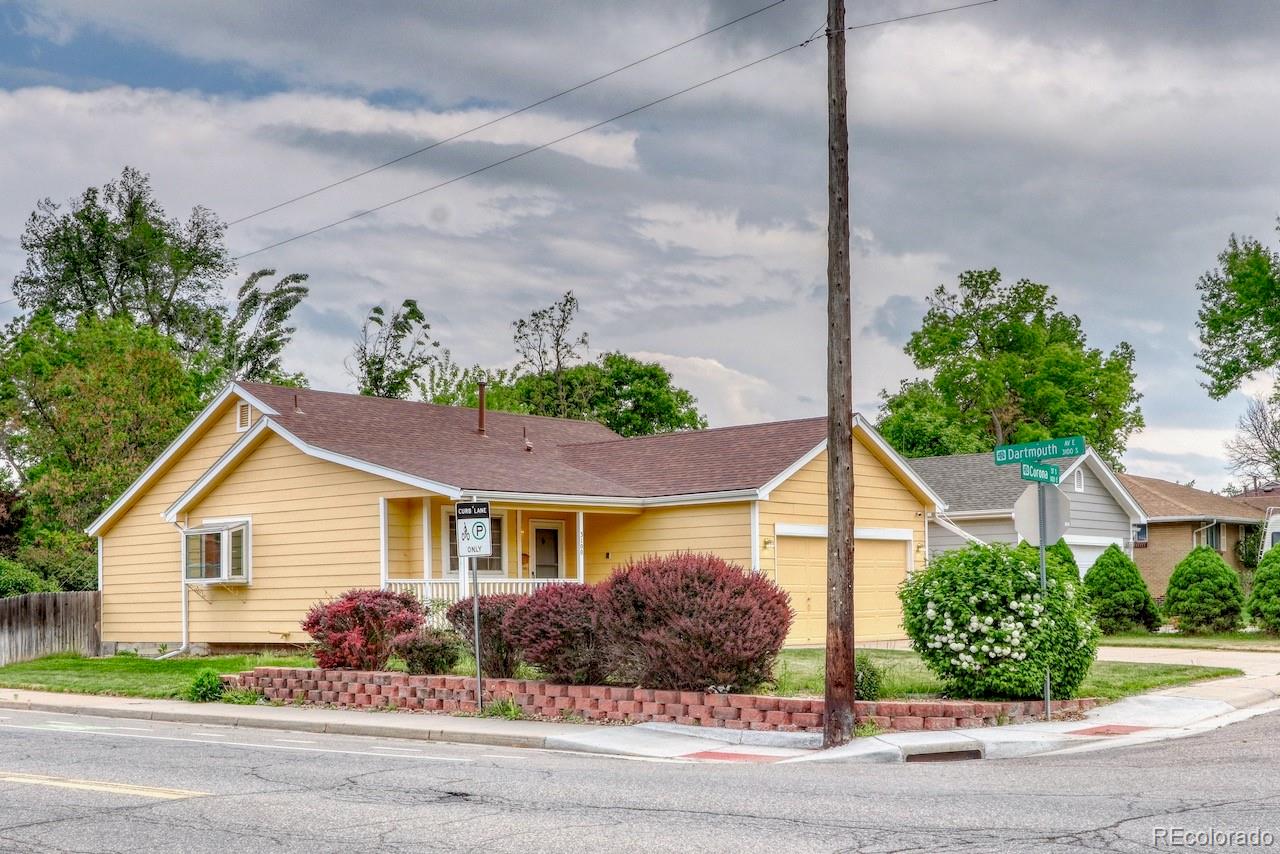
Active
$680,000
3
bds
|
2
ba
|
1,388
sqft
|
built
1993
3100 S Corona St, Englewood, CO 80113
$-1,657
Cash flow
-12.7%
Cash-on-Cash Return
3.4%
Cap rate
0.5%
Rent to Value Ratio
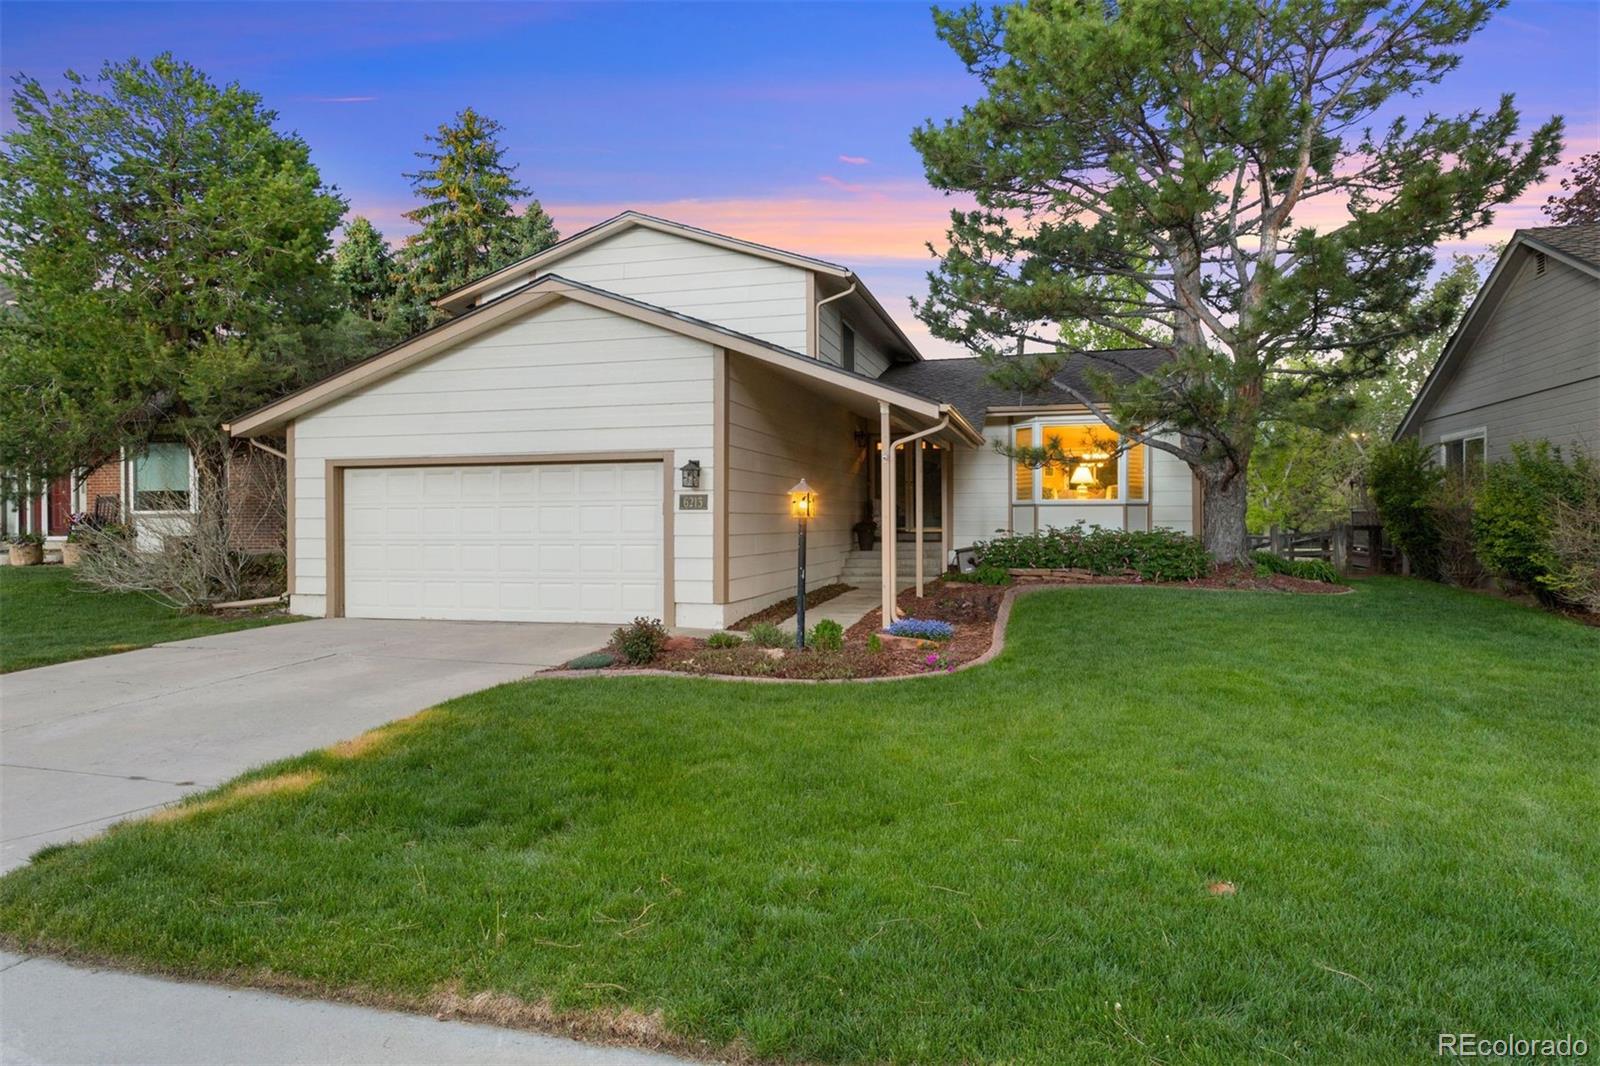
Closed
$820,000
4
bds
|
3
ba
|
2,716
sqft
|
built
1979
6213 S Galena Way, Englewood, CO 80111
$-1,516
Cash flow
-9.6%
Cash-on-Cash Return
4.1%
Cap rate
0.5%
Rent to Value Ratio
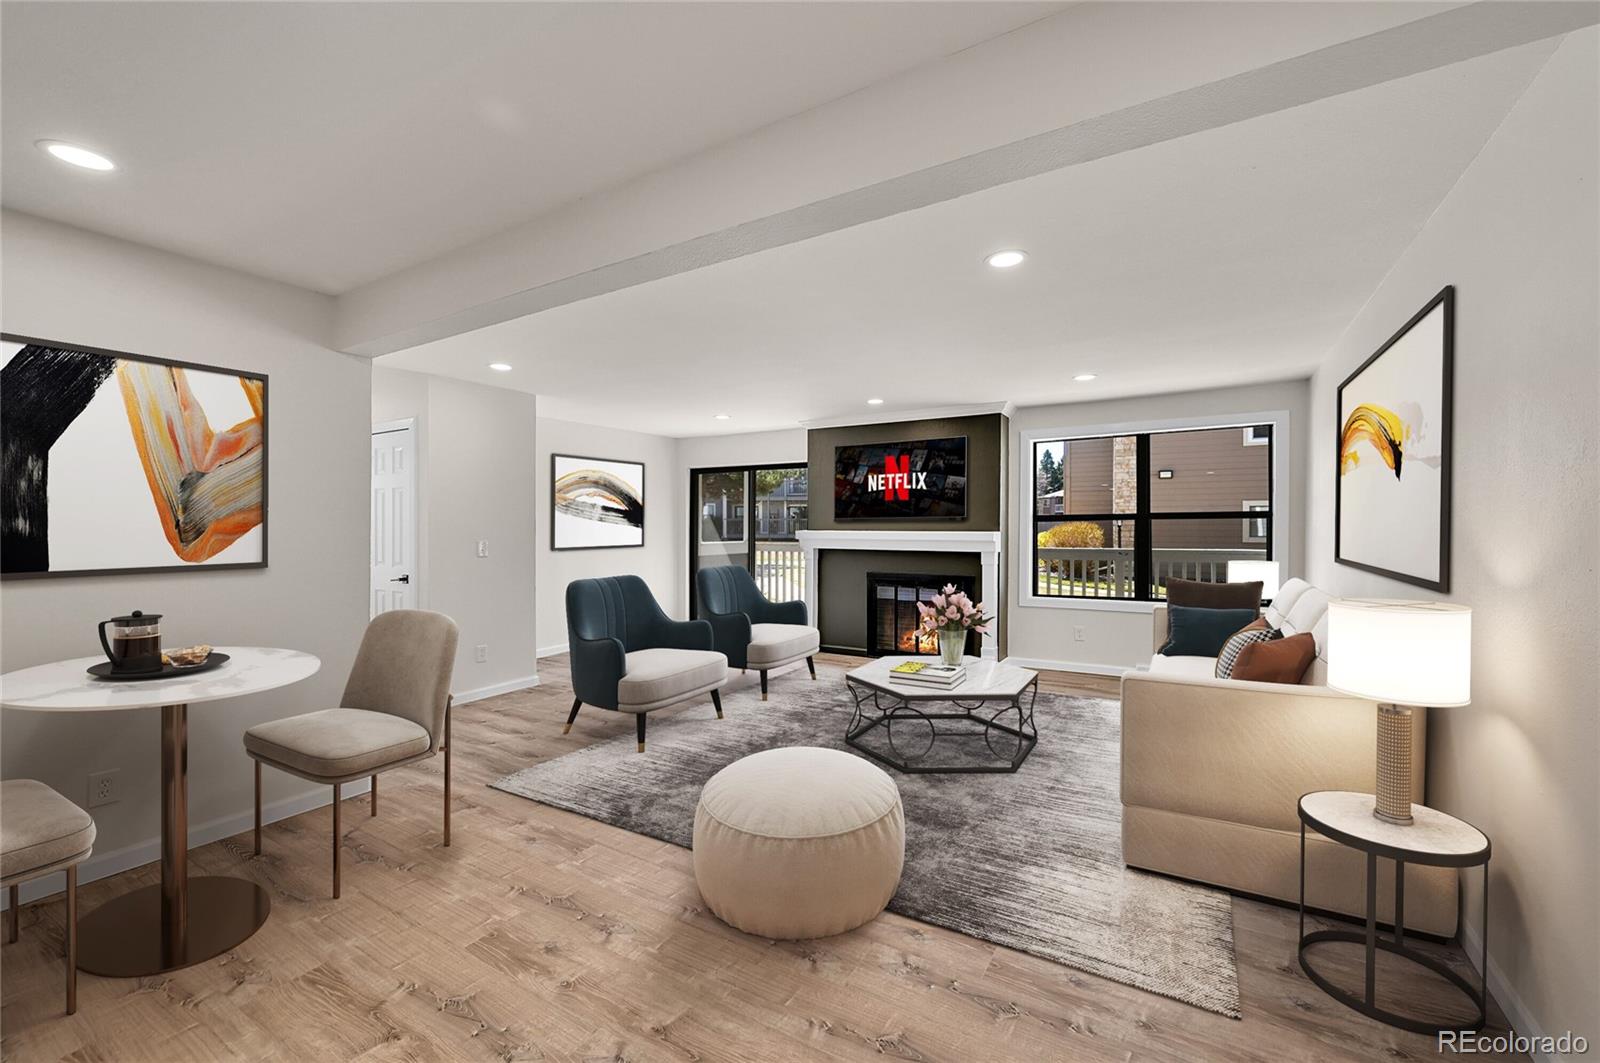
Pending
$350,000
2
bds
|
2
ba
|
1,095
sqft
|
built
1979
6485 S Havana St, Englewood, CO 80111
$-1,137
Cash flow
-16.9%
Cash-on-Cash Return
2.4%
Cap rate
0.6%
Rent to Value Ratio
Active
$2,075,000
5
bds
|
4
ba
|
3,734
sqft
|
built
1952
4600 S University Blvd, Englewood, CO 80113
$-7,788
Cash flow
-19.6%
Cash-on-Cash Return
1.8%
Cap rate
0.3%
Rent to Value Ratio
Active
$489,000
2
bds
|
2
ba
|
961
sqft
|
built
2020
3500 S Corona St, Englewood, CO 80113
$-1,433
Cash flow
-15.3%
Cash-on-Cash Return
2.8%
Cap rate
0.5%
Rent to Value Ratio
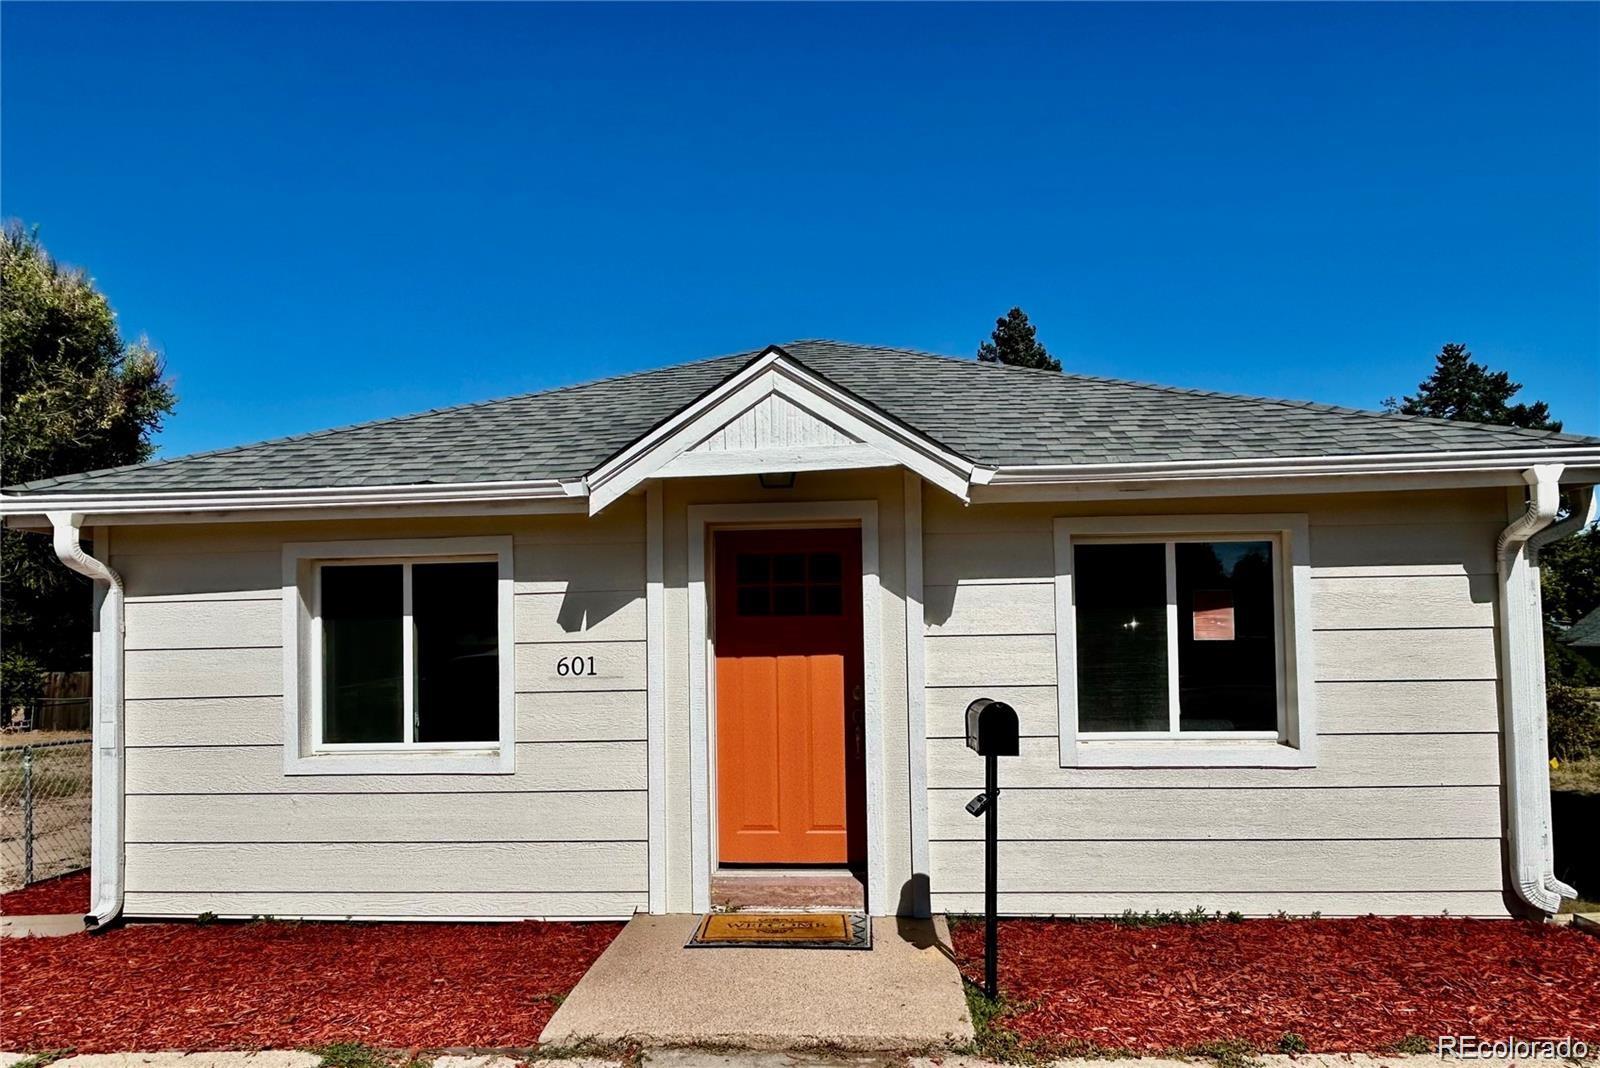
Active
$565,000
4
bds
|
2
ba
|
1,196
sqft
|
built
1937
601 W Layton Ave, Englewood, CO 80110
$-739
Cash flow
-6.8%
Cash-on-Cash Return
4.7%
Cap rate
0.6%
Rent to Value Ratio
Active
$460,000
2
bds
|
1
ba
|
600
sqft
|
built
1915
3074 S Elati St, Englewood, CO 80110
$-1,184
Cash flow
-13.4%
Cash-on-Cash Return
3.2%
Cap rate
0.4%
Rent to Value Ratio
Active under contract
$899,000
4
bds
|
3
ba
|
2,824
sqft
|
built
1974
5616 S Kenton Ct, Englewood, CO 80111
$-2,733
Cash flow
-15.9%
Cash-on-Cash Return
2.6%
Cap rate
0.4%
Rent to Value Ratio
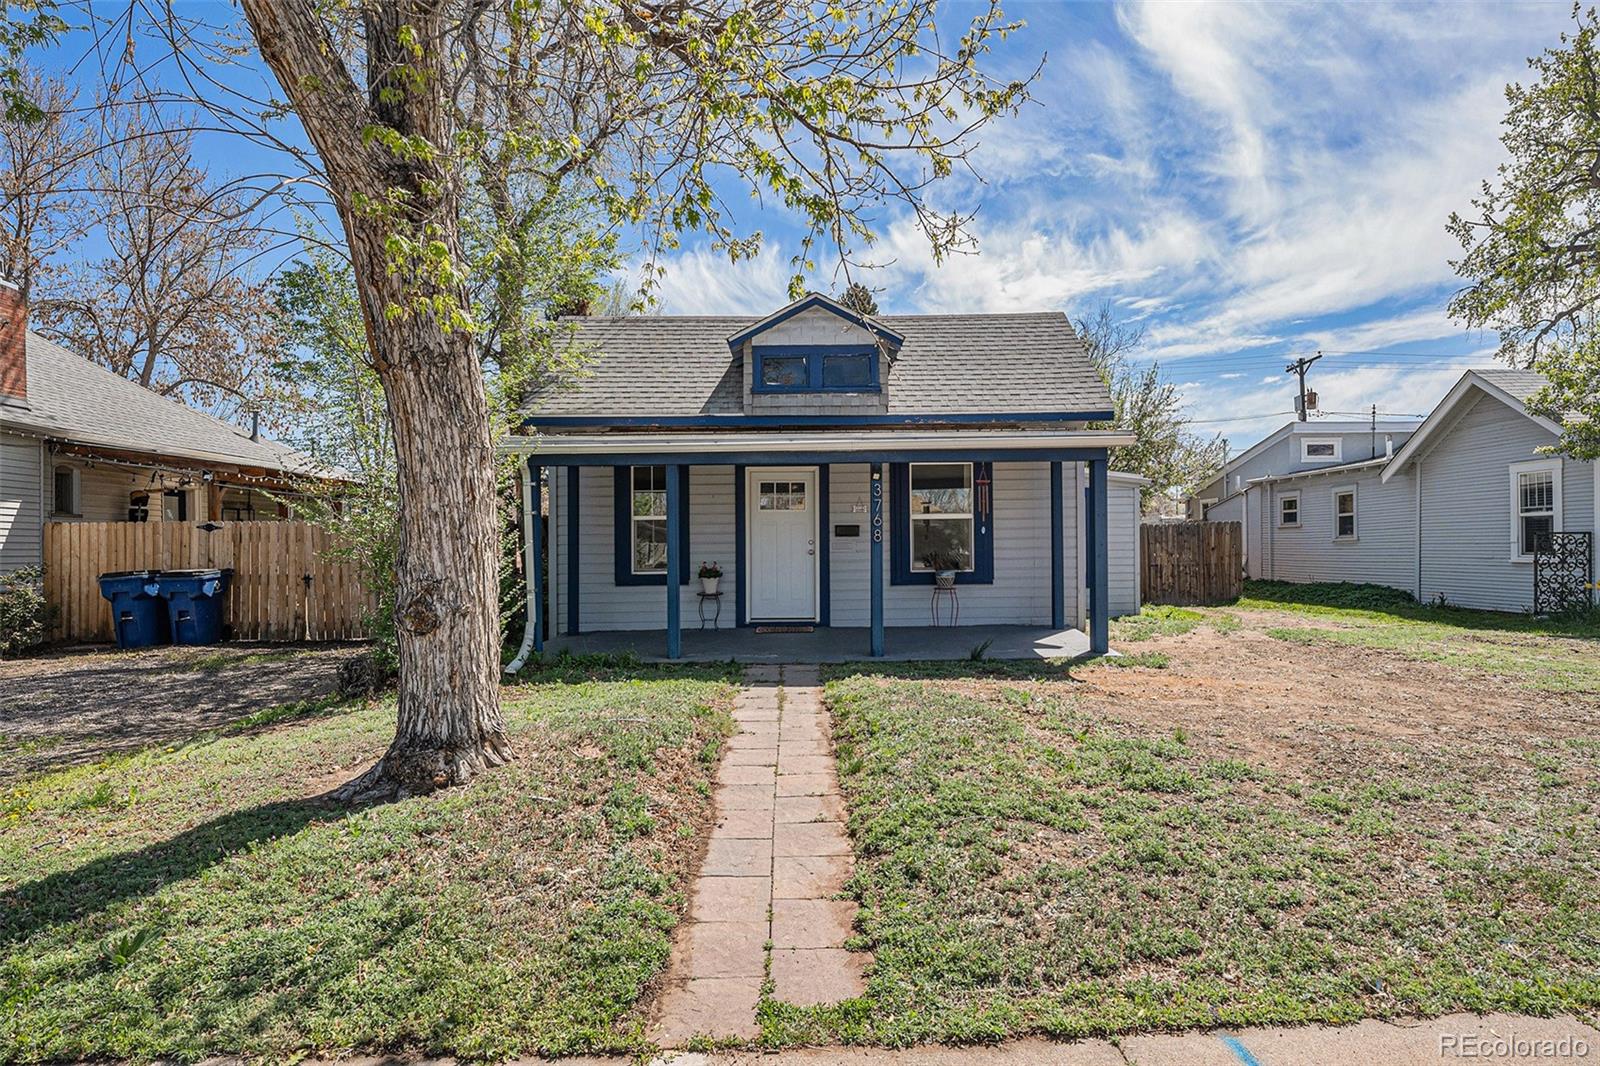
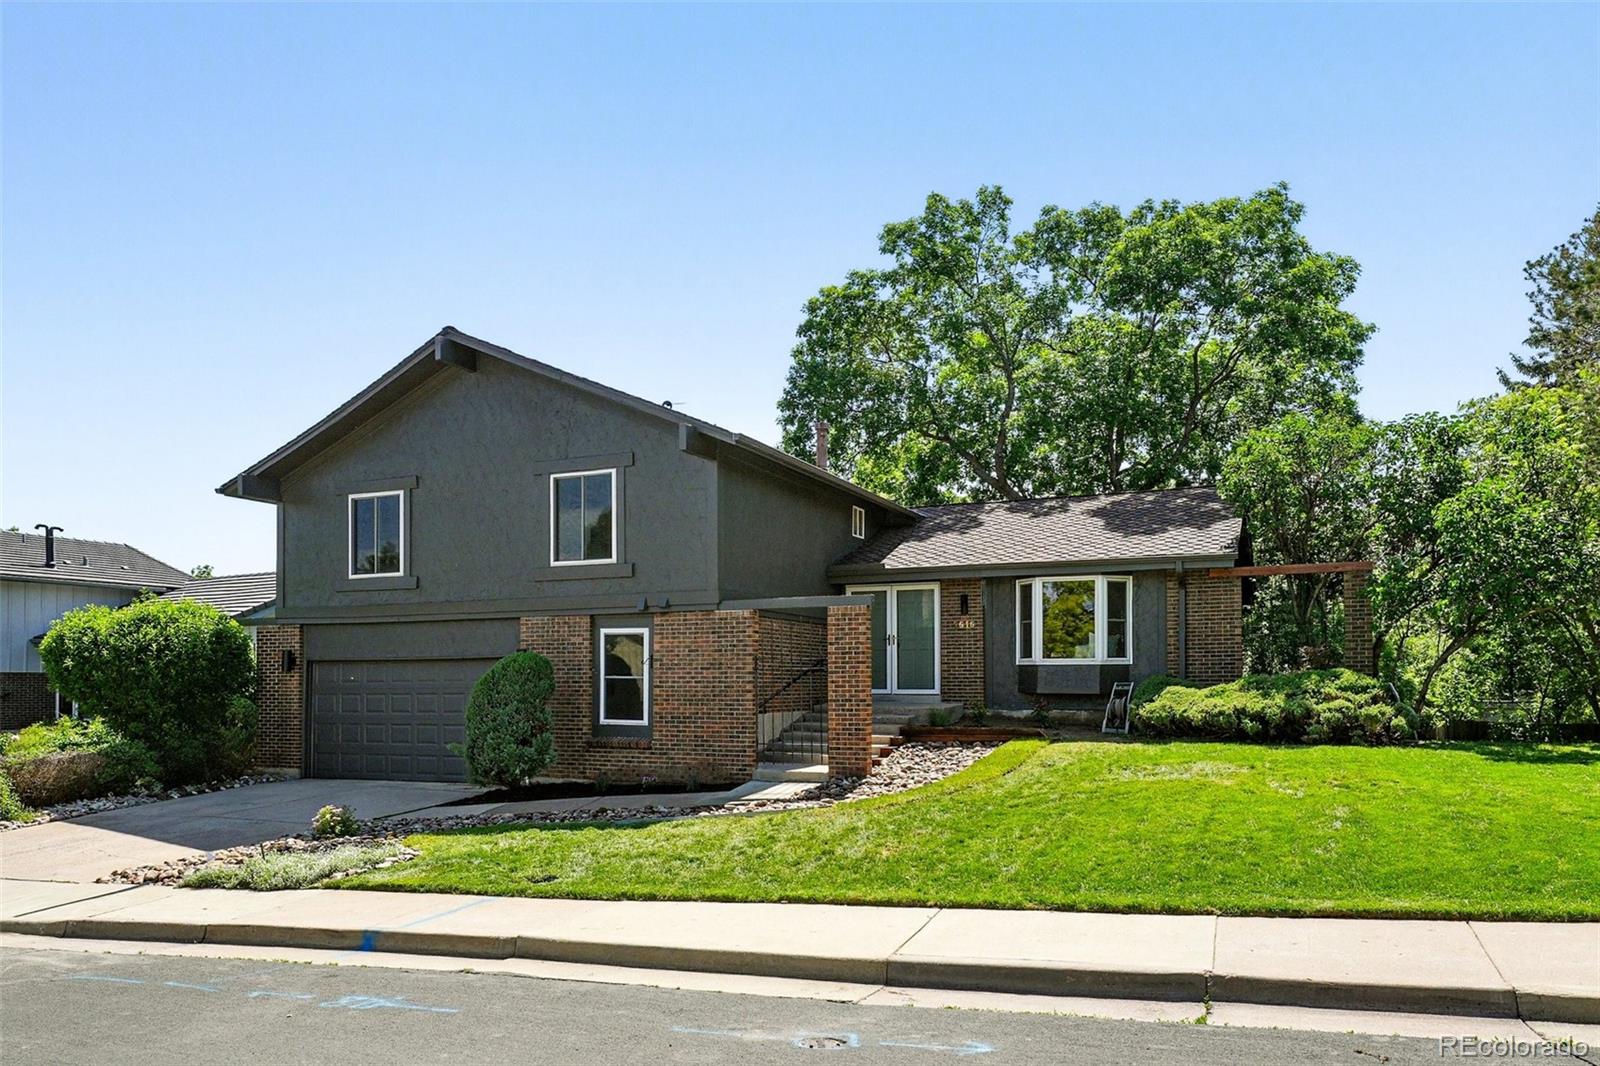
Active
$455,000
2
bds
|
1
ba
|
1,260
sqft
|
built
1915
3768 S Acoma St, Englewood, CO 80110
$-837
Cash flow
-9.6%
Cash-on-Cash Return
4.1%
Cap rate
0.5%
Rent to Value Ratio
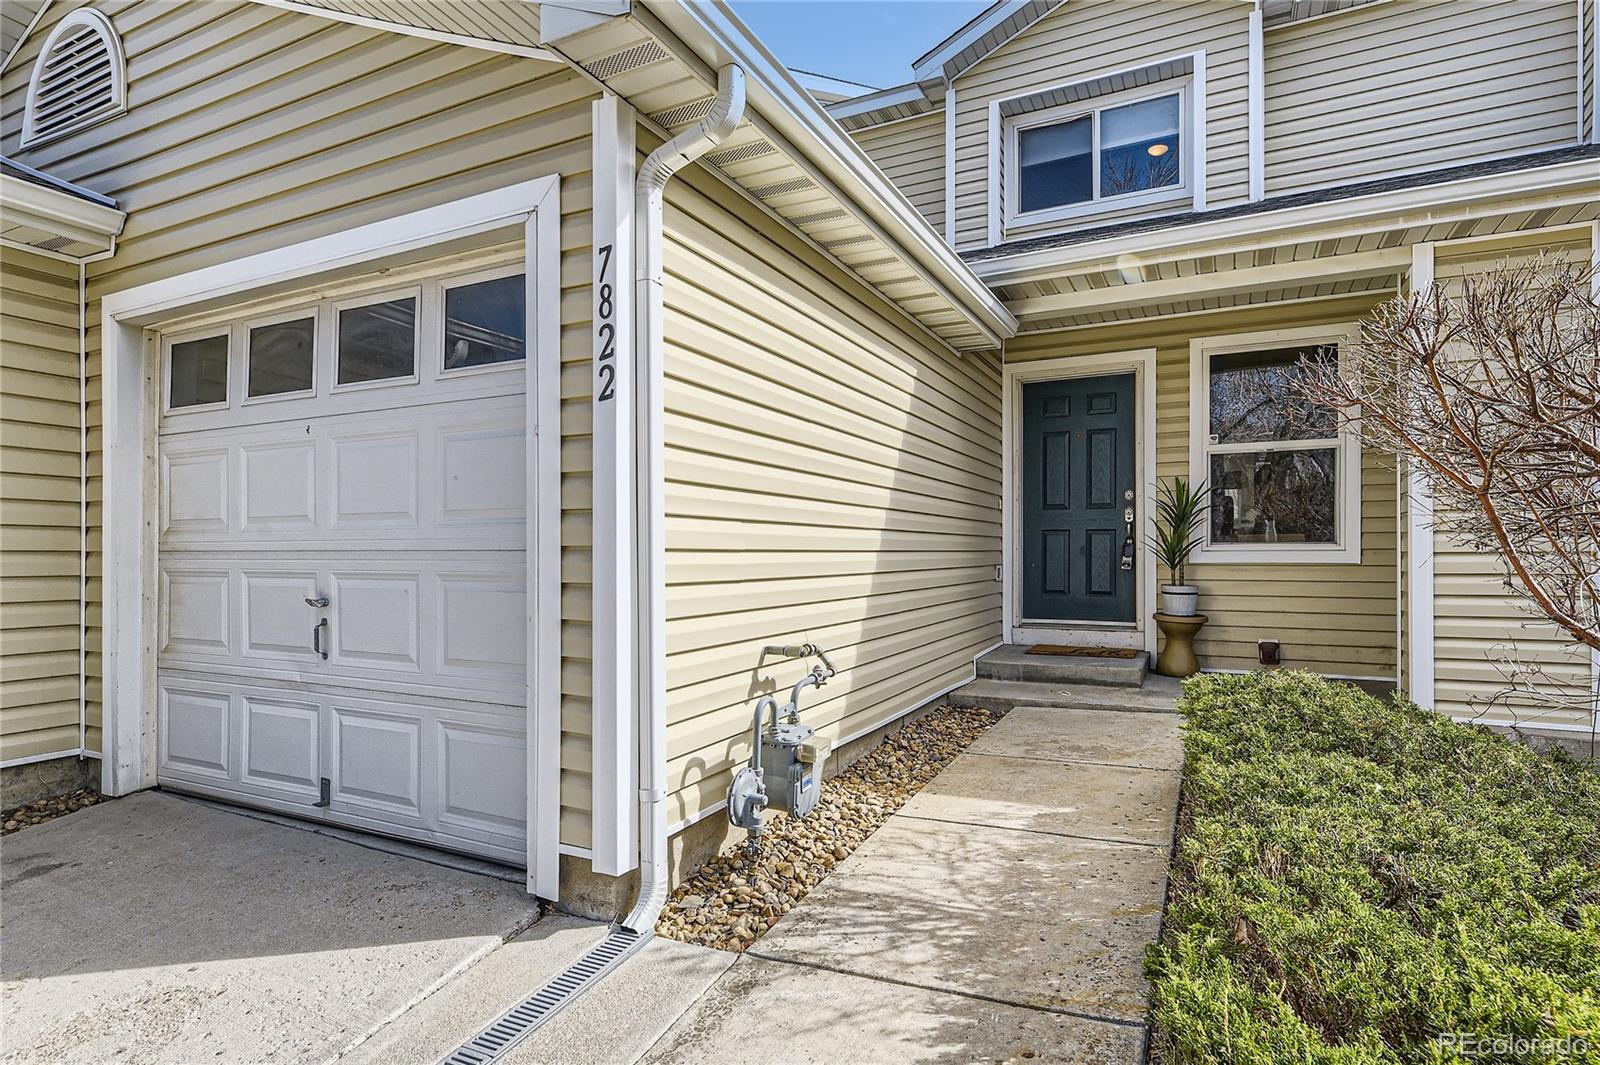
Active
$400,000
3
bds
|
2
ba
|
1,240
sqft
|
built
2001
7822 S Kittredge Cir, Englewood, CO 80112
$-1,073
Cash flow
-14.0%
Cash-on-Cash Return
3.1%
Cap rate
0.6%
Rent to Value Ratio