Englewood, CO Investment Properties for Sale
Browse homes for sale and investment properties in Englewood, CO. Refine your search by price, property type, or more.
Best cash flowing properties in Englewood, CO
Active
$202,999
1
bds
|
1
ba
|
709
sqft
|
built
1979
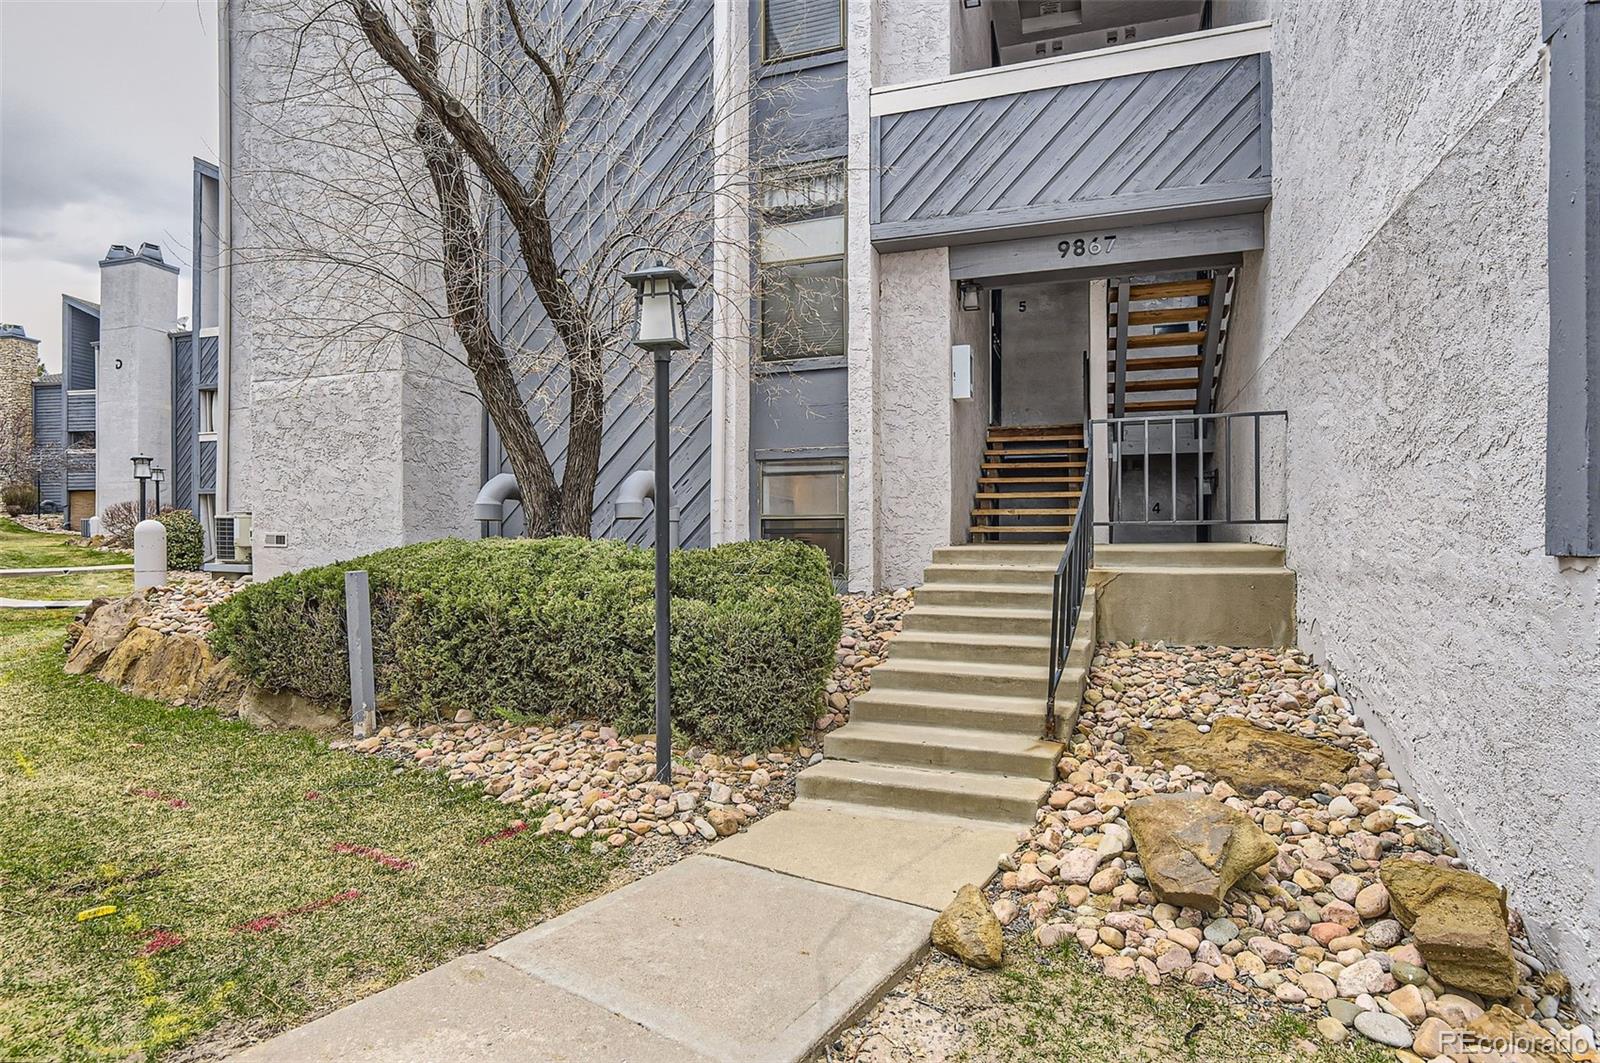
9867 E Peakview Ave, Englewood, CO 80111
$-193
Cash flow
-5.0%
Cash-on-Cash Return
5.1%
Cap rate
1.0%
Rent to Value Ratio

Active
$235,000
1
bds
|
1
ba
|
658
sqft
|
built
1987
9262 E Arbor Cir, Englewood, CO 80111
$-545
Cash flow
-12.1%
Cash-on-Cash Return
3.5%
Cap rate
0.7%
Rent to Value Ratio
221 out of 252 properties for sale in Englewood, CO
Limited Results Shown
Create a free account, or log in to reveal all property listings and enjoy the complete experience.
Active
$235,000
1
bds
|
1
ba
|
658
sqft
|
built
1987
9262 E Arbor Cir, Englewood, CO 80111
$-545
Cash flow
-12.1%
Cash-on-Cash Return
3.5%
Cap rate
0.7%
Rent to Value Ratio
Active
$475,000
3
bds
|
1
ba
|
1,140
sqft
|
built
1964
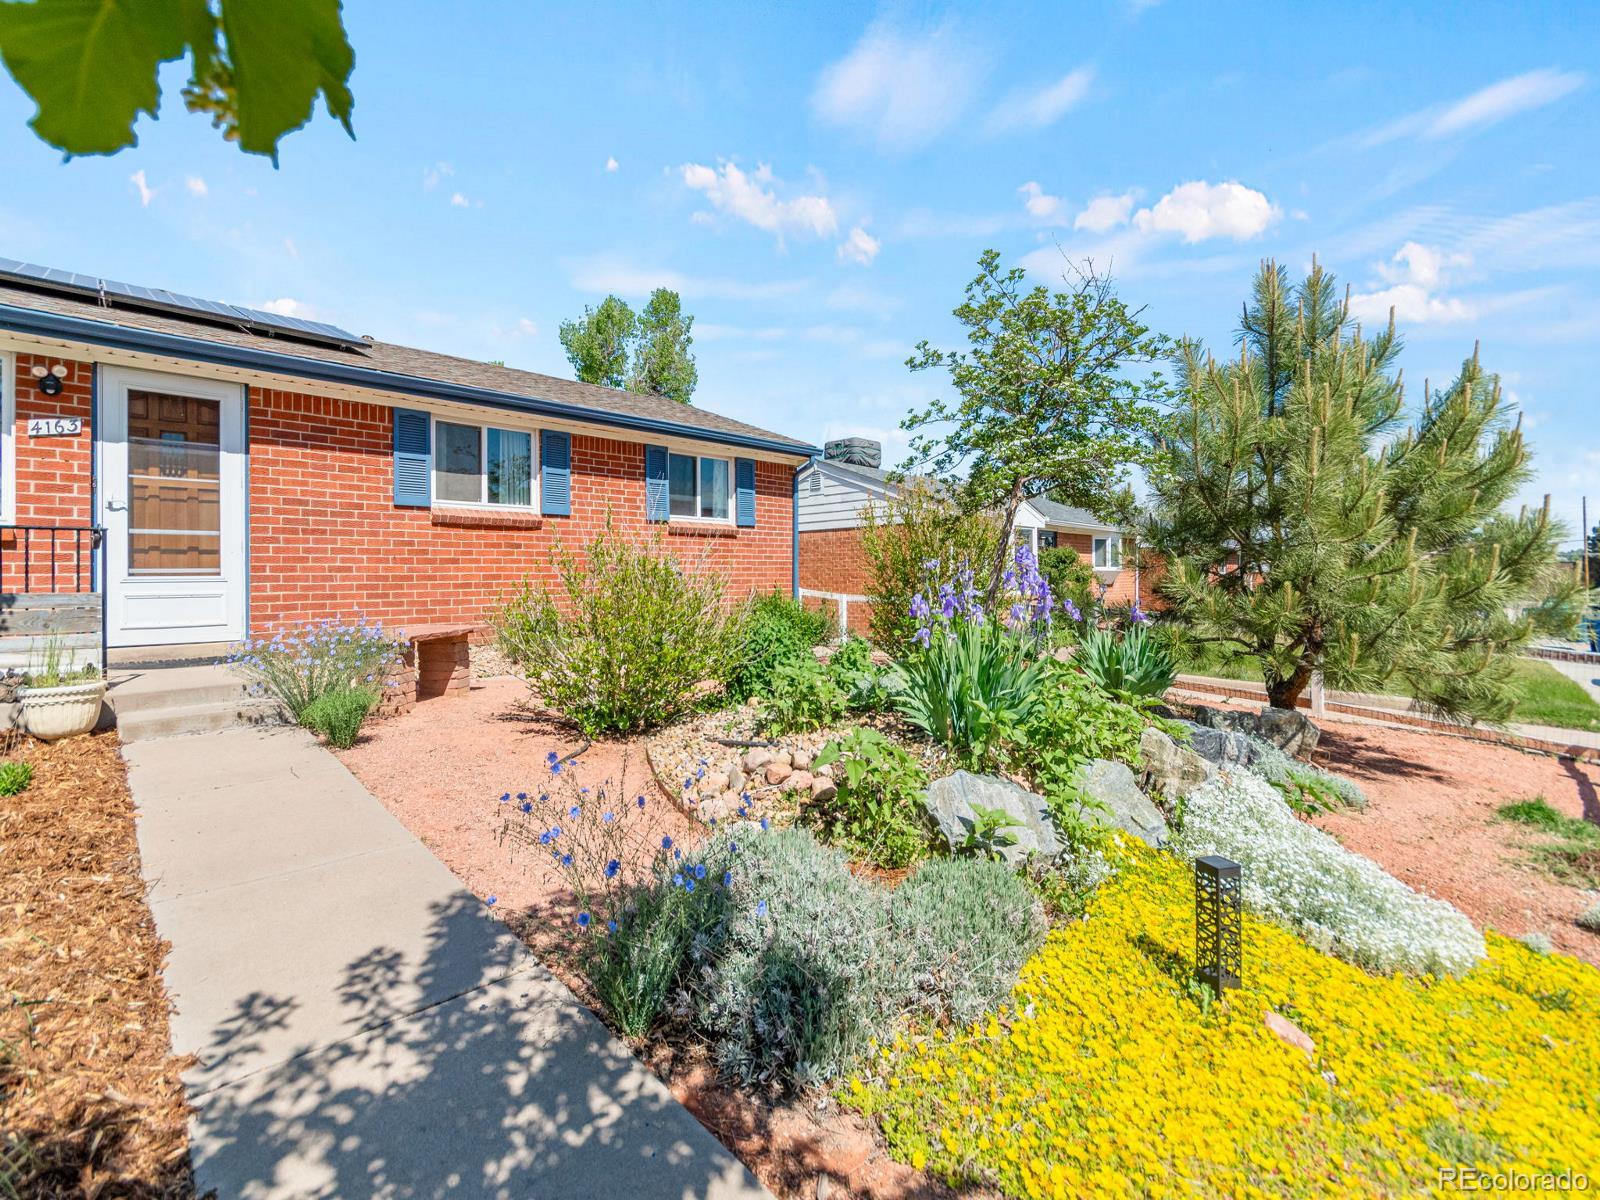
4163 S Decatur St, Englewood, CO 80110
$-954
Cash flow
-10.5%
Cash-on-Cash Return
3.9%
Cap rate
0.5%
Rent to Value Ratio
Active
$680,000
3
bds
|
2
ba
|
1,388
sqft
|
built
1993
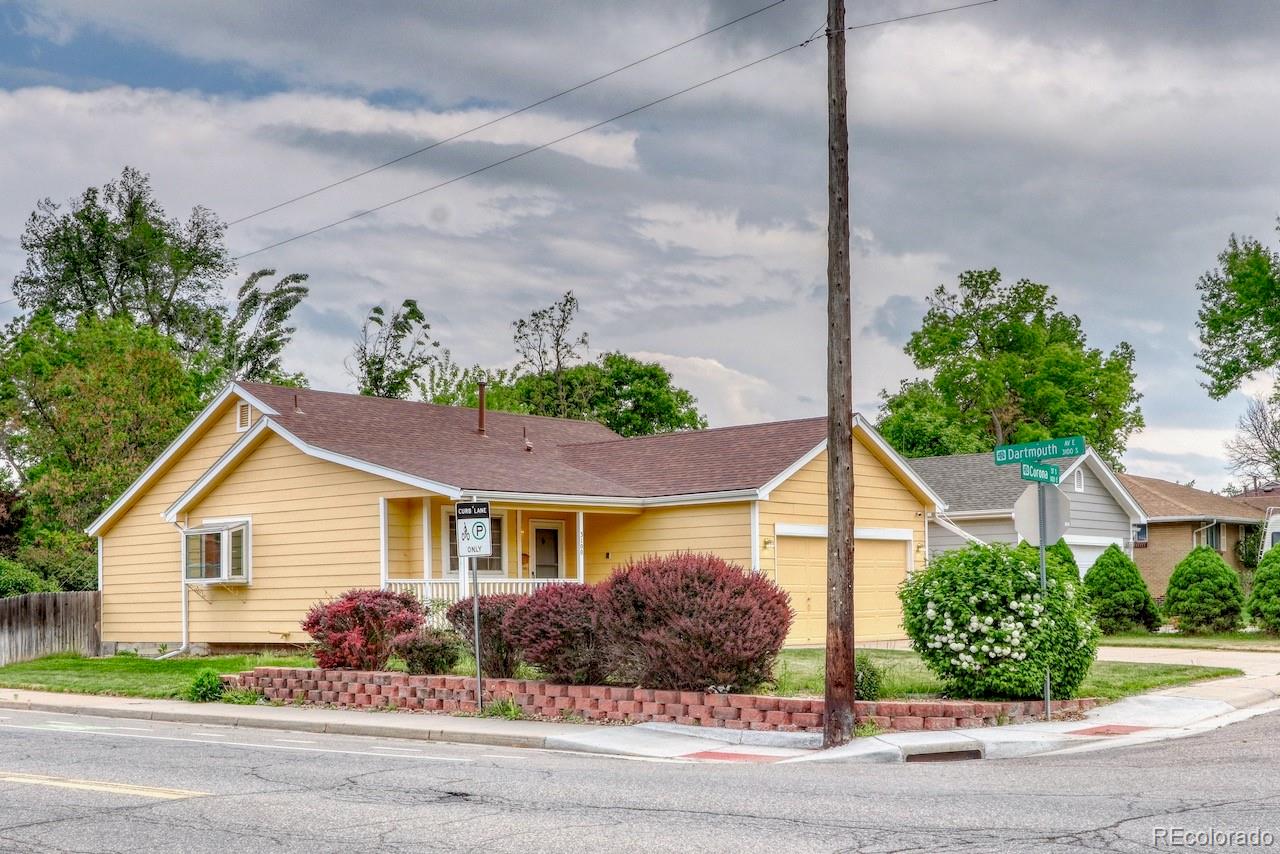
3100 S Corona St, Englewood, CO 80113
$-1,657
Cash flow
-12.7%
Cash-on-Cash Return
3.4%
Cap rate
0.5%
Rent to Value Ratio
Active
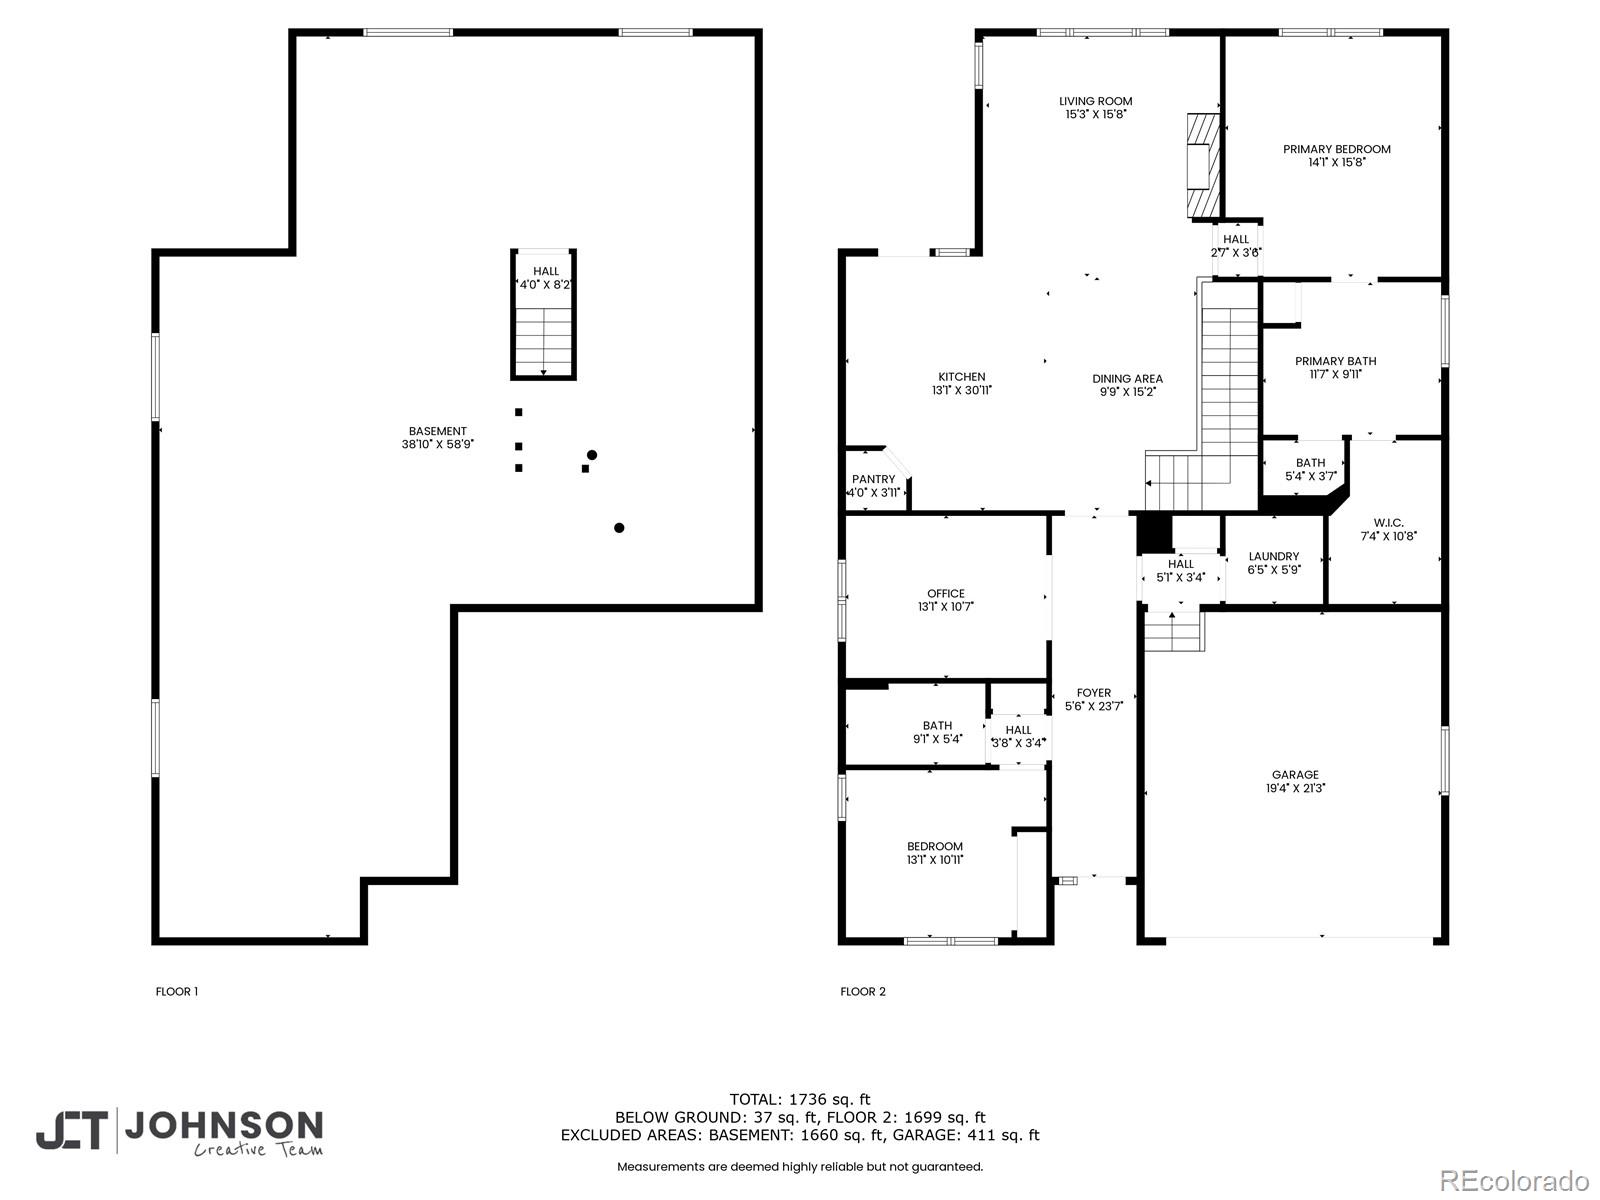
$775,000
4
bds
|
2
ba
|
1,736
sqft
|
built
1951
3577 S Pennsylvania St, Englewood, CO 80113
$-2,916
Cash flow
-19.6%
Cash-on-Cash Return
1.8%
Cap rate
0.3%
Rent to Value Ratio
Active
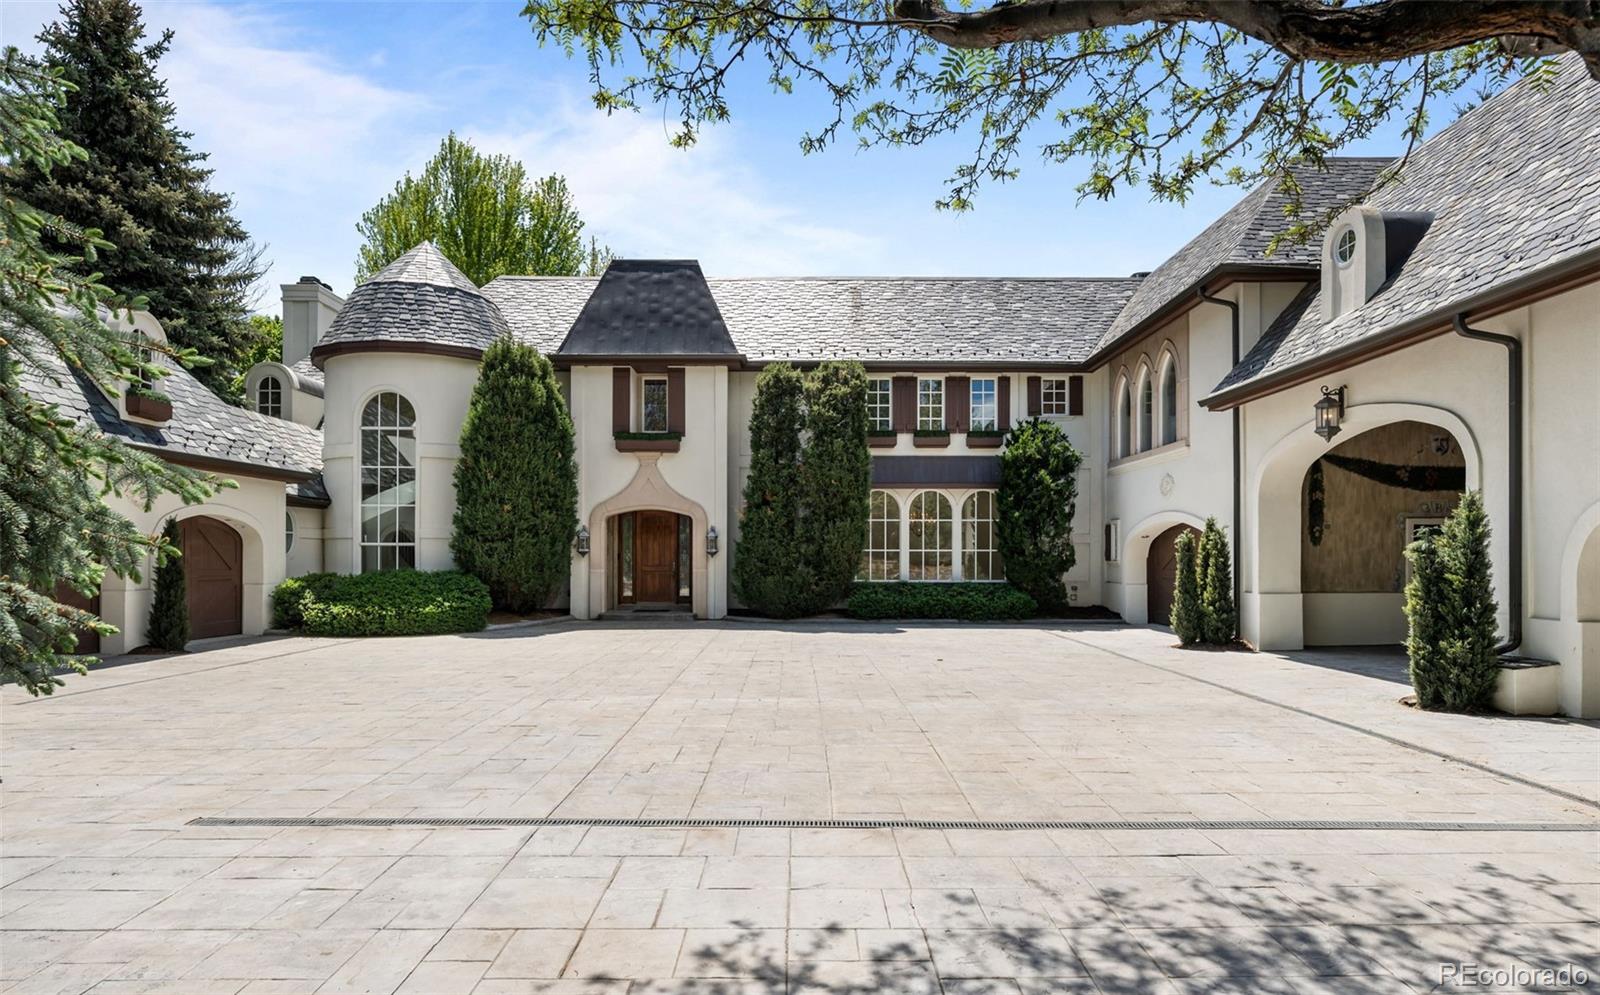
$8,650,000
5
bds
|
9
ba
|
12,356
sqft
|
built
1997
5 Churchill Dr, Englewood, CO 80113
$-42,613
Cash flow
-25.7%
Cash-on-Cash Return
0.4%
Cap rate
0.1%
Rent to Value Ratio
Active
$4,800,000
5
bds
|
6
ba
|
6,507
sqft
|
built
1977
4181 S Colorado Blvd, Englewood, CO 80113
$-22,252
Cash flow
-24.2%
Cash-on-Cash Return
0.7%
Cap rate
0.1%
Rent to Value Ratio
Active
$1,894,000
5
bds
|
5
ba
|
5,953
sqft
|
built
1985
5227 S Geneva St, Englewood, CO 80111
$-7,535
Cash flow
-20.8%
Cash-on-Cash Return
1.5%
Cap rate
0.3%
Rent to Value Ratio
Active
$599,950
3
bds
|
2
ba
|
1,856
sqft
|
built
1947
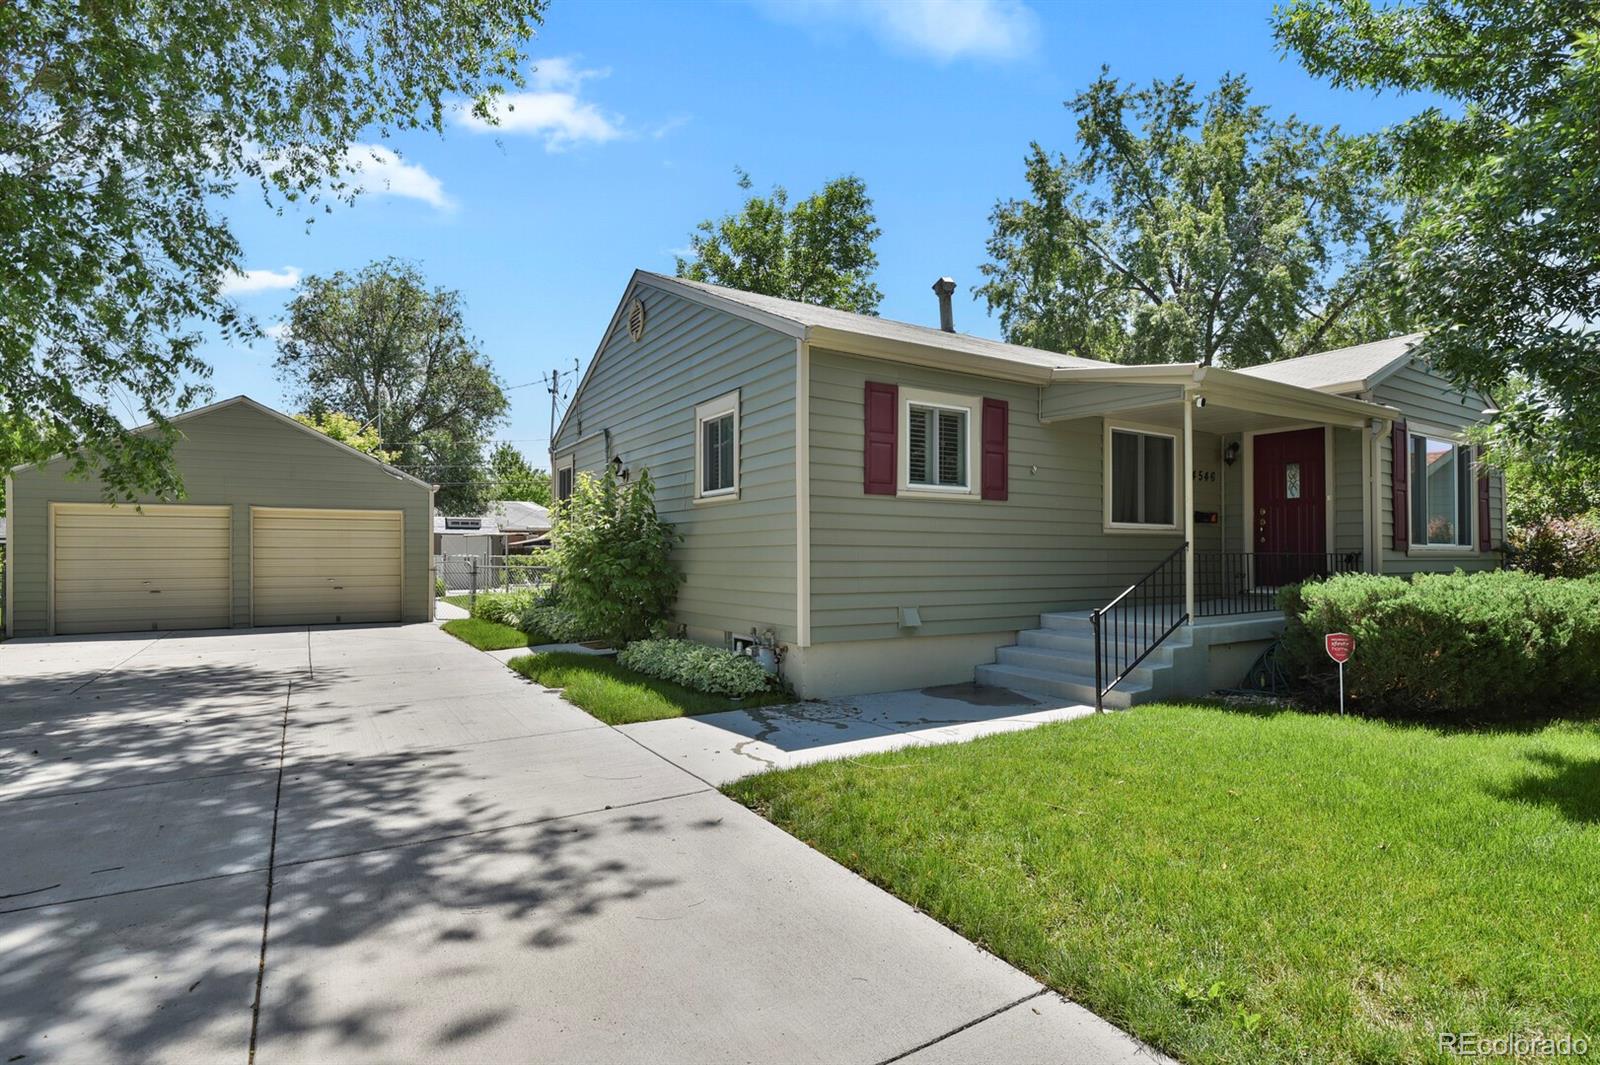
4546 S Logan St, Englewood, CO 80113
$-1,606
Cash flow
-14.0%
Cash-on-Cash Return
3.1%
Cap rate
0.4%
Rent to Value Ratio
Active
$455,000
2
bds
|
1
ba
|
1,260
sqft
|
built
1915
3768 S Acoma St, Englewood, CO 80110
$-837
Cash flow
-9.6%
Cash-on-Cash Return
4.1%
Cap rate
0.5%
Rent to Value Ratio
Active under contract
$899,000
4
bds
|
3
ba
|
2,824
sqft
|
built
1974
5616 S Kenton Ct, Englewood, CO 80111
$-2,733
Cash flow
-15.9%
Cash-on-Cash Return
2.6%
Cap rate
0.4%
Rent to Value Ratio
Active
$440,000
2
bds
|
1
ba
|
764
sqft
|
built
1943
3265 S Ogden St, Englewood, CO 80113
$-771
Cash flow
-9.1%
Cash-on-Cash Return
4.2%
Cap rate
0.6%
Rent to Value Ratio
Active
$424,900
2
bds
|
1
ba
|
828
sqft
|
built
1955
3940 S Hazel Ct, Englewood, CO 80110
$-930
Cash flow
-11.4%
Cash-on-Cash Return
3.7%
Cap rate
0.5%
Rent to Value Ratio
Active
$714,900
5
bds
|
3
ba
|
2,468
sqft
|
built
1959
4643 S Cherokee St, Englewood, CO 80110
$-1,510
Cash flow
-11.0%
Cash-on-Cash Return
3.7%
Cap rate
0.5%
Rent to Value Ratio
Active
$750,000
5
bds
|
3
ba
|
2,016
sqft
|
built
1963
4350 S Delaware St, Englewood, CO 80110
$-2,327
Cash flow
-16.2%
Cash-on-Cash Return
2.6%
Cap rate
0.3%
Rent to Value Ratio
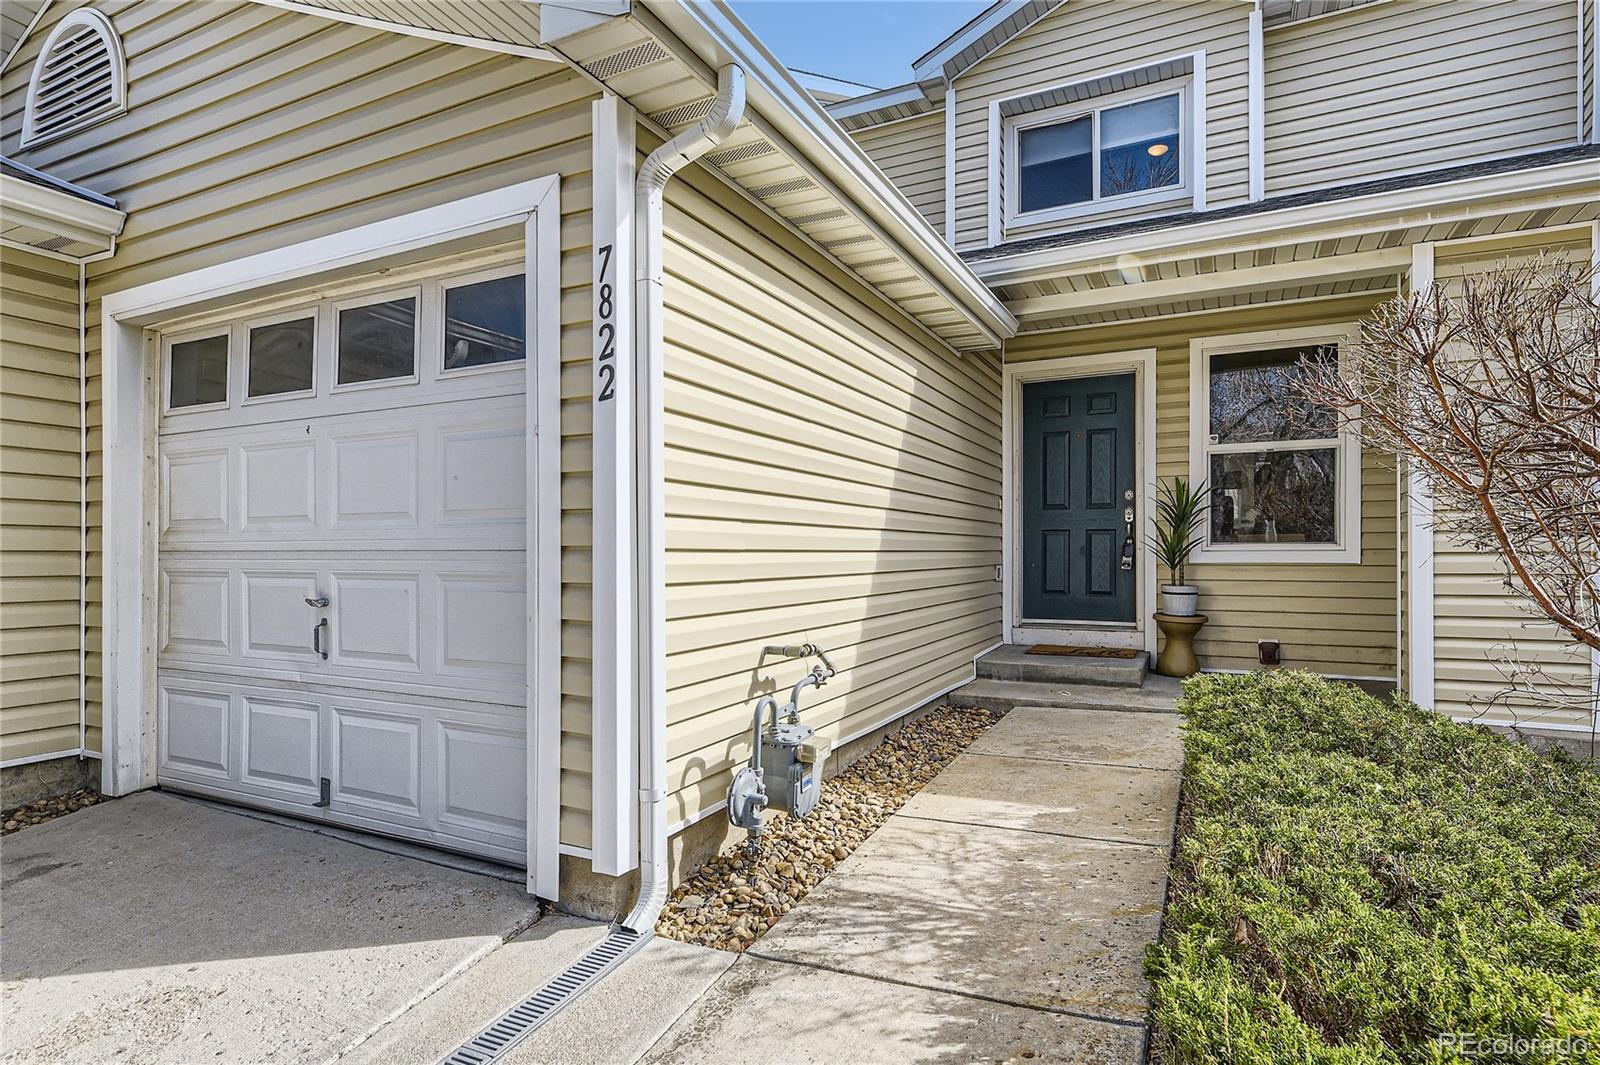
Active
$400,000
3
bds
|
2
ba
|
1,240
sqft
|
built
2001
7822 S Kittredge Cir, Englewood, CO 80112
$-1,073
Cash flow
-14.0%
Cash-on-Cash Return
3.1%
Cap rate
0.6%
Rent to Value Ratio
Active
$859,000
4
bds
|
4
ba
|
2,585
sqft
|
built
1979
10724 E Maplewood Pl, Englewood, CO 80111
$-2,566
Cash flow
-15.6%
Cash-on-Cash Return
2.7%
Cap rate
0.4%
Rent to Value Ratio
Active
$460,000
2
bds
|
1
ba
|
600
sqft
|
built
1915
3074 S Elati St, Englewood, CO 80110
$-1,184
Cash flow
-13.4%
Cash-on-Cash Return
3.2%
Cap rate
0.4%
Rent to Value Ratio
Active
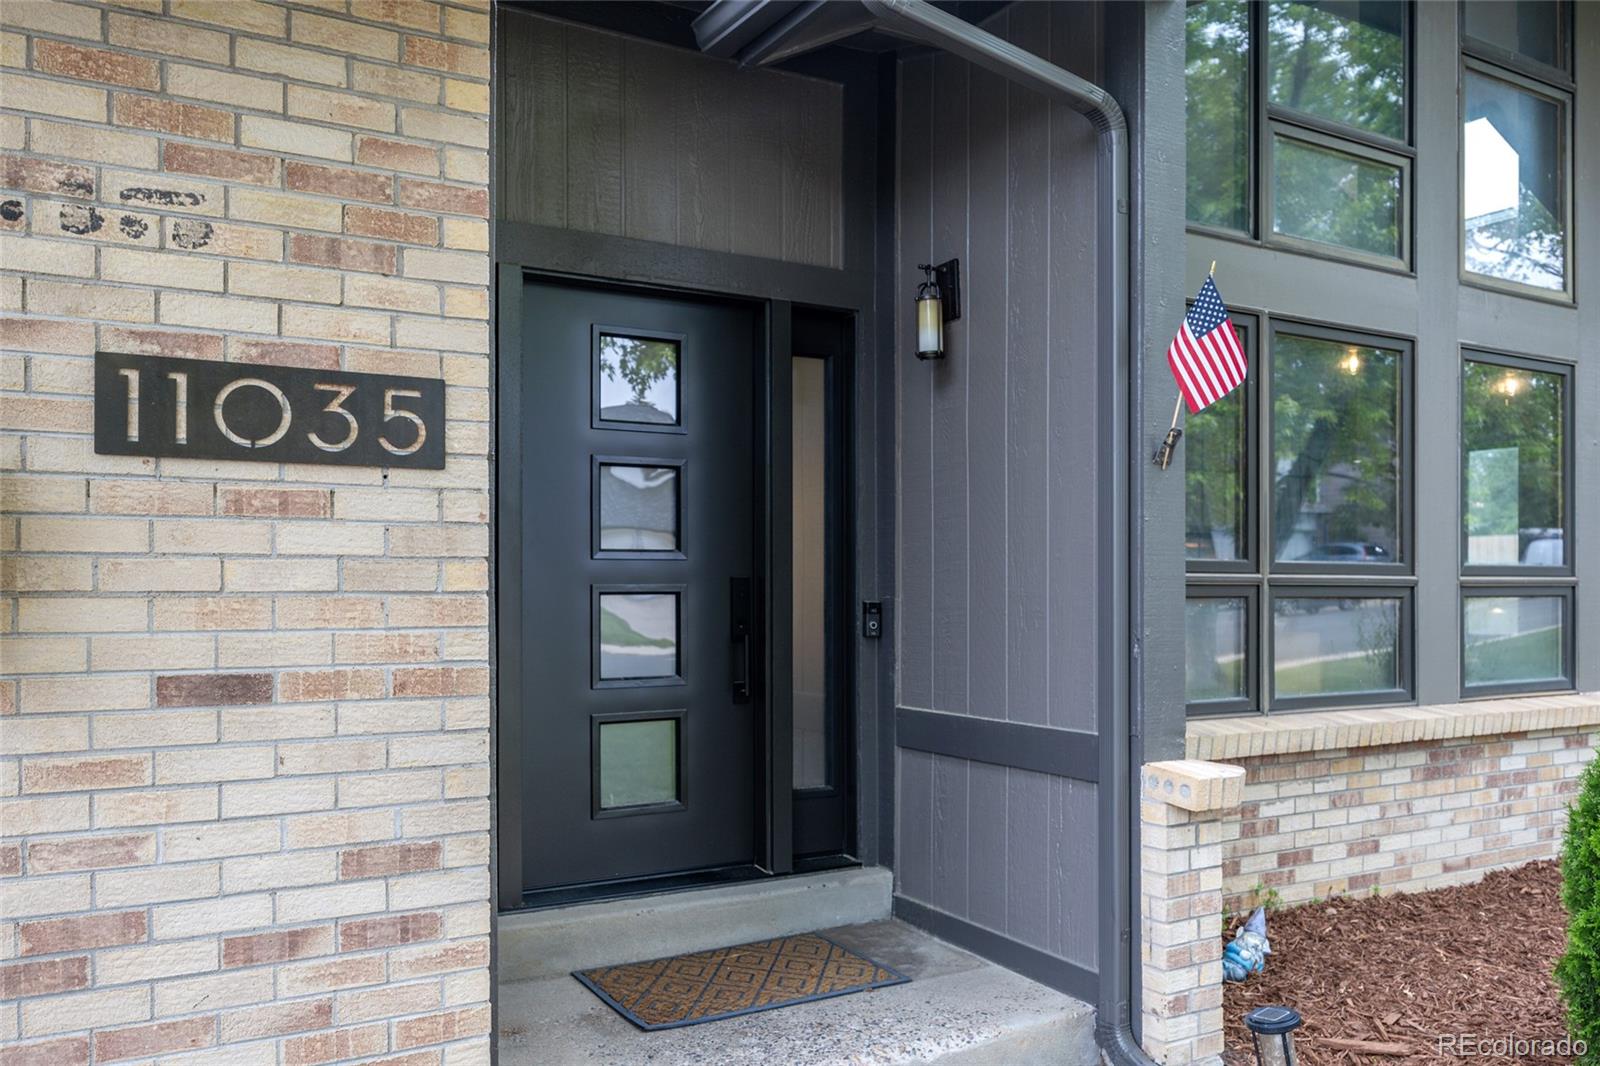
$875,000
4
bds
|
3
ba
|
2,917
sqft
|
built
1976
11035 E Berry Ave, Englewood, CO 80111
$-2,537
Cash flow
-15.1%
Cash-on-Cash Return
2.8%
Cap rate
0.4%
Rent to Value Ratio
Active
$1,325,000
4
bds
|
4
ba
|
3,290
sqft
|
built
1936
2805 S Sherman St, Englewood, CO 80113
$-3,983
Cash flow
-15.7%
Cash-on-Cash Return
2.7%
Cap rate
0.4%
Rent to Value Ratio
Active
$2,050,000
5
bds
|
5
ba
|
5,121
sqft
|
built
1985
10293 E Sheri Ln, Englewood, CO 80111
$-8,288
Cash flow
-21.1%
Cash-on-Cash Return
1.4%
Cap rate
0.2%
Rent to Value Ratio
Active
$645,000
2
bds
|
2
ba
|
1,387
sqft
|
built
2008
10111 Inverness Main St, Englewood, CO 80112
$-2,048
Cash flow
-16.6%
Cash-on-Cash Return
2.5%
Cap rate
0.5%
Rent to Value Ratio
Active
$202,999
1
bds
|
1
ba
|
709
sqft
|
built
1979
9867 E Peakview Ave, Englewood, CO 80111
$-193
Cash flow
-5.0%
Cash-on-Cash Return
5.1%
Cap rate
1.0%
Rent to Value Ratio
Active
$3,195,000
6
bds
|
6
ba
|
6,183
sqft
|
built
1971
4285 S Hudson Pkwy, Englewood, CO 80113
$-14,106
Cash flow
-23.0%
Cash-on-Cash Return
1.0%
Cap rate
0.2%
Rent to Value Ratio

Active
$420,000
3
bds
|
3
ba
|
1,771
sqft
|
built
1988
6475 S Dayton St, Englewood, CO 80111
$-1,272
Cash flow
-15.8%
Cash-on-Cash Return
2.6%
Cap rate
0.6%
Rent to Value Ratio
Active
$3,995,000
5
bds
|
6
ba
|
7,511
sqft
|
built
1993
6180 E Quincy Ave, Englewood, CO 80111
$-18,037
Cash flow
-23.6%
Cash-on-Cash Return
0.9%
Cap rate
0.2%
Rent to Value Ratio
Active
$675,000
3
bds
|
2
ba
|
1,490
sqft
|
built
1920
3680 S Logan St, Englewood, CO 80113
$-1,813
Cash flow
-14.0%
Cash-on-Cash Return
3.1%
Cap rate
0.4%
Rent to Value Ratio
Active
$275,000
2
bds
|
1
ba
|
825
sqft
|
built
1979
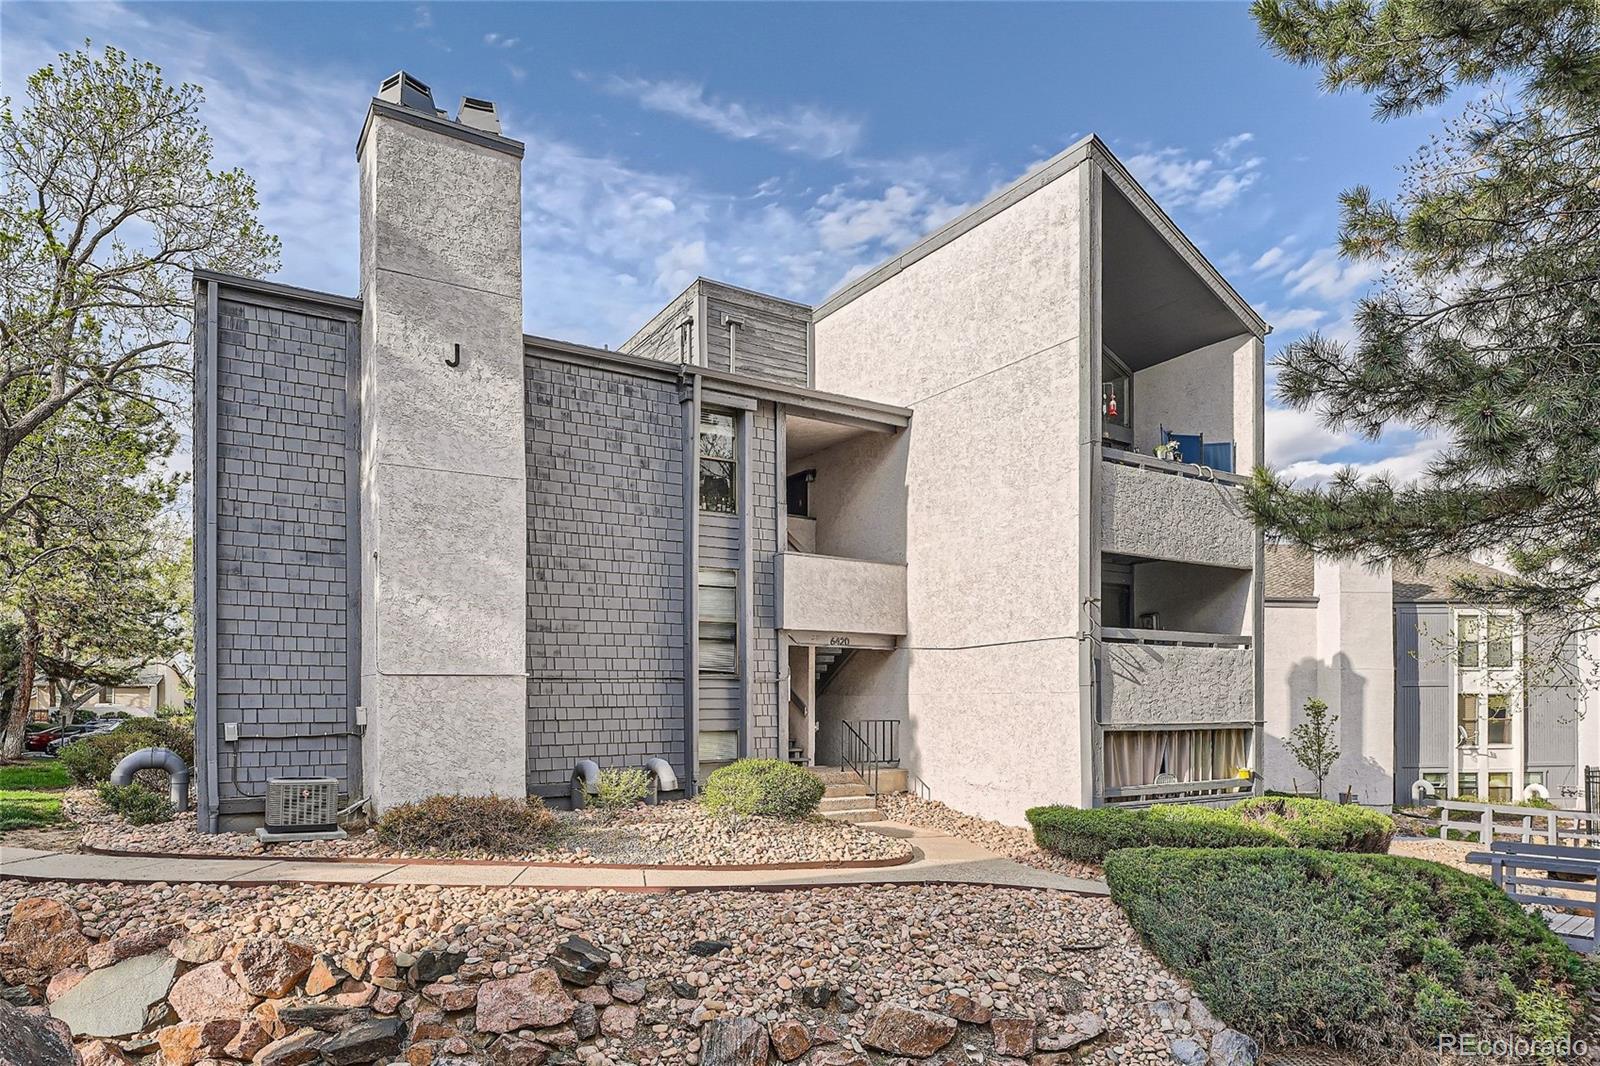
6420 S Dayton St, Englewood, CO 80111
$-818
Cash flow
-15.5%
Cash-on-Cash Return
2.7%
Cap rate
0.6%
Rent to Value Ratio
Active
$725,000
3
bds
|
2
ba
|
1,801
sqft
|
built
2015
12677 Fisher Dr, Englewood, CO 80112
$-2,153
Cash flow
-15.5%
Cash-on-Cash Return
2.7%
Cap rate
0.4%
Rent to Value Ratio

Active
$345,000
2
bds
|
2
ba
|
1,110
sqft
|
built
1984
10303 E Peakview Ave, Englewood, CO 80111
$-960
Cash flow
-14.5%
Cash-on-Cash Return
2.9%
Cap rate
0.6%
Rent to Value Ratio
Active
$499,000
2
bds
|
1
ba
|
1,223
sqft
|
built
1923
4196 S Pennsylvania St, Englewood, CO 80113
$-1,103
Cash flow
-11.5%
Cash-on-Cash Return
3.6%
Cap rate
0.5%
Rent to Value Ratio
Active
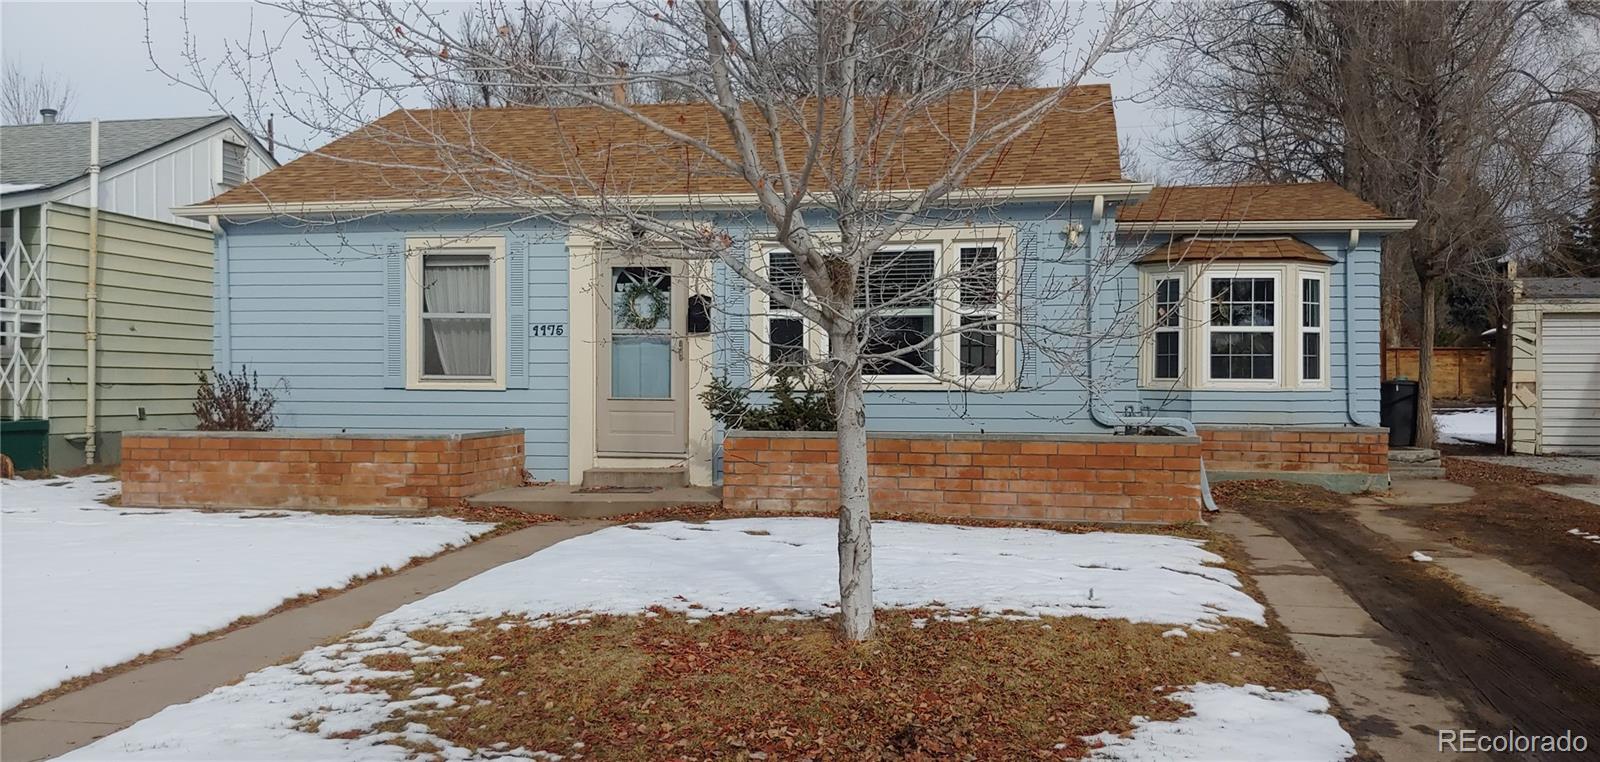
$499,000
2
bds
|
1
ba
|
970
sqft
|
built
1941
1175 E Bates Pkwy, Englewood, CO 80113
$-1,062
Cash flow
-11.1%
Cash-on-Cash Return
3.7%
Cap rate
0.5%
Rent to Value Ratio
Active
$775,000
3
bds
|
2
ba
|
1,661
sqft
|
built
1959
3285 S Emerson St, Englewood, CO 80113
$-2,526
Cash flow
-17.0%
Cash-on-Cash Return
2.4%
Cap rate
0.3%
Rent to Value Ratio
Active
$599,900
3
bds
|
2
ba
|
1,290
sqft
|
built
1958
4745 S Sherman St, Englewood, CO 80113
$-2,183
Cash flow
-19.0%
Cash-on-Cash Return
1.9%
Cap rate
0.3%
Rent to Value Ratio
Active
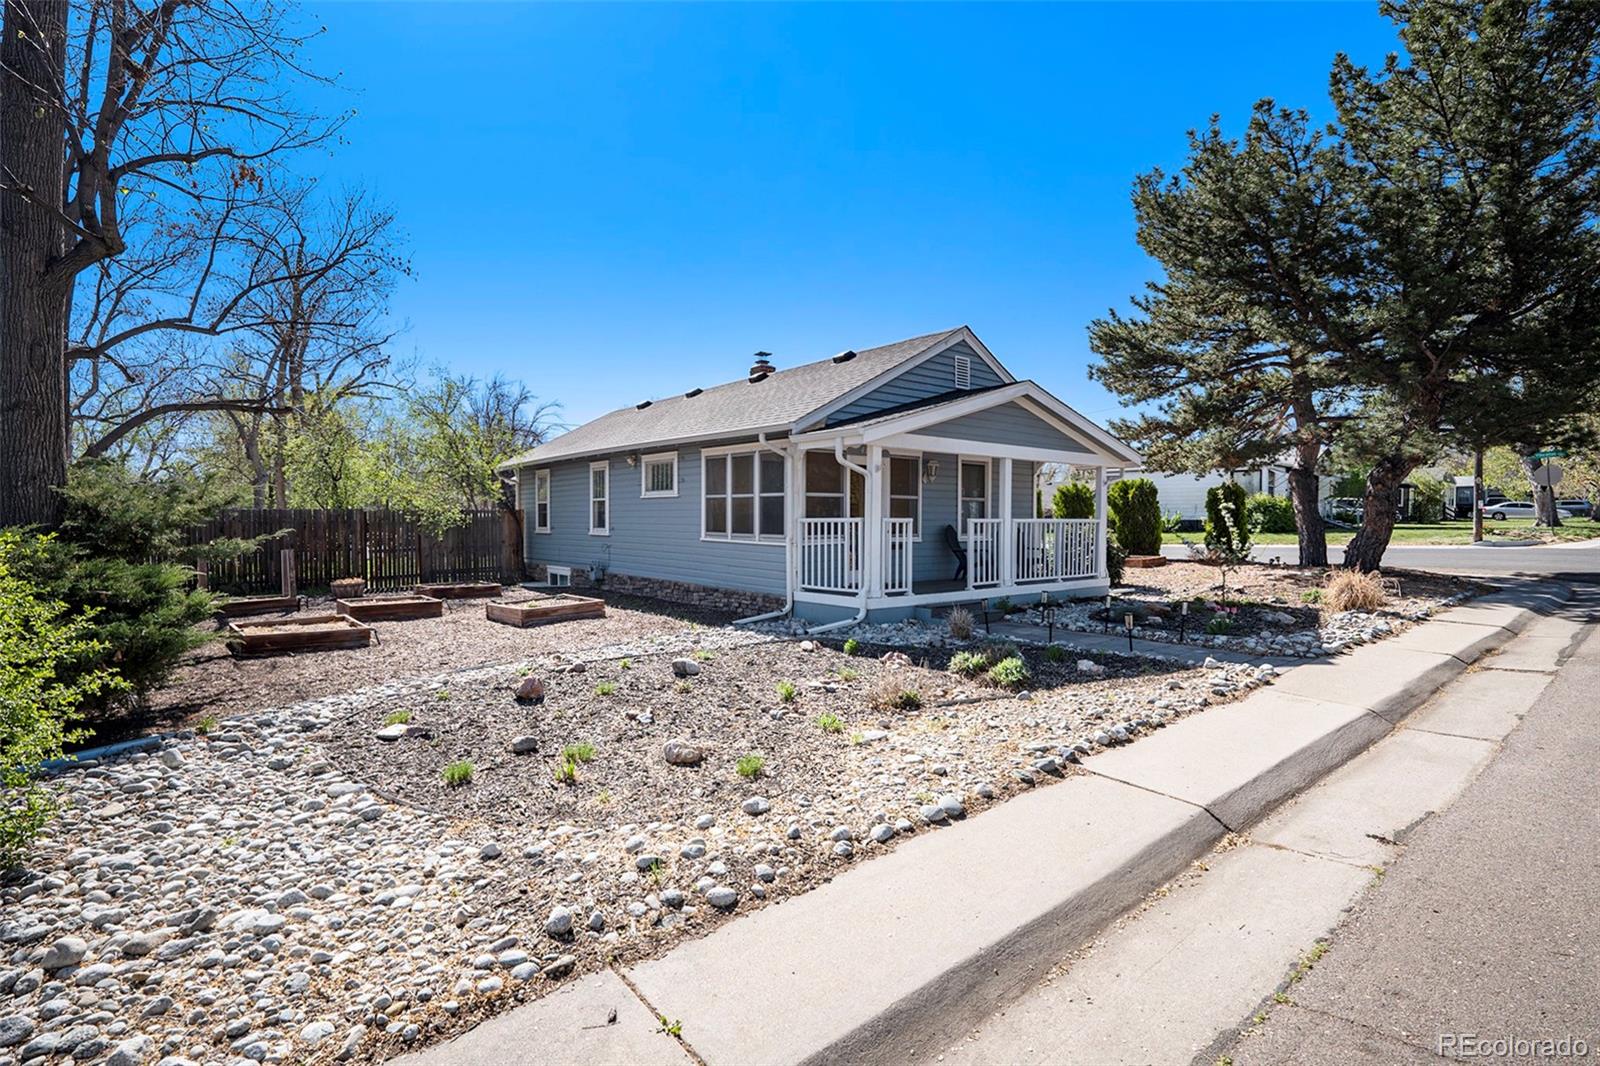
$449,900
4
bds
|
1
ba
|
1,260
sqft
|
built
1956
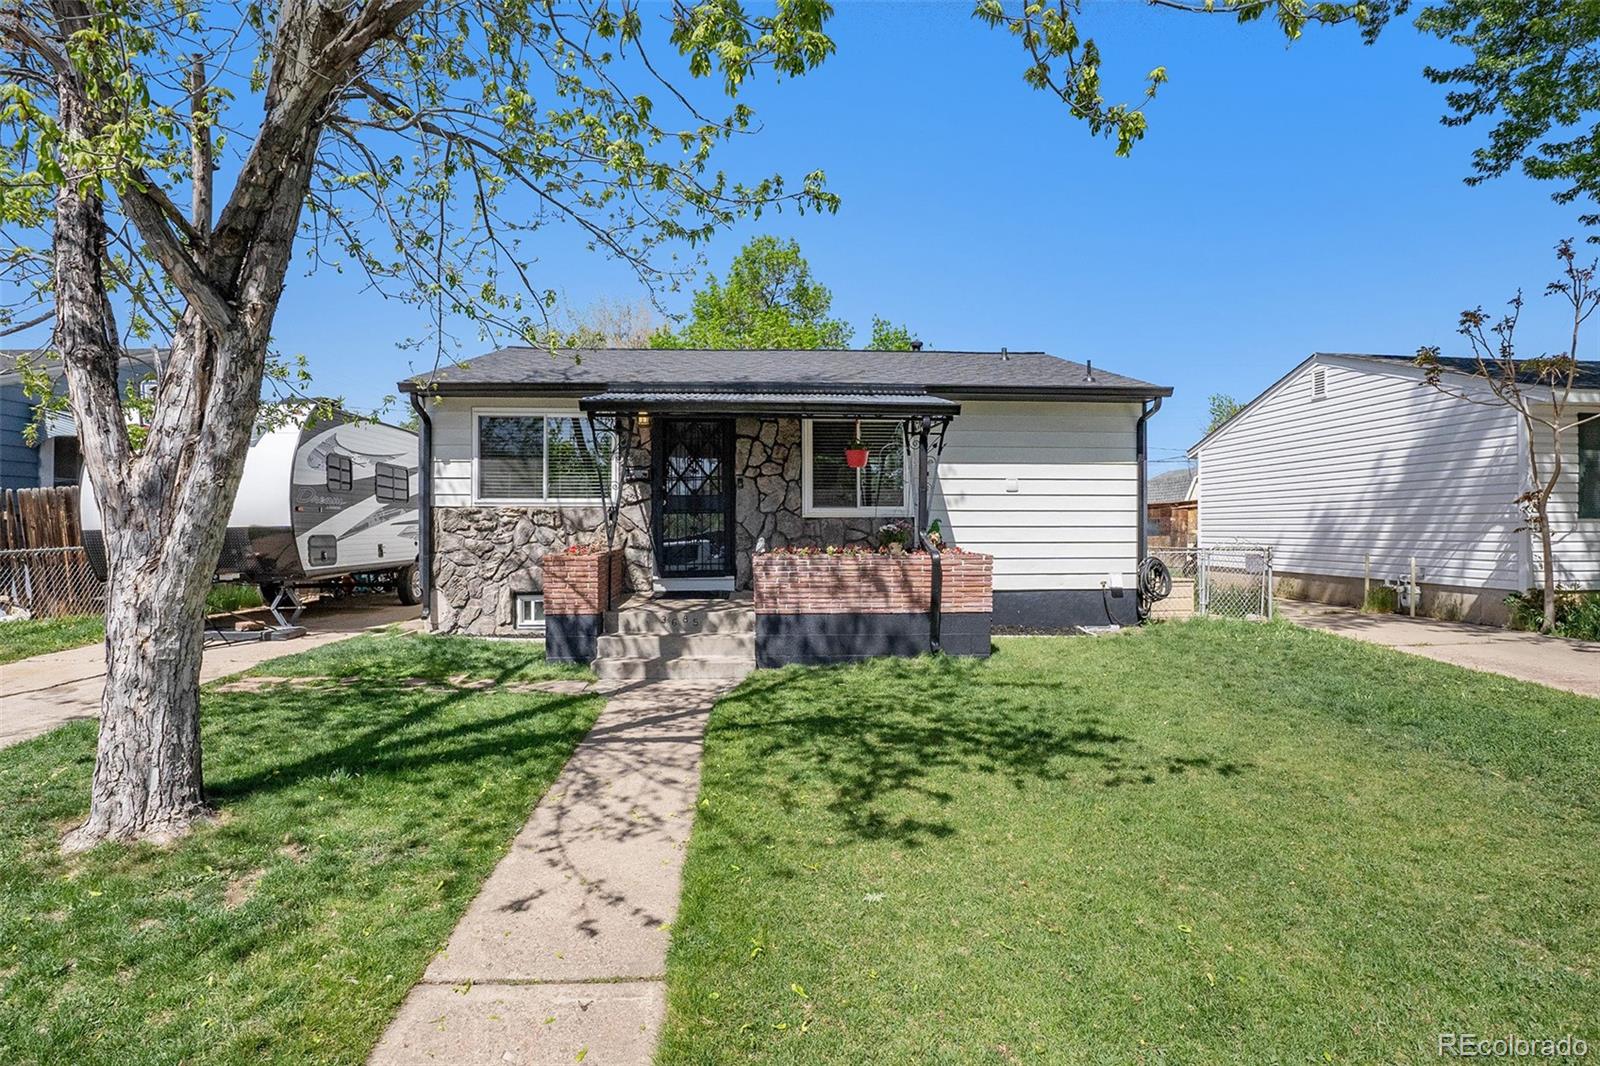
3685 S Hooker St, Englewood, CO 80110
$-847
Cash flow
-9.8%
Cash-on-Cash Return
4.0%
Cap rate
0.6%
Rent to Value Ratio
Active
$440,000
2
bds
|
2
ba
|
1,158
sqft
|
built
2008
10111 Inverness Main St, Englewood, CO 80112
$-1,356
Cash flow
-16.1%
Cash-on-Cash Return
2.6%
Cap rate
0.5%
Rent to Value Ratio
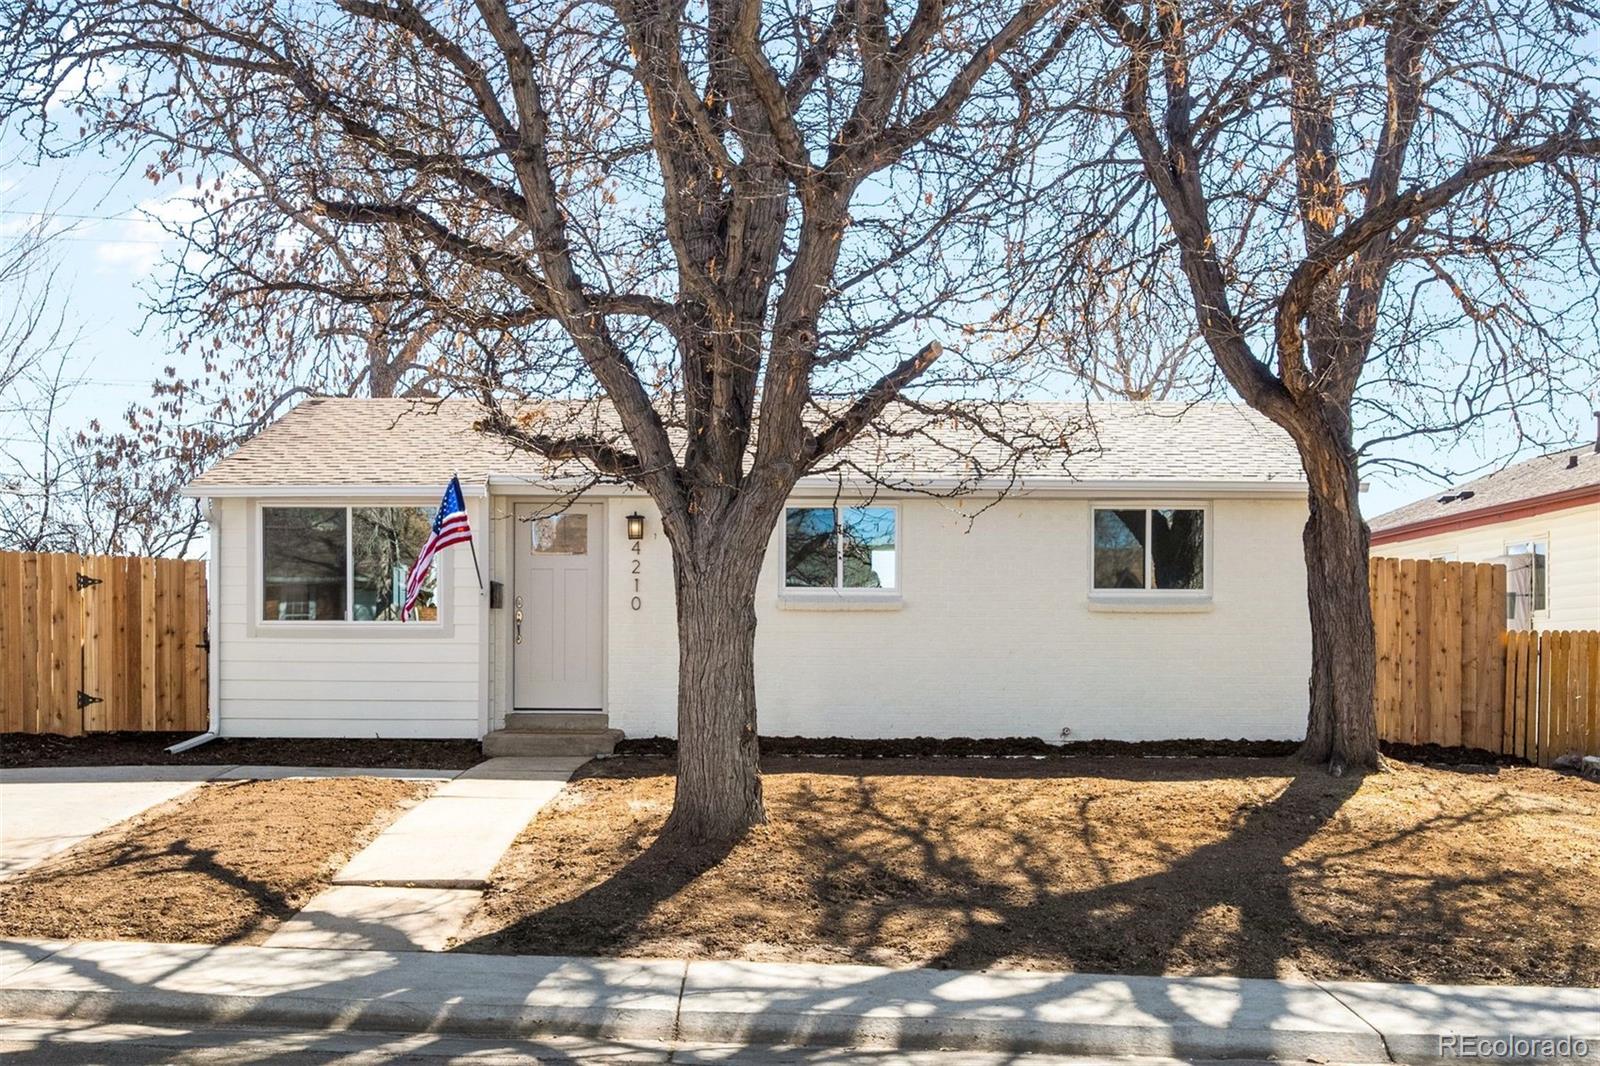
Active
$440,000
3
bds
|
1
ba
|
837
sqft
|
built
1965
4210 S Dale Ct, Englewood, CO 80110
$-1,035
Cash flow
-12.3%
Cash-on-Cash Return
3.5%
Cap rate
0.5%
Rent to Value Ratio
Active
$975,000
4
bds
|
4
ba
|
2,411
sqft
|
built
1979
11323 E Cimmarron Dr, Englewood, CO 80111
$-3,445
Cash flow
-18.4%
Cash-on-Cash Return
2.0%
Cap rate
0.3%
Rent to Value Ratio
Active
$295,000
1
bds
|
1
ba
|
701
sqft
|
built
2006
7292 S Blackhawk St, Englewood, CO 80112
$-989
Cash flow
-17.5%
Cash-on-Cash Return
2.3%
Cap rate
0.5%
Rent to Value Ratio
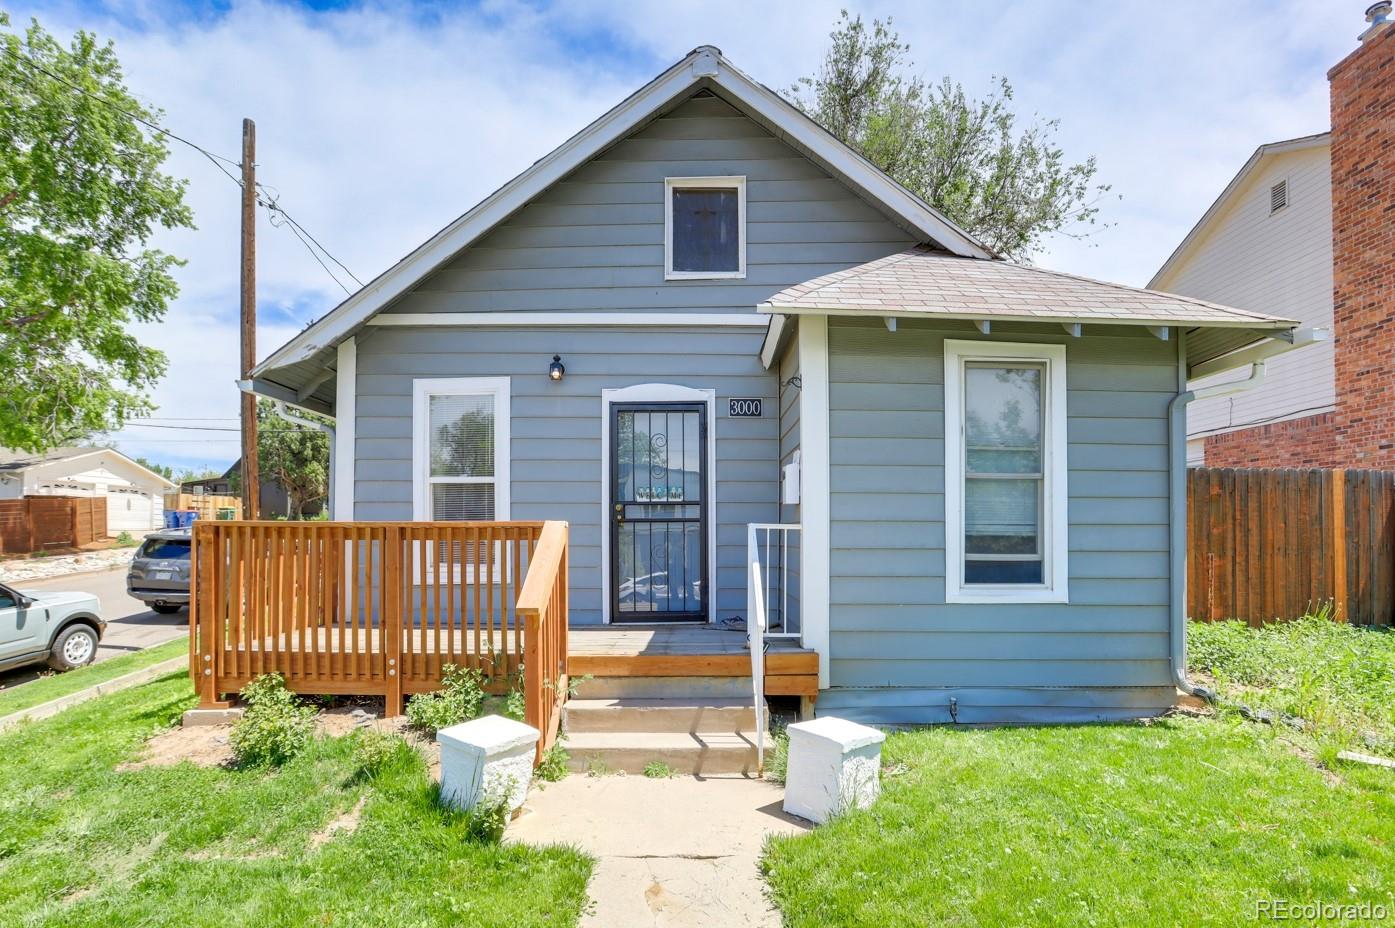
Active
$895,000
5
bds
|
3
ba
|
2,587
sqft
|
built
1910
3000 S Sherman St, Englewood, CO 80113
$-3,024
Cash flow
-17.6%
Cash-on-Cash Return
2.2%
Cap rate
0.3%
Rent to Value Ratio
Active
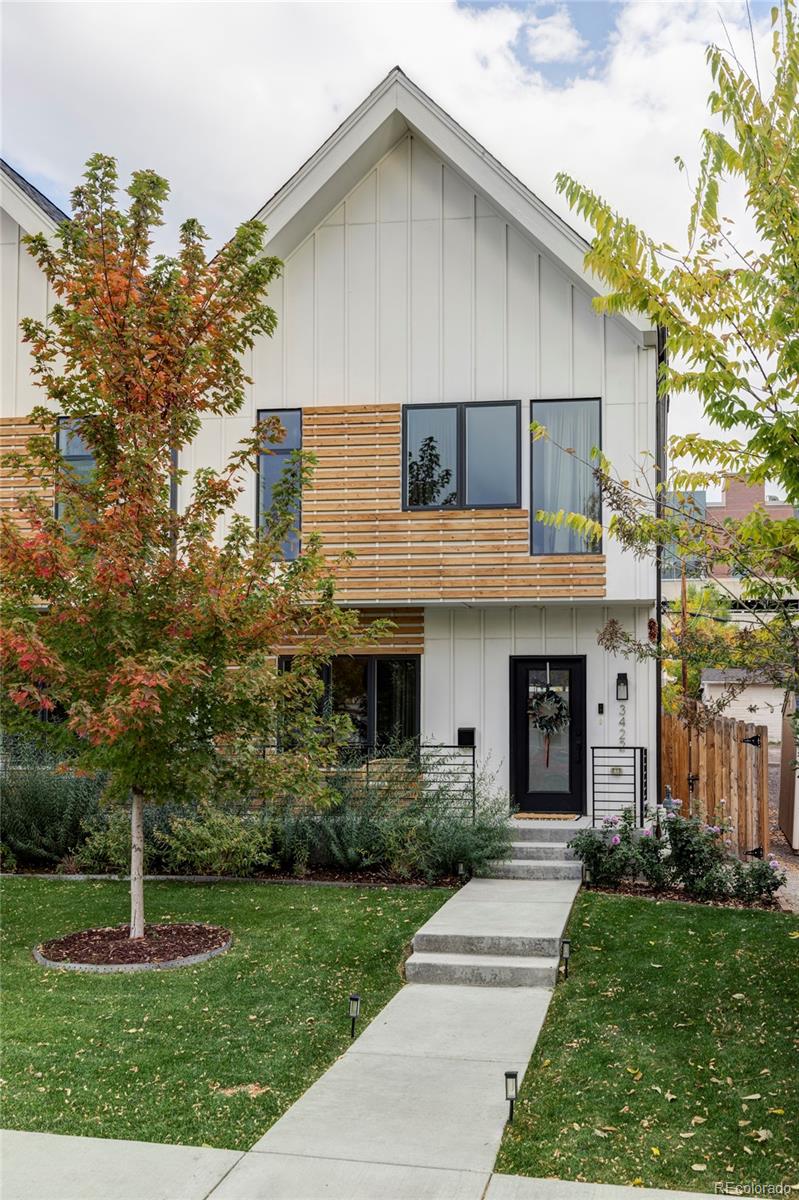
$895,000
4
bds
|
4
ba
|
2,898
sqft
|
built
2021
3422 S Grant St, Englewood, CO 80113
$-2,306
Cash flow
-13.4%
Cash-on-Cash Return
3.2%
Cap rate
0.4%
Rent to Value Ratio