Englewood, CO Investment Properties for Sale
Browse homes for sale and investment properties in Englewood, CO. Refine your search by price, property type, or more.
Best cash flowing properties in Englewood, CO
Active
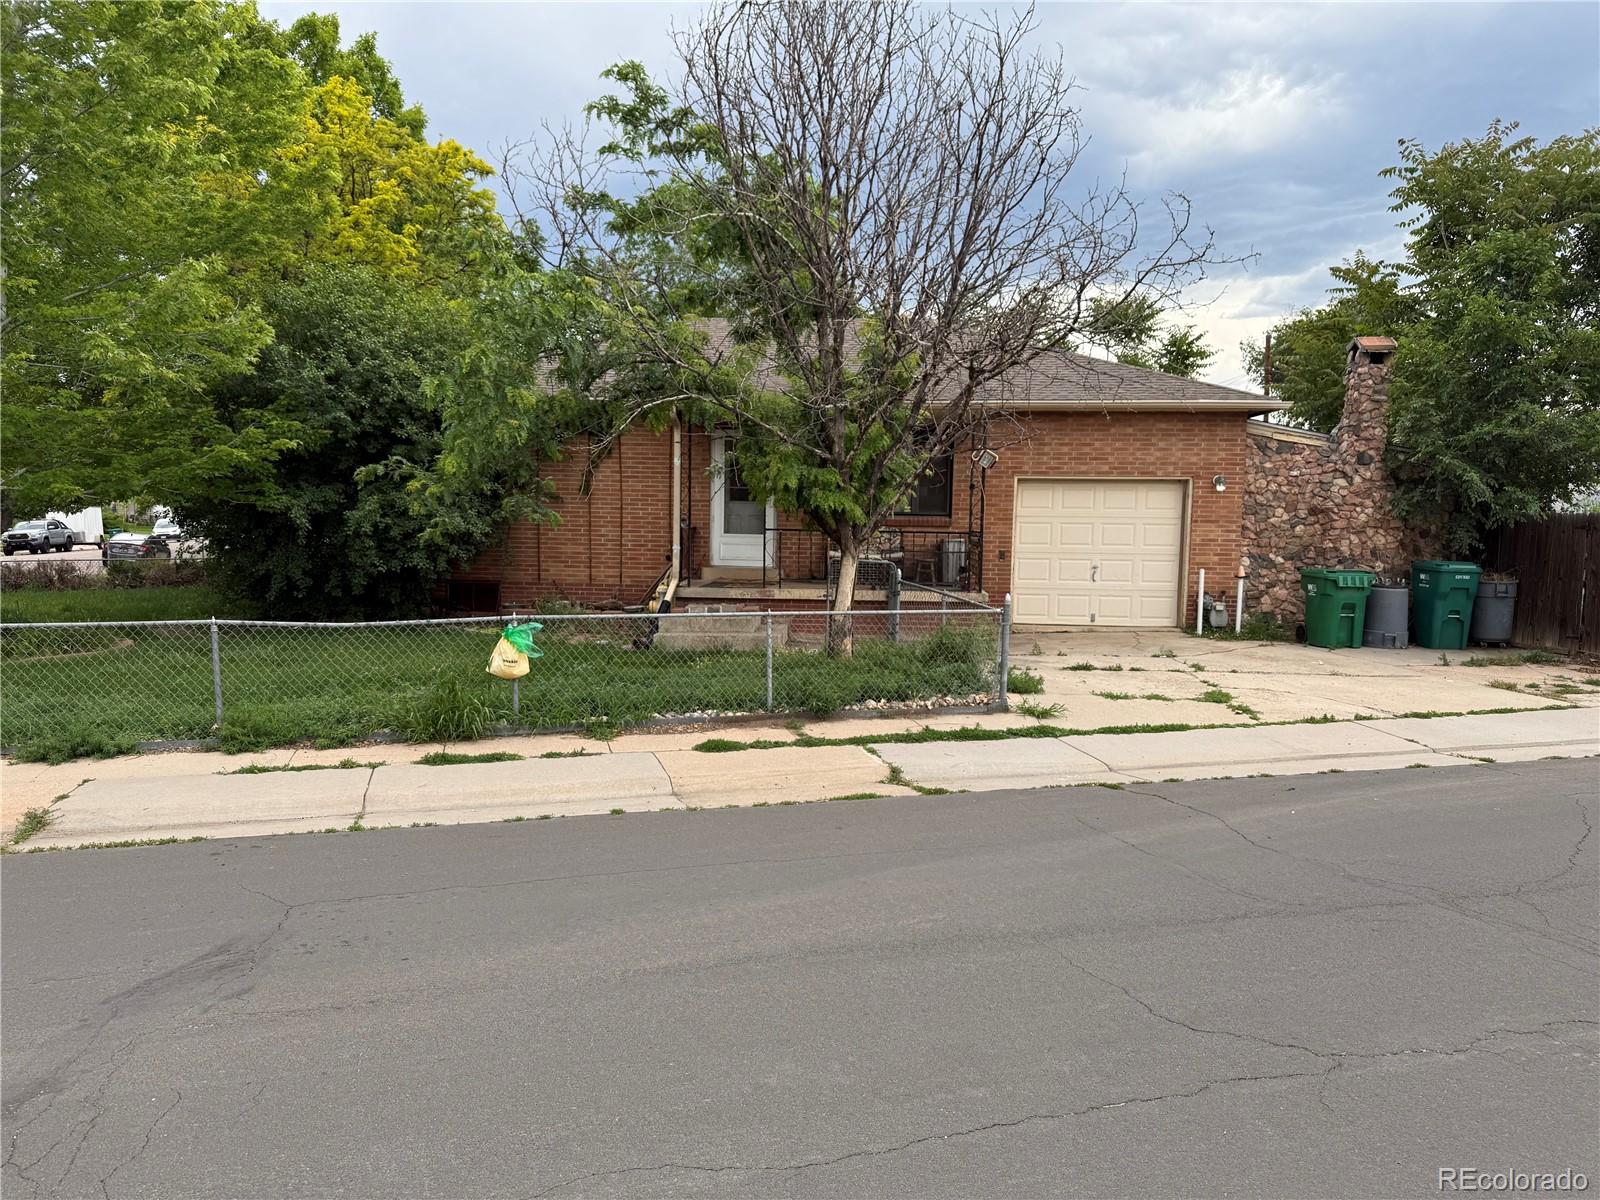
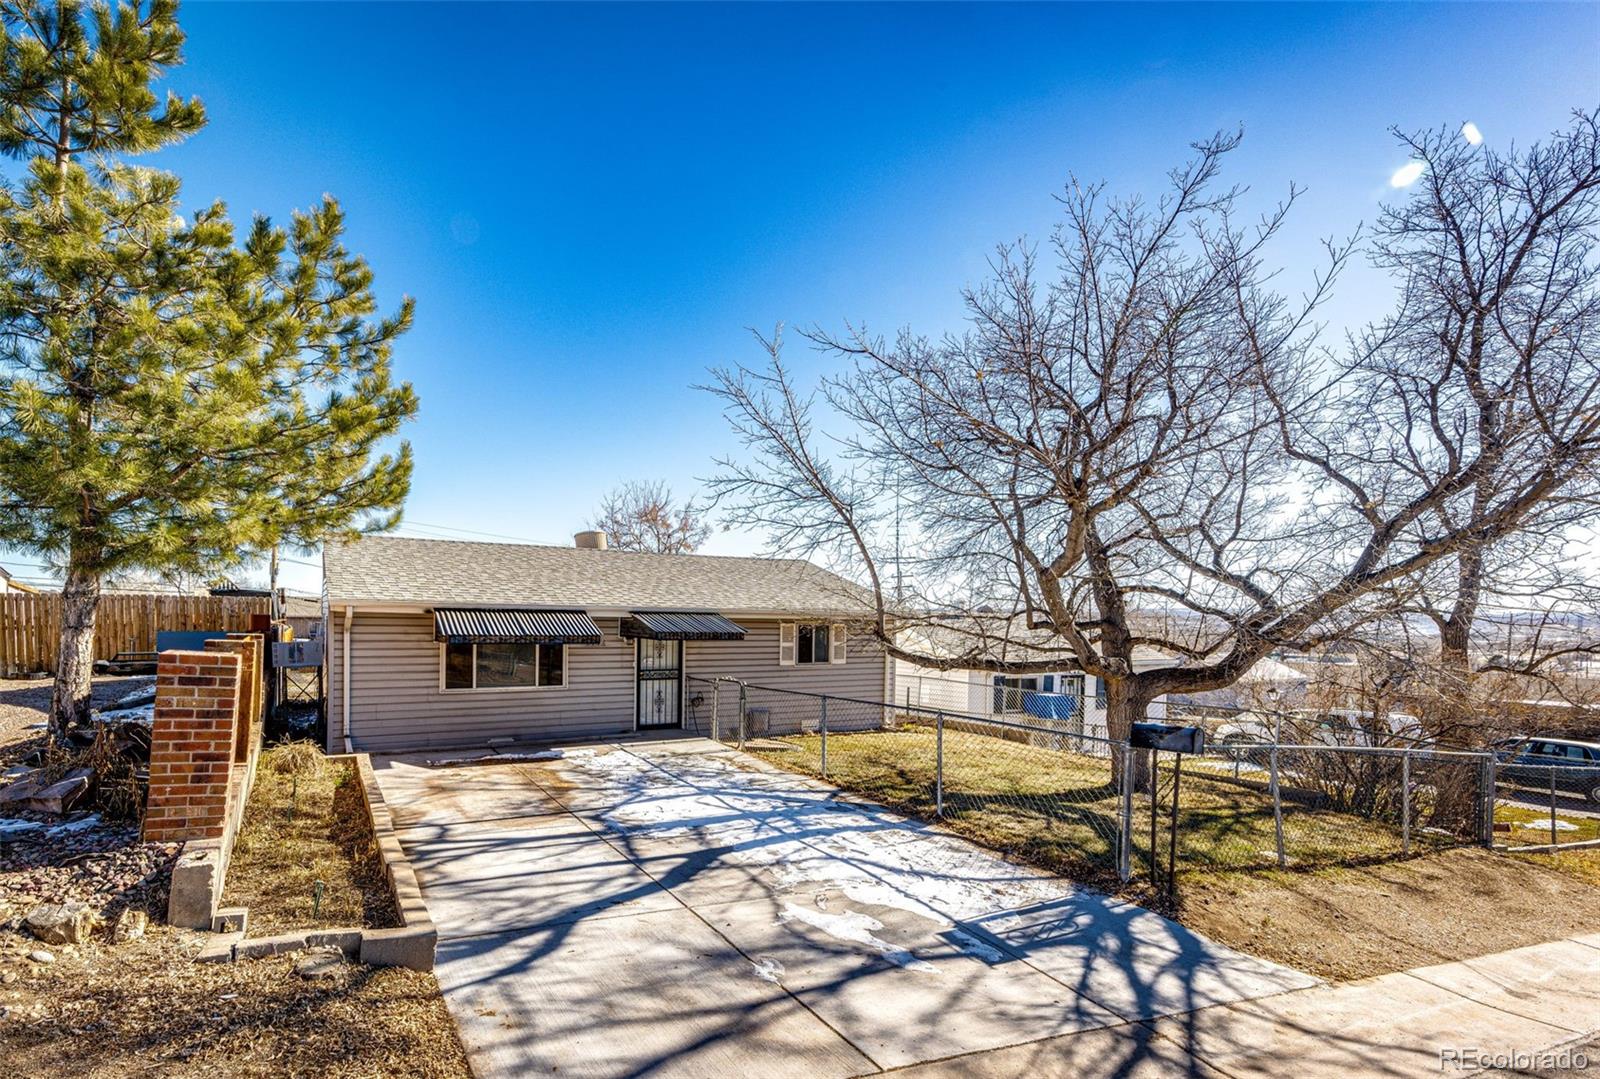
$400,000
3
bds
|
1
ba
|
1,563
sqft
|
built
1953
595 W Eastman Ave, Englewood, CO 80110
$-191
Cash flow
-2.5%
Cash-on-Cash Return
5.1%
Cap rate
0.7%
Rent to Value Ratio
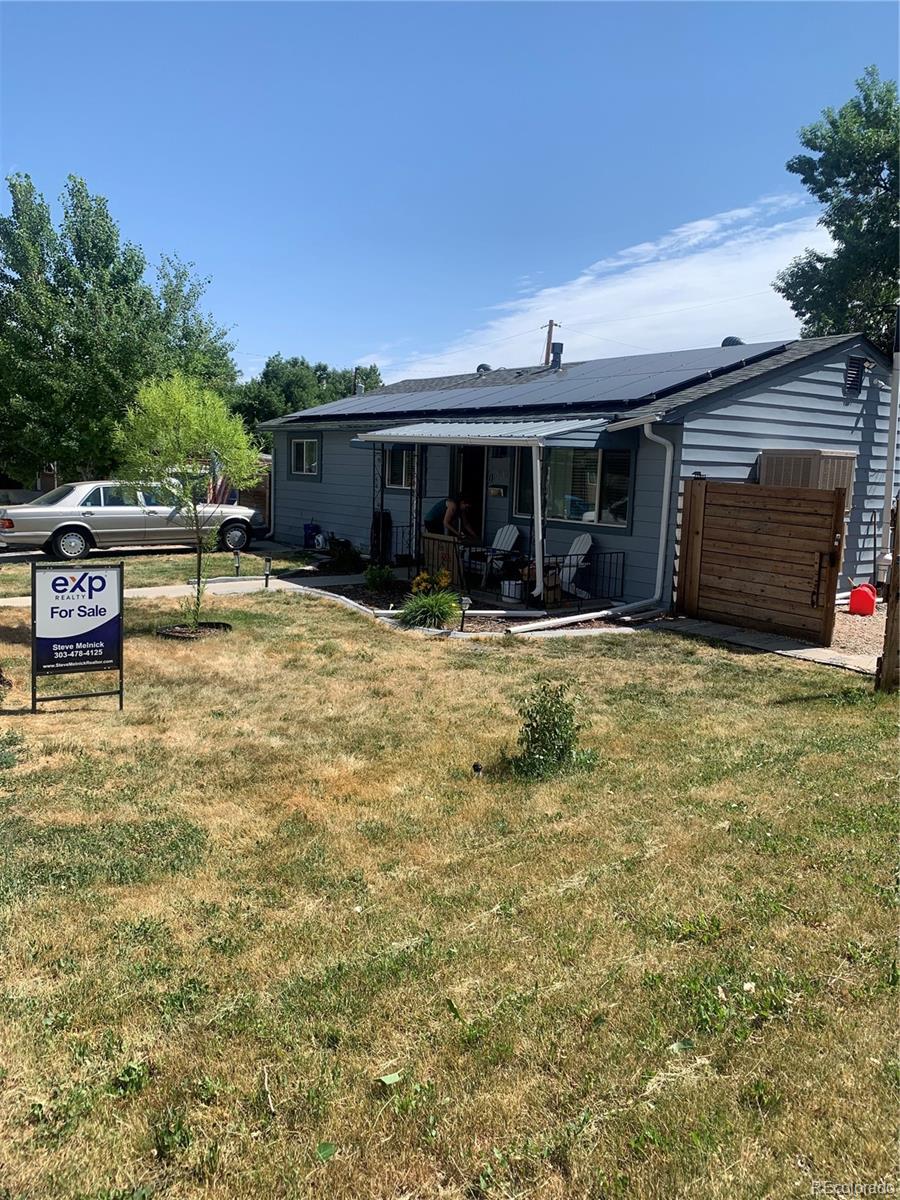
Closed
$360,000
3
bds
|
1
ba
|
1,150
sqft
|
built
1959
3930 S Hazel Ct, Englewood, CO 80110
$-352
Cash flow
-5.1%
Cash-on-Cash Return
4.5%
Cap rate
0.6%
Rent to Value Ratio
154 out of 156 properties for sale in Englewood, CO
Limited Results Shown
Create a free account, or log in to reveal all property listings and enjoy the complete experience.
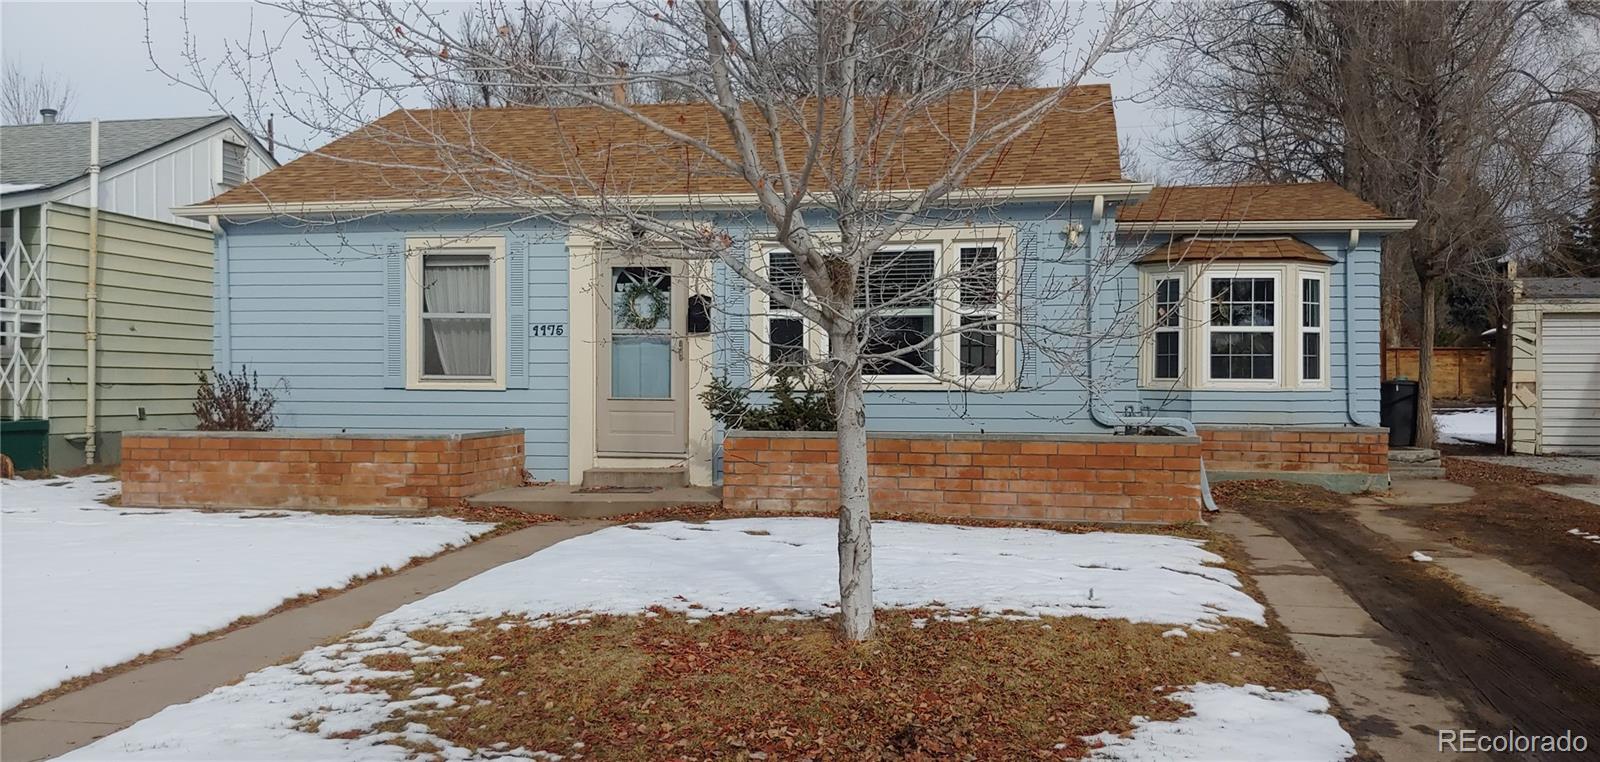
Active
$599,000
4
bds
|
3
ba
|
2,197
sqft
|
built
1960
3395 W Union Ave, Englewood, CO 80110
$-933
Cash flow
-8.1%
Cash-on-Cash Return
3.8%
Cap rate
0.5%
Rent to Value Ratio
Active
$975,000
4
bds
|
4
ba
|
2,411
sqft
|
built
1979
11323 E Cimmarron Dr, Englewood, CO 80111
$-2,953
Cash flow
-15.8%
Cash-on-Cash Return
2.0%
Cap rate
0.3%
Rent to Value Ratio
Active
$499,000
2
bds
|
1
ba
|
970
sqft
|
built
1941
1175 E Bates Pkwy, Englewood, CO 80113
$-810
Cash flow
-8.5%
Cash-on-Cash Return
3.7%
Cap rate
0.5%
Rent to Value Ratio
Active
$759,900
3
bds
|
2
ba
|
1,661
sqft
|
built
1959
3285 S Emerson St, Englewood, CO 80113
$-2,064
Cash flow
-14.2%
Cash-on-Cash Return
2.4%
Cap rate
0.3%
Rent to Value Ratio
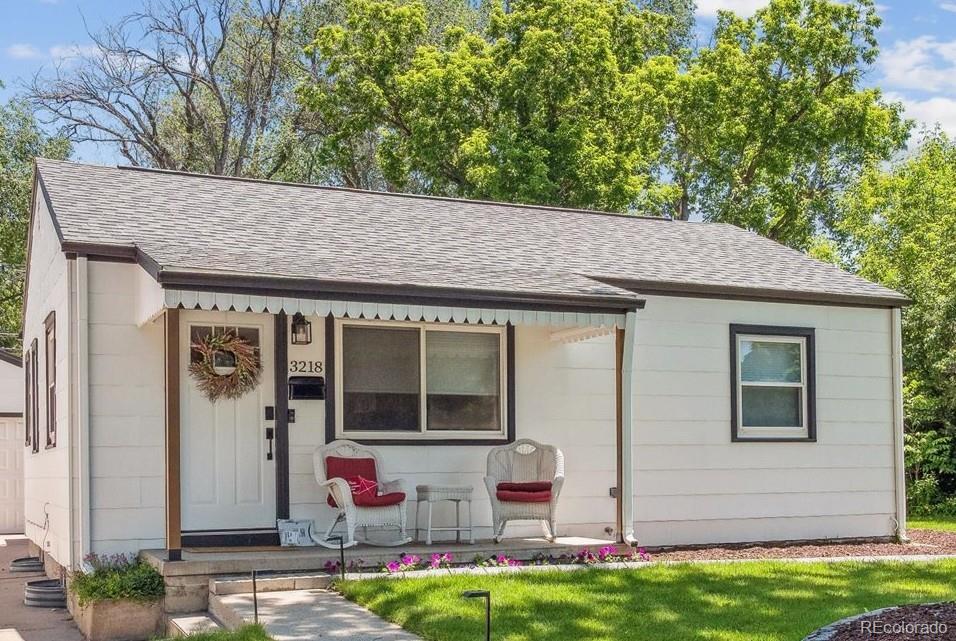
Active
$585,000
3
bds
|
2
ba
|
1,393
sqft
|
built
1950
3218 S Lafayette St, Englewood, CO 80113
$-1,273
Cash flow
-11.4%
Cash-on-Cash Return
3.1%
Cap rate
0.4%
Rent to Value Ratio
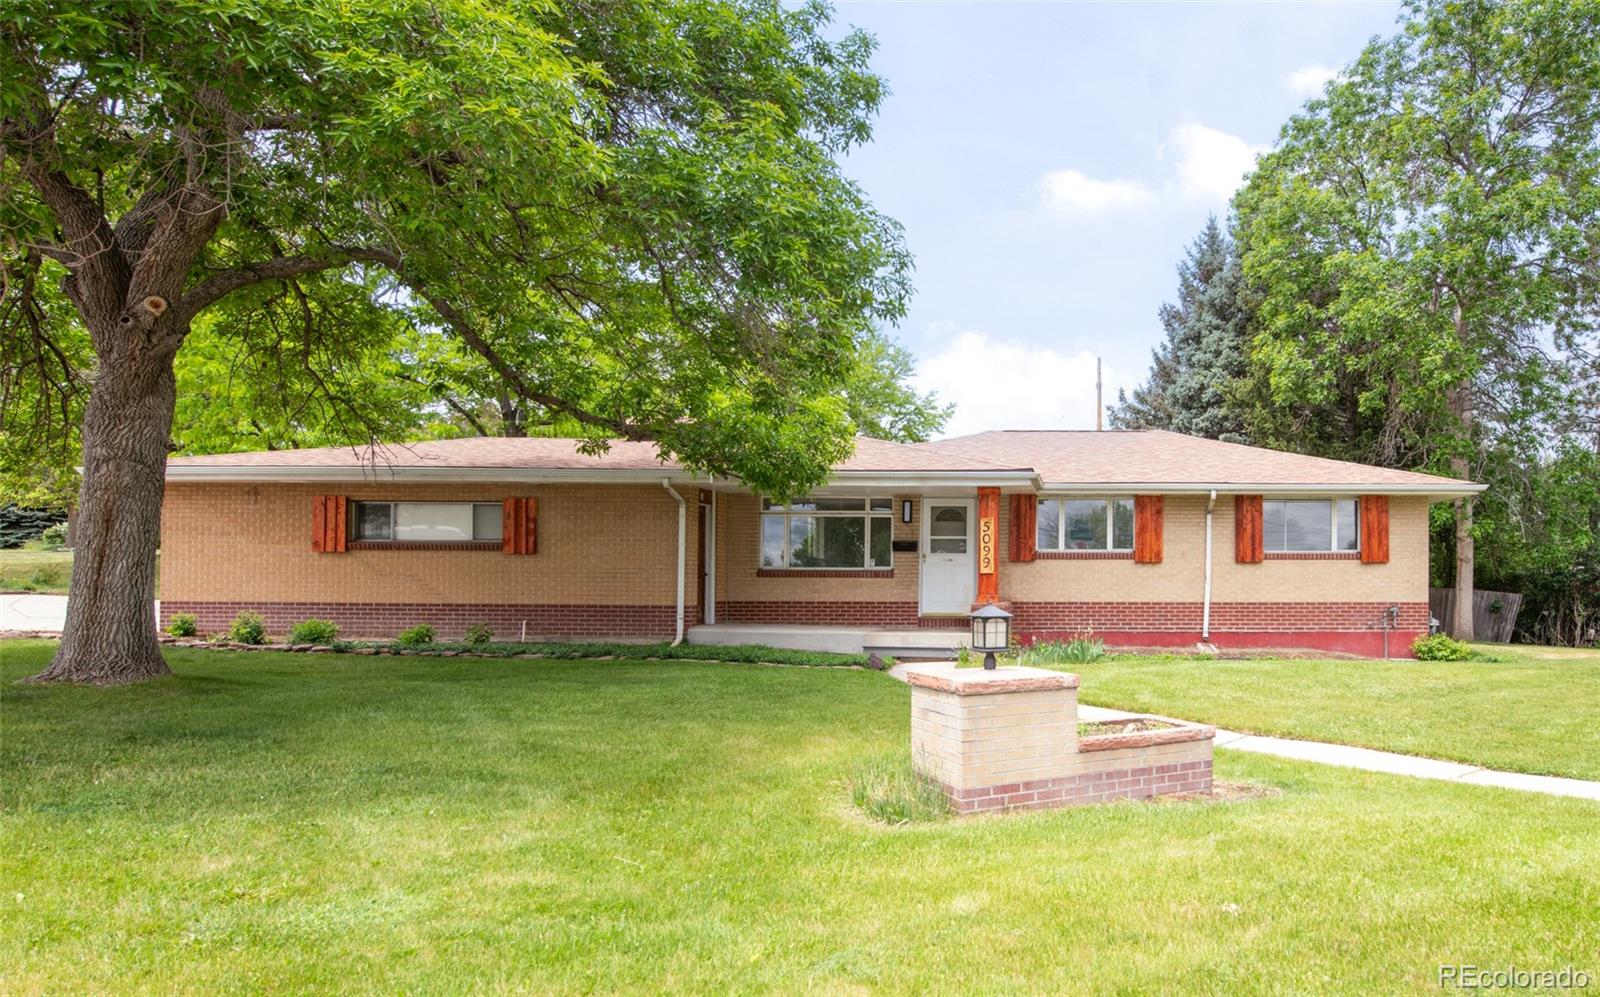
Active
$535,000
4
bds
|
2
ba
|
1,344
sqft
|
built
1959
5099 S Linden Dr, Englewood, CO 80110
$-826
Cash flow
-8.1%
Cash-on-Cash Return
3.8%
Cap rate
0.5%
Rent to Value Ratio
Active
$695,000
3
bds
|
3
ba
|
1,844
sqft
|
built
2017
4730 S Acoma St, Englewood, CO 80110
$-1,383
Cash flow
-10.4%
Cash-on-Cash Return
3.3%
Cap rate
0.5%
Rent to Value Ratio
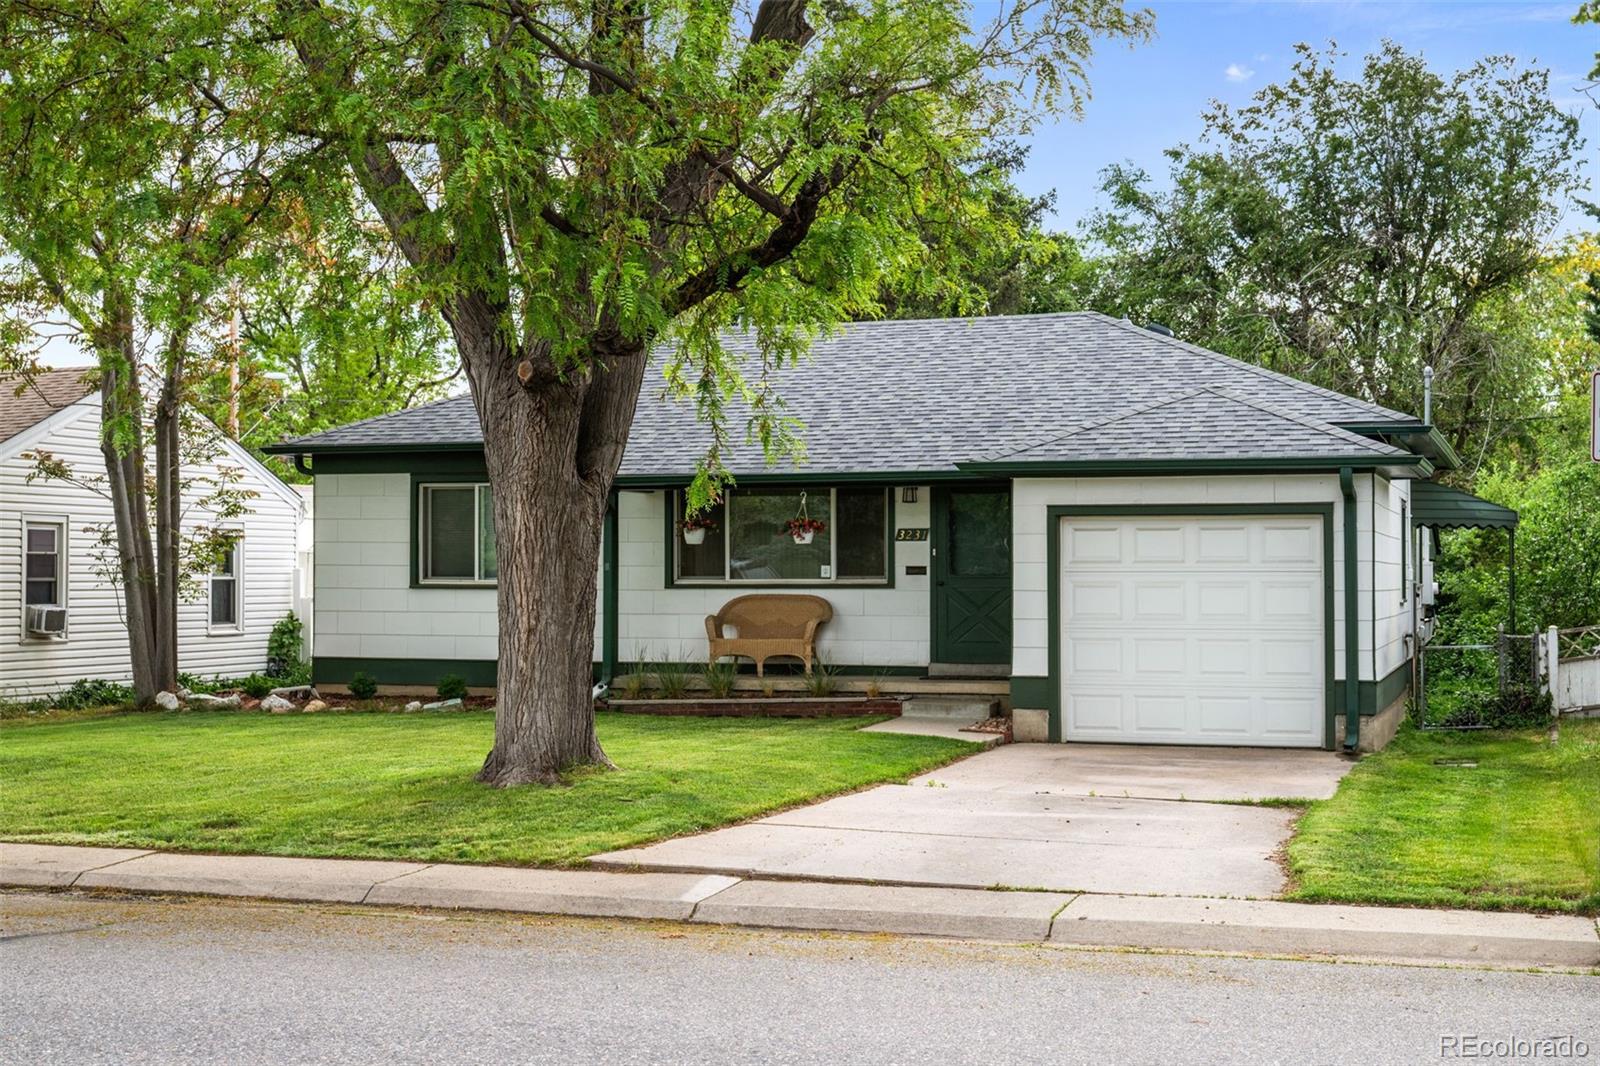
Active
$515,000
2
bds
|
1
ba
|
894
sqft
|
built
1951
3231 S Elati St, Englewood, CO 80110
$-834
Cash flow
-8.4%
Cash-on-Cash Return
3.7%
Cap rate
0.5%
Rent to Value Ratio
Active
$3,995,000
5
bds
|
6
ba
|
7,511
sqft
|
built
1993
6180 E Quincy Ave, Englewood, CO 80111
$-16,022
Cash flow
-20.9%
Cash-on-Cash Return
0.9%
Cap rate
0.2%
Rent to Value Ratio
Active
$725,000
3
bds
|
2
ba
|
1,801
sqft
|
built
2015
12677 Fisher Dr, Englewood, CO 80112
$-1,787
Cash flow
-12.9%
Cash-on-Cash Return
2.7%
Cap rate
0.4%
Rent to Value Ratio
Active
$675,000
3
bds
|
2
ba
|
1,490
sqft
|
built
1920
3680 S Logan St, Englewood, CO 80113
$-1,472
Cash flow
-11.4%
Cash-on-Cash Return
3.1%
Cap rate
0.4%
Rent to Value Ratio
Active
$895,000
4
bds
|
4
ba
|
2,898
sqft
|
built
2021
3422 S Grant St, Englewood, CO 80113
$-1,854
Cash flow
-10.8%
Cash-on-Cash Return
3.2%
Cap rate
0.4%
Rent to Value Ratio
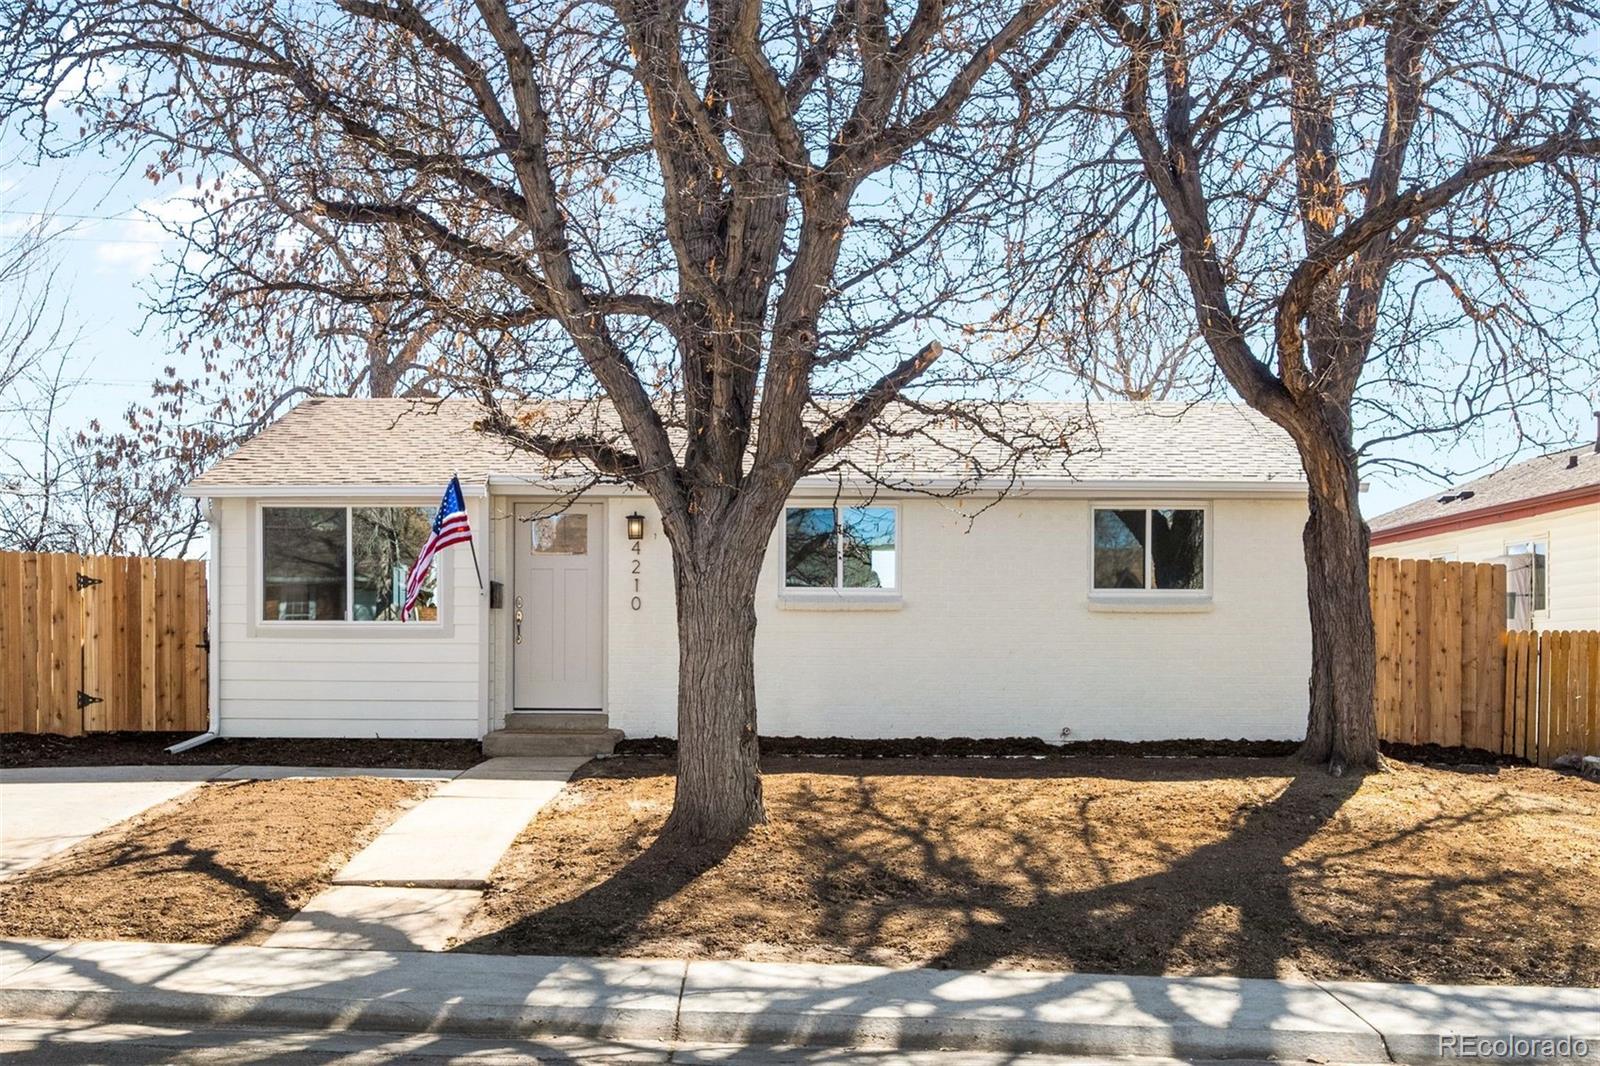
Active
$440,000
3
bds
|
1
ba
|
837
sqft
|
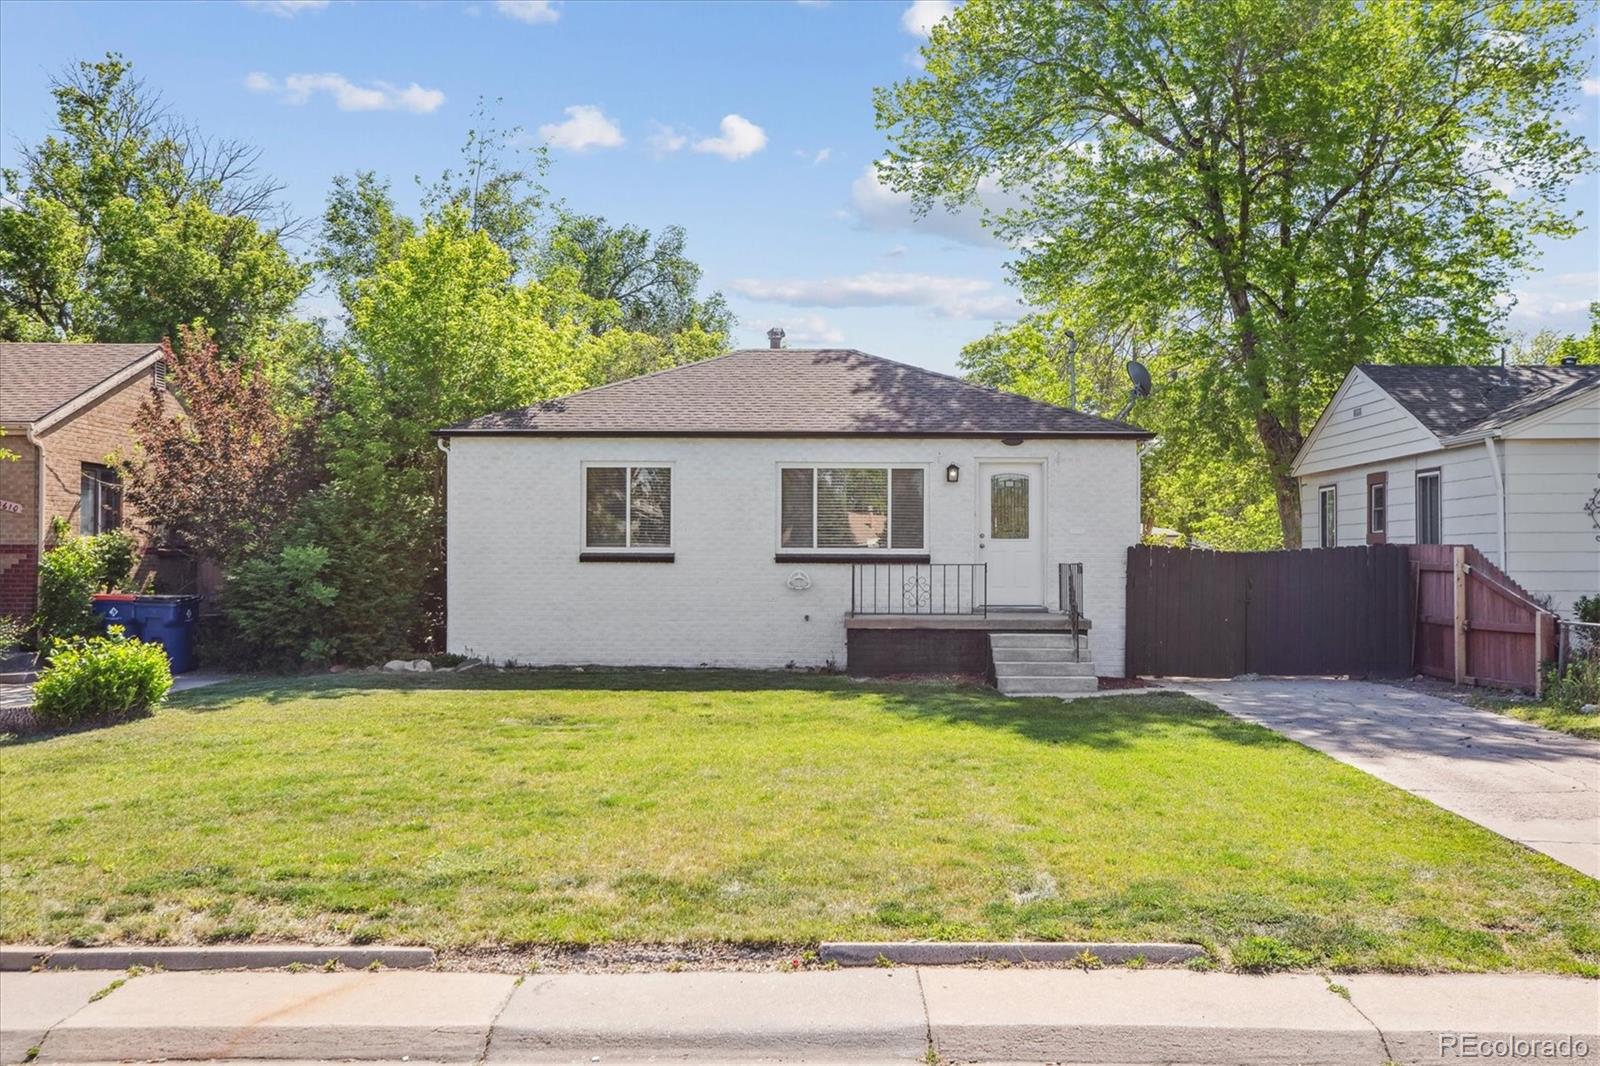
built
1965
4210 S Dale Ct, Englewood, CO 80110
$-813
Cash flow
-9.6%
Cash-on-Cash Return
3.5%
Cap rate
0.5%
Rent to Value Ratio
Active
$499,000
2
bds
|
1
ba
|
1,223
sqft
|
built
1923
4196 S Pennsylvania St, Englewood, CO 80113
$-851
Cash flow
-8.9%
Cash-on-Cash Return
3.6%
Cap rate
0.5%
Rent to Value Ratio
Active
$599,900
3
bds
|
2
ba
|
1,290
sqft
|
built
1958
4745 S Sherman St, Englewood, CO 80113
$-1,880
Cash flow
-16.4%
Cash-on-Cash Return
1.9%
Cap rate
0.3%
Rent to Value Ratio
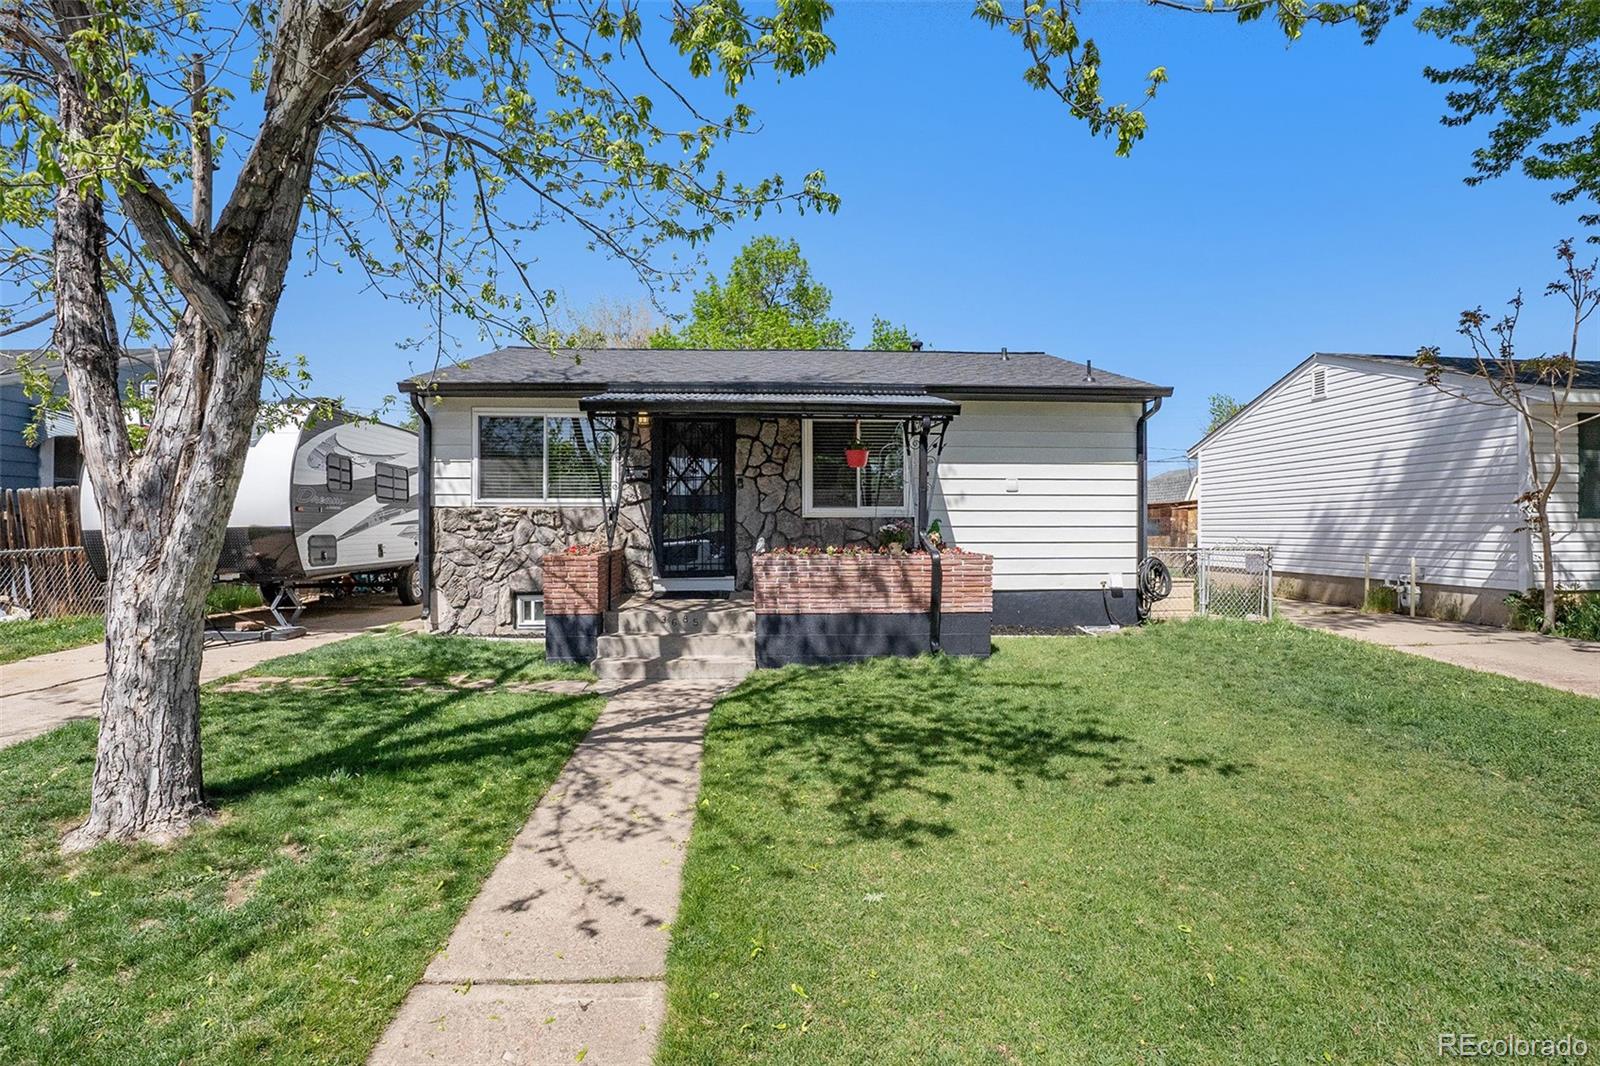
Active
$449,900
4
bds
|
1
ba
|
1,260
sqft
|
built
1956
3685 S Hooker St, Englewood, CO 80110
$-620
Cash flow
-7.2%
Cash-on-Cash Return
4.0%
Cap rate
0.6%
Rent to Value Ratio
Active
$550,000
3
bds
|
2
ba
|
2,214
sqft
|
built
1951
4051 S Cherokee St, Englewood, CO 80110
$-704
Cash flow
-6.7%
Cash-on-Cash Return
4.1%
Cap rate
0.6%
Rent to Value Ratio
Active
$3,195,000
6
bds
|
6
ba
|
6,183
sqft
|
built
1971
4285 S Hudson Pkwy, Englewood, CO 80113
$-12,495
Cash flow
-20.4%
Cash-on-Cash Return
1.0%
Cap rate
0.2%
Rent to Value Ratio
Active
$475,000
3
bds
|
1
ba
|
1,009
sqft
|
built
1911
4079 S Bannock St, Englewood, CO 80110
$-659
Cash flow
-7.2%
Cash-on-Cash Return
4.0%
Cap rate
0.5%
Rent to Value Ratio
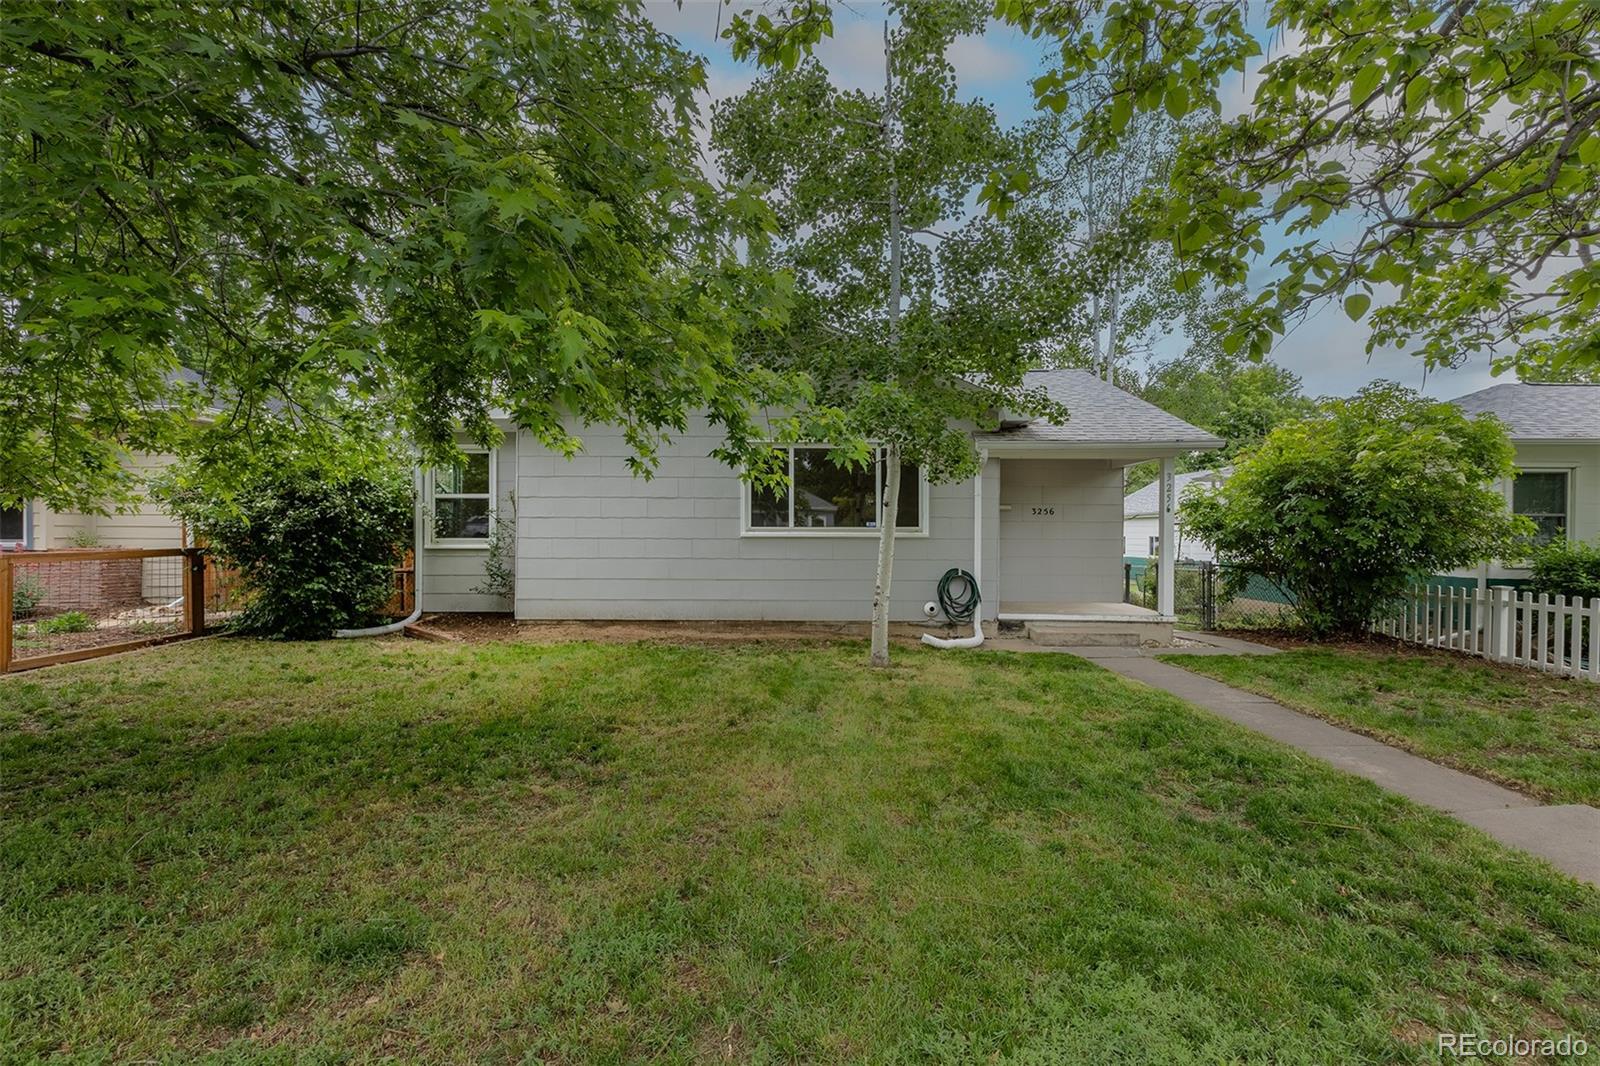
Active
$700,000
4
bds
|
2
ba
|
1,680
sqft
|
built
1953
3256 S Ogden St, Englewood, CO 80113
$-1,597
Cash flow
-11.9%
Cash-on-Cash Return
2.9%
Cap rate
0.4%
Rent to Value Ratio
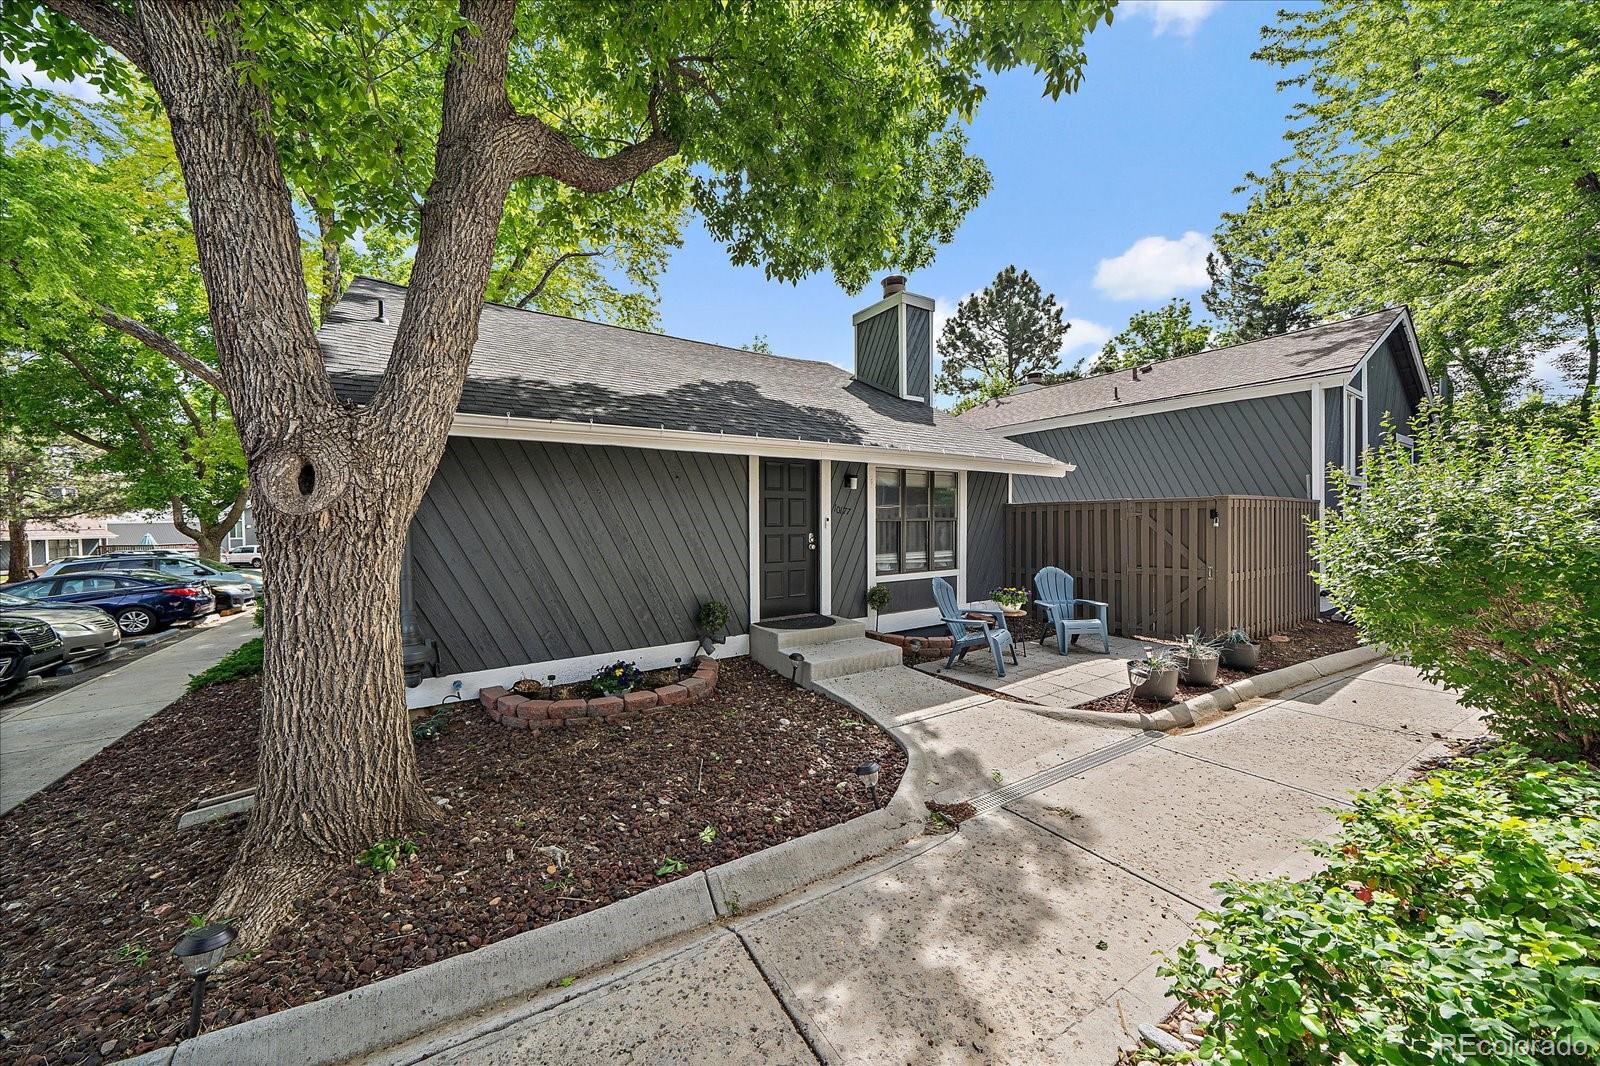
Active
$465,000
4
bds
|
3
ba
|
1,260
sqft
|
built
1979
10177 E Peakview Ave, Englewood, CO 80111
$-916
Cash flow
-10.3%
Cash-on-Cash Return
3.3%
Cap rate
0.5%
Rent to Value Ratio
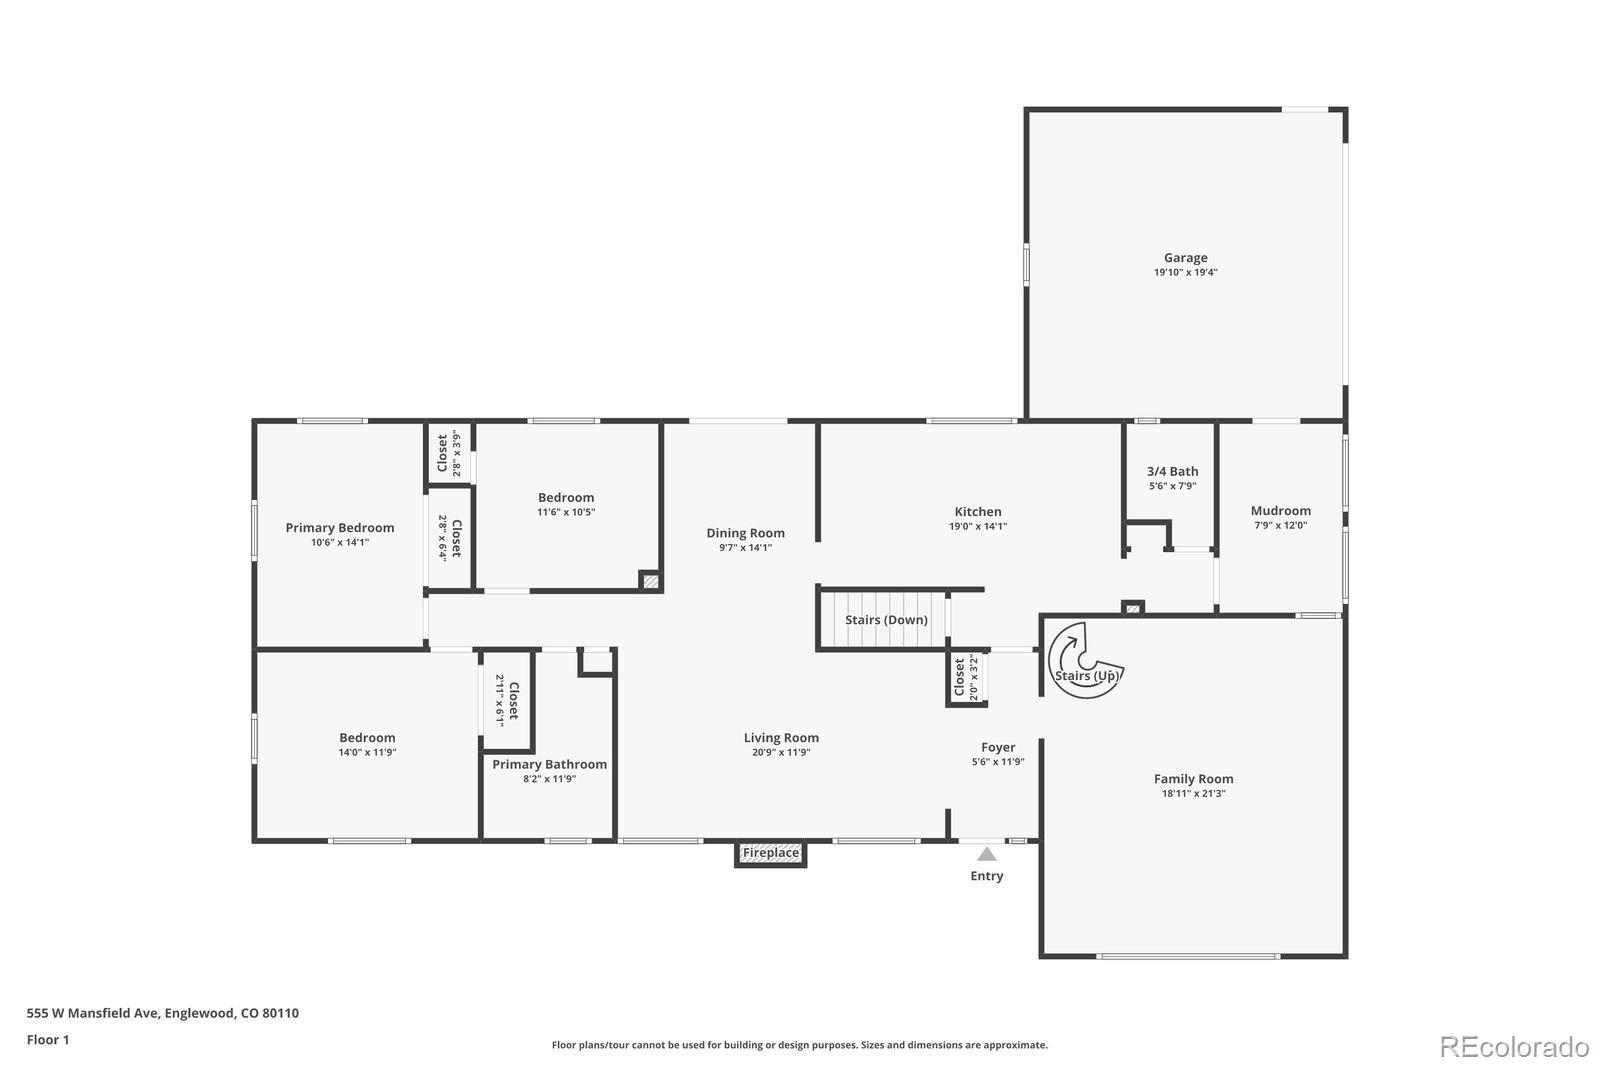
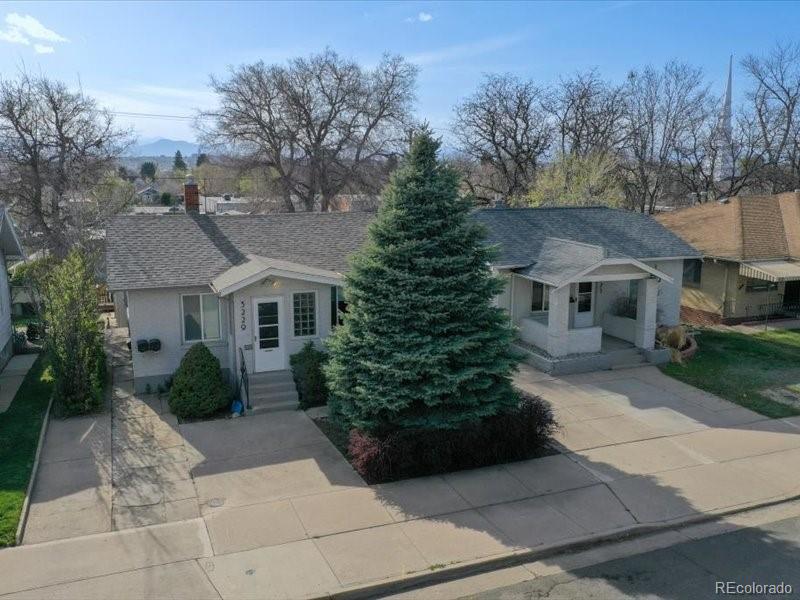
Active under contract
$635,000
5
bds
|
3
ba
|
3,329
sqft
|
built
1952
555 W Mansfield Ave, Englewood, CO 80110
$-573
Cash flow
-4.7%
Cash-on-Cash Return
4.6%
Cap rate
0.6%
Rent to Value Ratio
Active under contract
$3,400,000
4
bds
|
5
ba
|
5,219
sqft
|
built
1988
4845 S Gaylord St, Englewood, CO 80113
$-13,995
Cash flow
-21.5%
Cash-on-Cash Return
0.7%
Cap rate
0.2%
Rent to Value Ratio
Active
$400,000
3
bds
|
1
ba
|
1,563
sqft
|
built
1953
595 W Eastman Ave, Englewood, CO 80110
$-191
Cash flow
-2.5%
Cash-on-Cash Return
5.1%
Cap rate
0.7%
Rent to Value Ratio
Active under contract
$685,000
3
bds
|
2
ba
|
1,796
sqft
|
built
1946
2895 S Sherman St, Englewood, CO 80113
$-1,411
Cash flow
-10.7%
Cash-on-Cash Return
3.2%
Cap rate
0.5%
Rent to Value Ratio
Active under contract
$390,000
2
bds
|
1
ba
|
814
sqft
|
built
1977
3446 S Clay St, Englewood, CO 80110
$-439
Cash flow
-5.9%
Cash-on-Cash Return
4.3%
Cap rate
0.6%
Rent to Value Ratio

Active
$18,000,000
6
bds
|
11
ba
|
21,009
sqft
|
built
2003
4603 S Denice Dr, Englewood, CO 80111
$-87,818
Cash flow
-25.5%
Cash-on-Cash Return
-0.2%
Cap rate
0.0%
Rent to Value Ratio
Active
$5,800,000
8
bds
|
11
ba
|
14,481
sqft
|
built
1976
9 Sedgwick Dr, Englewood, CO 80113
$-23,836
Cash flow
-21.4%
Cash-on-Cash Return
0.7%
Cap rate
0.2%
Rent to Value Ratio
Active
$510,000
3
bds
|
1
ba
|
1,326
sqft
|
built
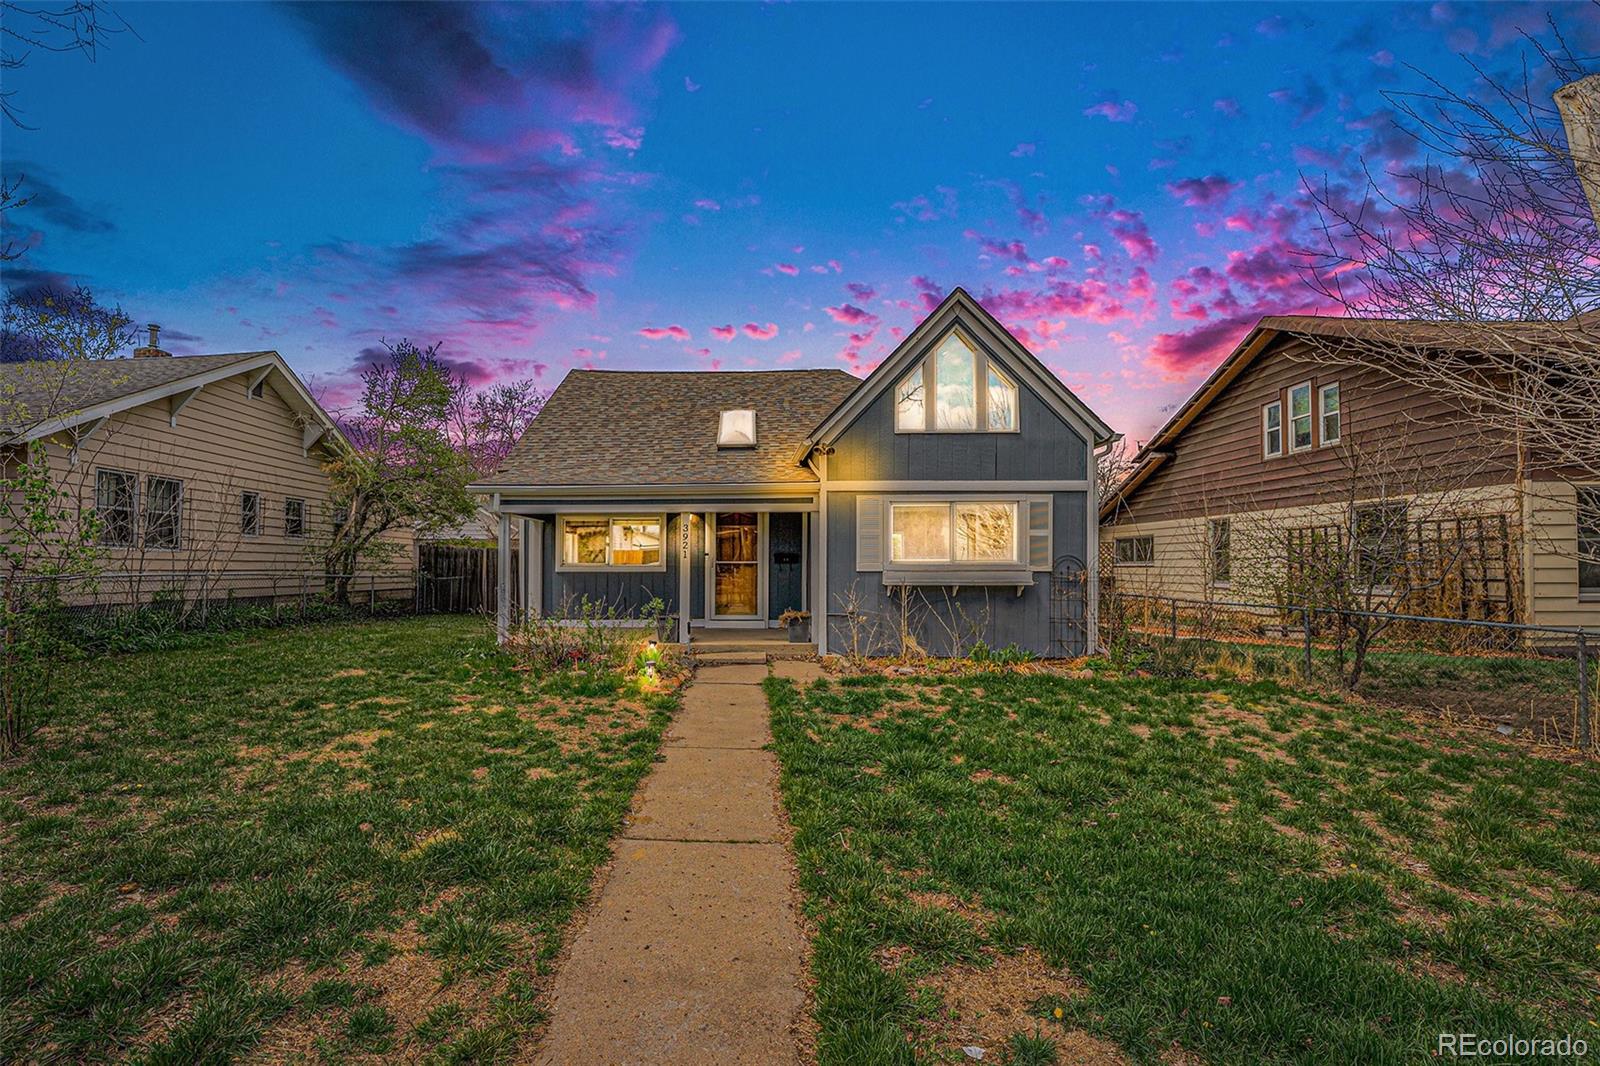
1906
3921 S Acoma St, Englewood, CO 80110
$-501
Cash flow
-5.1%
Cash-on-Cash Return
4.5%
Cap rate
0.6%
Rent to Value Ratio

Active
$599,000
4
bds
|
2
ba
|
2,136
sqft
|
built
1951
3831 S Fox St, Englewood, CO 80110
$-866
Cash flow
-7.5%
Cash-on-Cash Return
3.9%
Cap rate
0.5%
Rent to Value Ratio
Active
$535,000
3
bds
|
2
ba
|
832
sqft
|
built
1954
4624 S Lincoln St, Englewood, CO 80113
$-954
Cash flow
-9.3%
Cash-on-Cash Return
3.5%
Cap rate
0.5%
Rent to Value Ratio
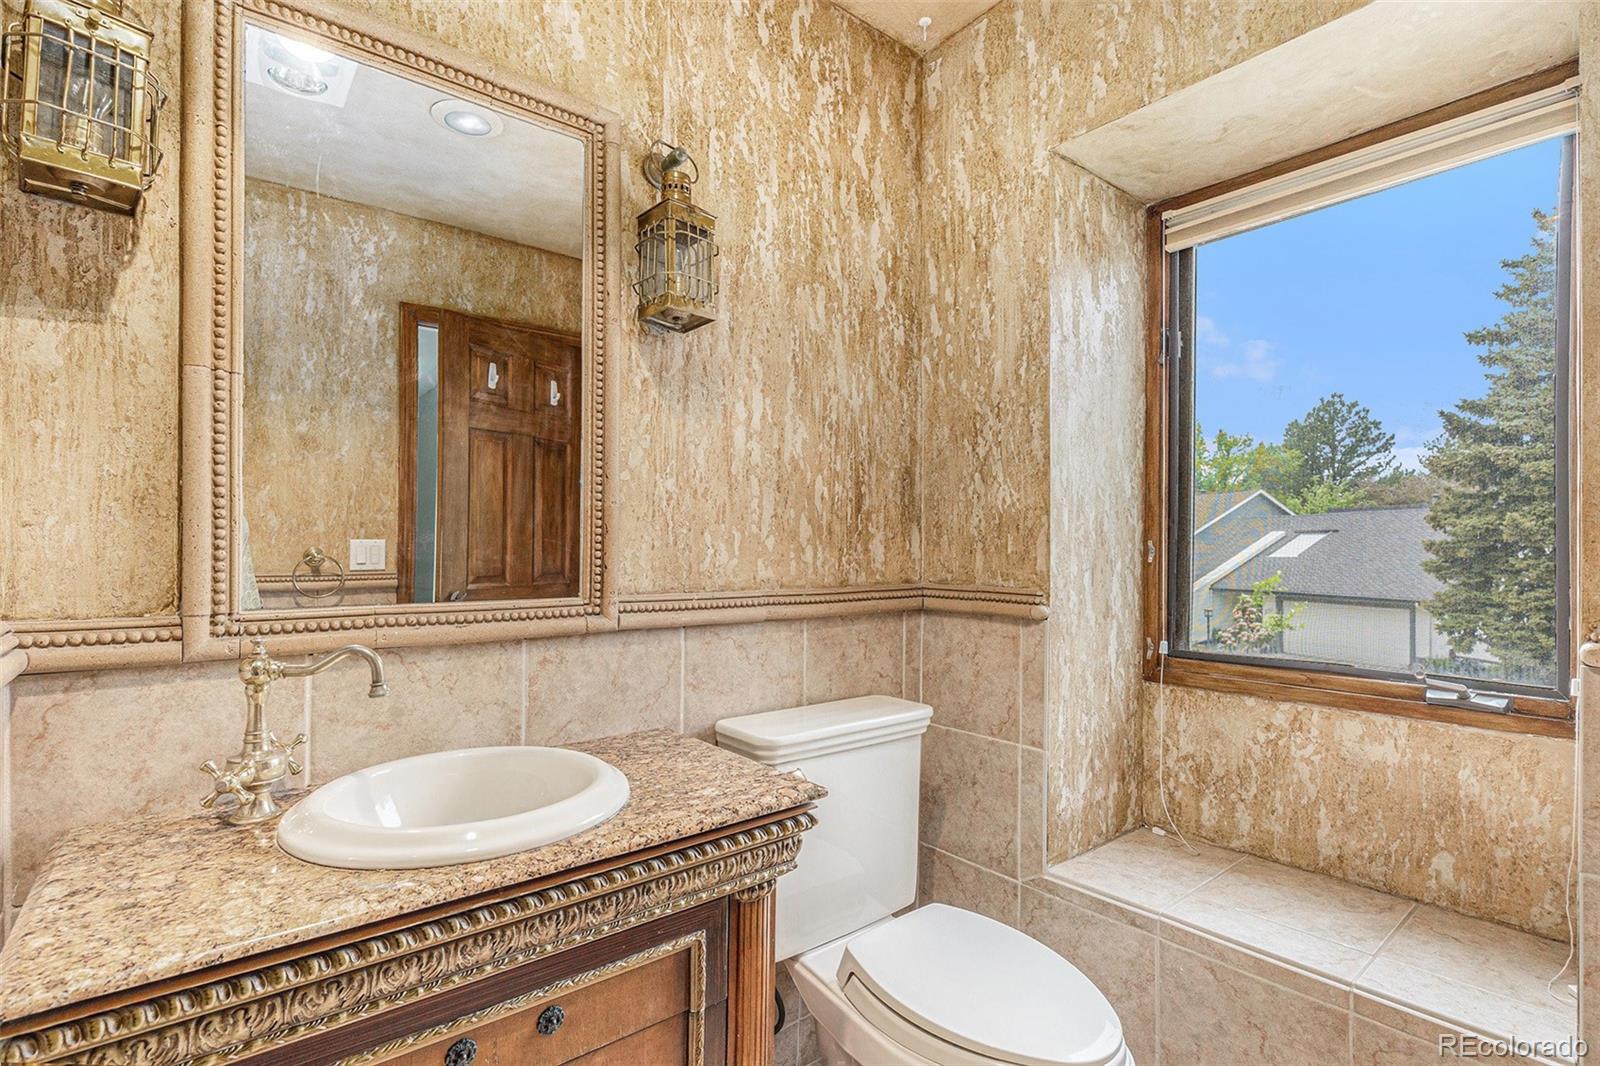
Active
$2,750,000
6
bds
|
7
ba
|
5,018
sqft
|
built
1975
3500 S Franklin St, Englewood, CO 80113
$-7,672
Cash flow
-14.6%
Cash-on-Cash Return
2.3%
Cap rate
0.3%
Rent to Value Ratio
Active
$1,475,000
4
bds
|
4
ba
|
4,271
sqft
|
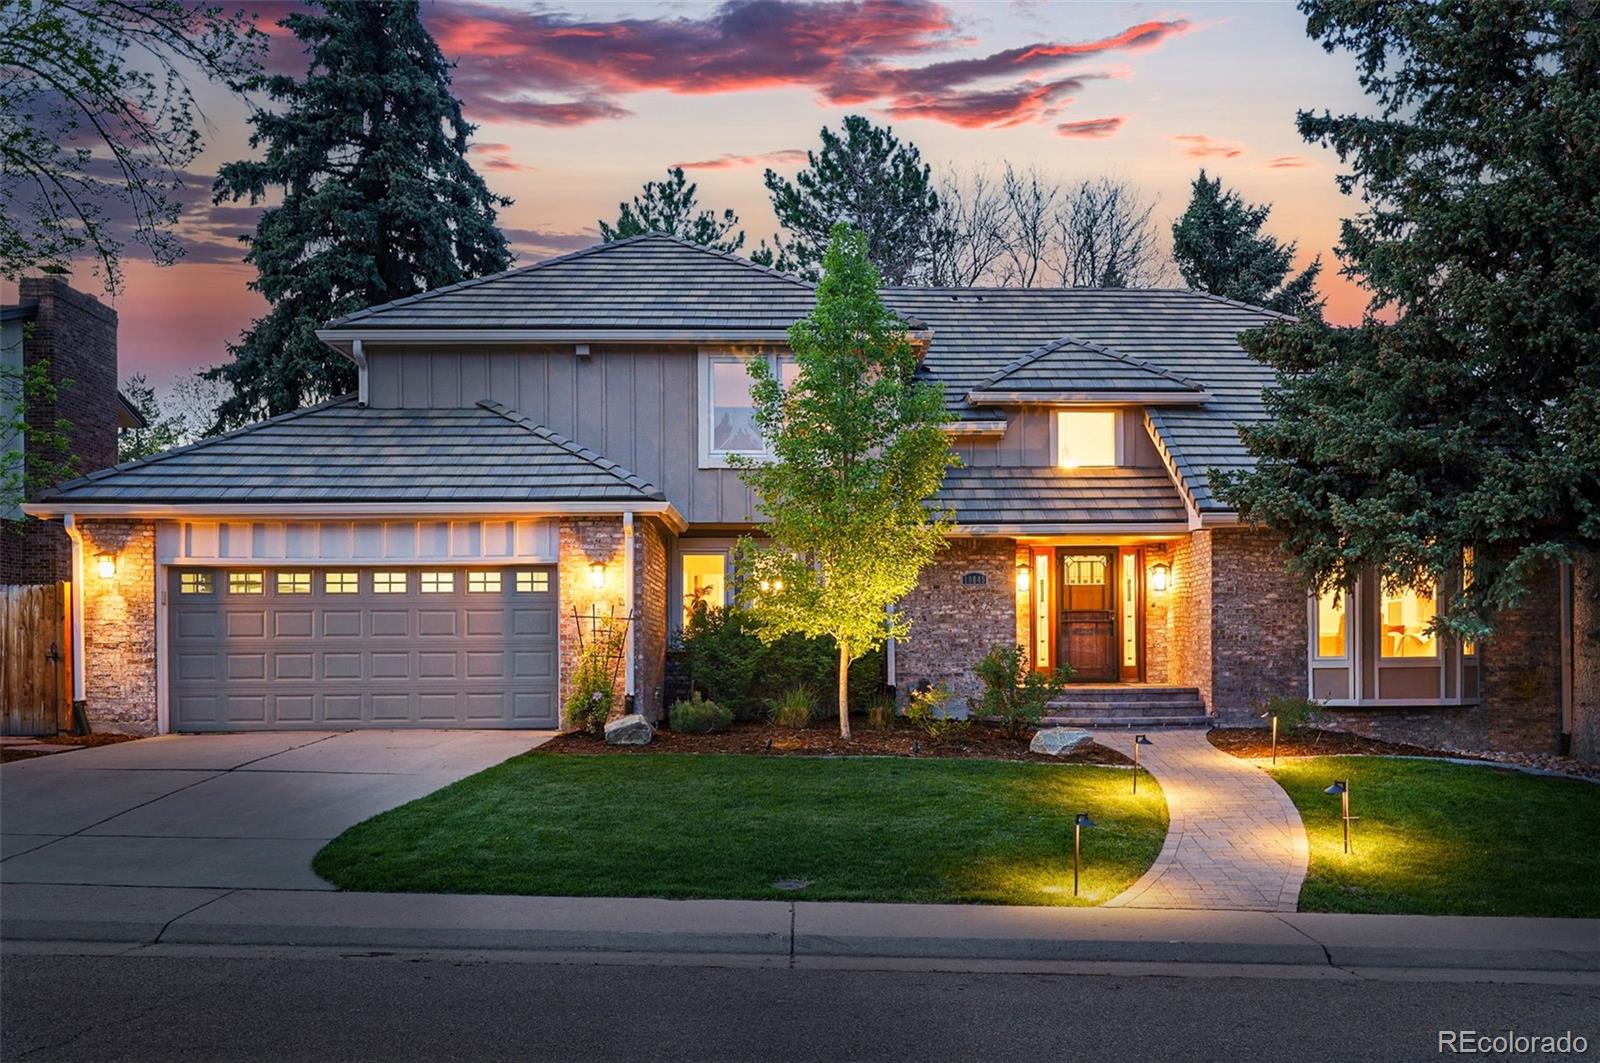
built
1978
10849 E Crestridge Cir, Englewood, CO 80111
$-4,760
Cash flow
-16.8%
Cash-on-Cash Return
1.8%
Cap rate
0.3%
Rent to Value Ratio
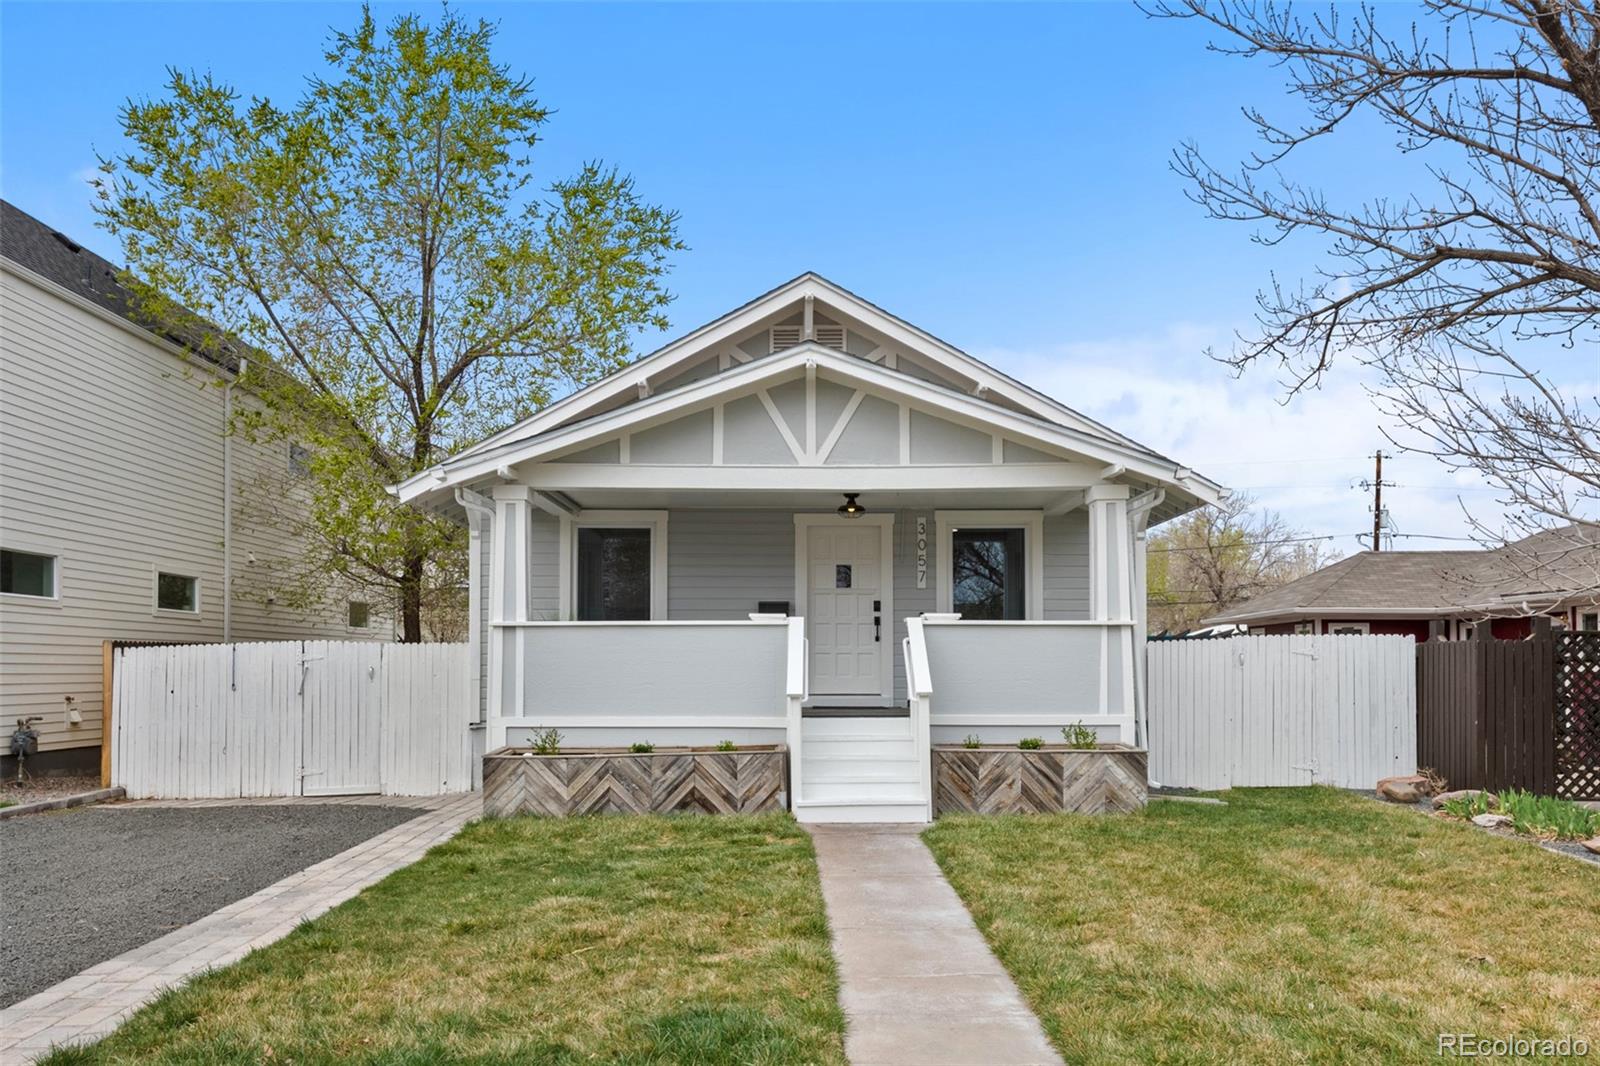
Active under contract
$650,000
3
bds
|
2
ba
|
2,251
sqft
|
built
1932
3057 S Fox St, Englewood, CO 80110
$-1,104
Cash flow
-8.9%
Cash-on-Cash Return
3.6%
Cap rate
0.5%
Rent to Value Ratio
Active
$1,500,000
2
bds
|
1
ba
|
1,212
sqft
|
built
1920
3225 S Lincoln St, Englewood, CO 80113
$-5,549
Cash flow
-19.3%
Cash-on-Cash Return
1.2%
Cap rate
0.2%
Rent to Value Ratio
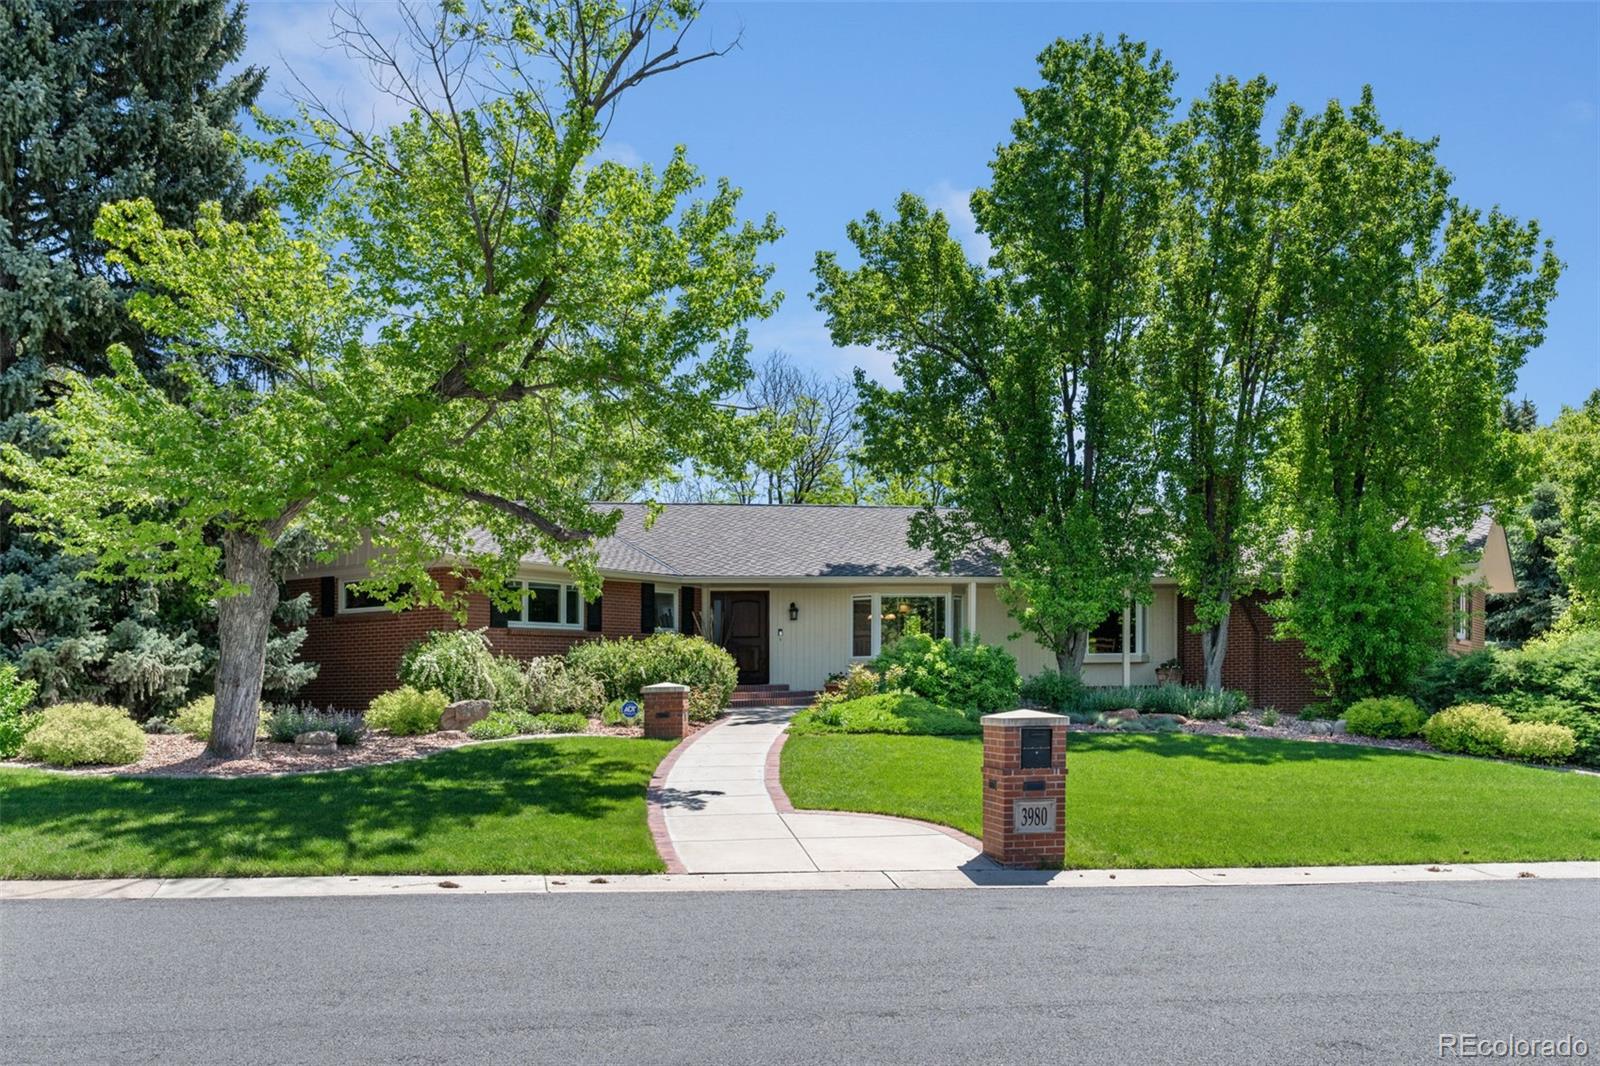
Active
$2,750,000
5
bds
|
6
ba
|
6,056
sqft
|
built
1959
3980 S Dexter St, Englewood, CO 80113
$-9,285
Cash flow
-17.6%
Cash-on-Cash Return
1.6%
Cap rate
0.3%
Rent to Value Ratio
Active
$864,000
4
bds
|
4
ba
|
2,534
sqft
|
built
1978
10158 E Fair Cir, Englewood, CO 80111
$-2,203
Cash flow
-13.3%
Cash-on-Cash Return
2.6%
Cap rate
0.4%
Rent to Value Ratio
Closed
$360,000
3
bds
|
1
ba
|
1,150
sqft
|
built
1959
3930 S Hazel Ct, Englewood, CO 80110
$-352
Cash flow
-5.1%
Cash-on-Cash Return
4.5%
Cap rate
0.6%
Rent to Value Ratio
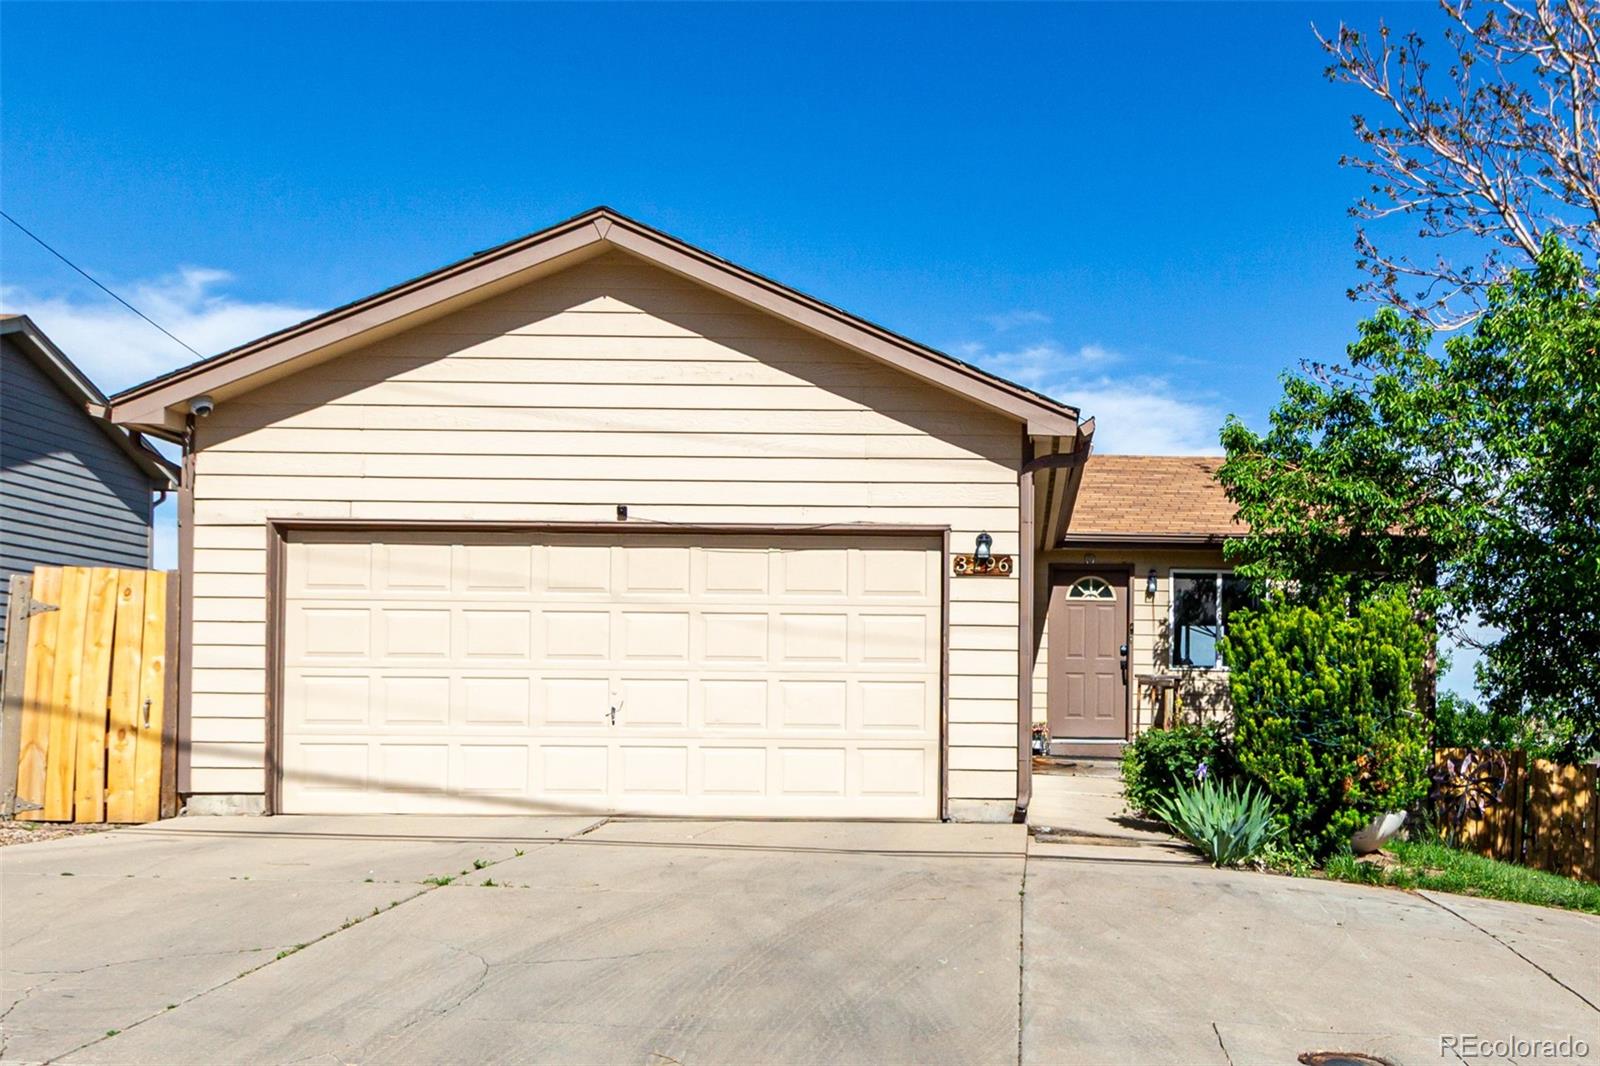
Active
$480,000
4
bds
|
2
ba
|
1,728
sqft
|
built
2000
3296 S Bryant St, Englewood, CO 80110
$-804
Cash flow
-8.7%
Cash-on-Cash Return
3.7%
Cap rate
0.5%
Rent to Value Ratio

Active
$575,000
3
bds
|
1
ba
|
1,367
sqft
|
built
1955
3075 S Emerson Way, Englewood, CO 80113
$-836
Cash flow
-7.6%
Cash-on-Cash Return
3.9%
Cap rate
0.5%
Rent to Value Ratio