Englewood, CO Investment Properties for Sale
Browse homes for sale and investment properties in Englewood, CO. Refine your search by price, property type, or more.
Best cash flowing properties in Englewood, CO
Active
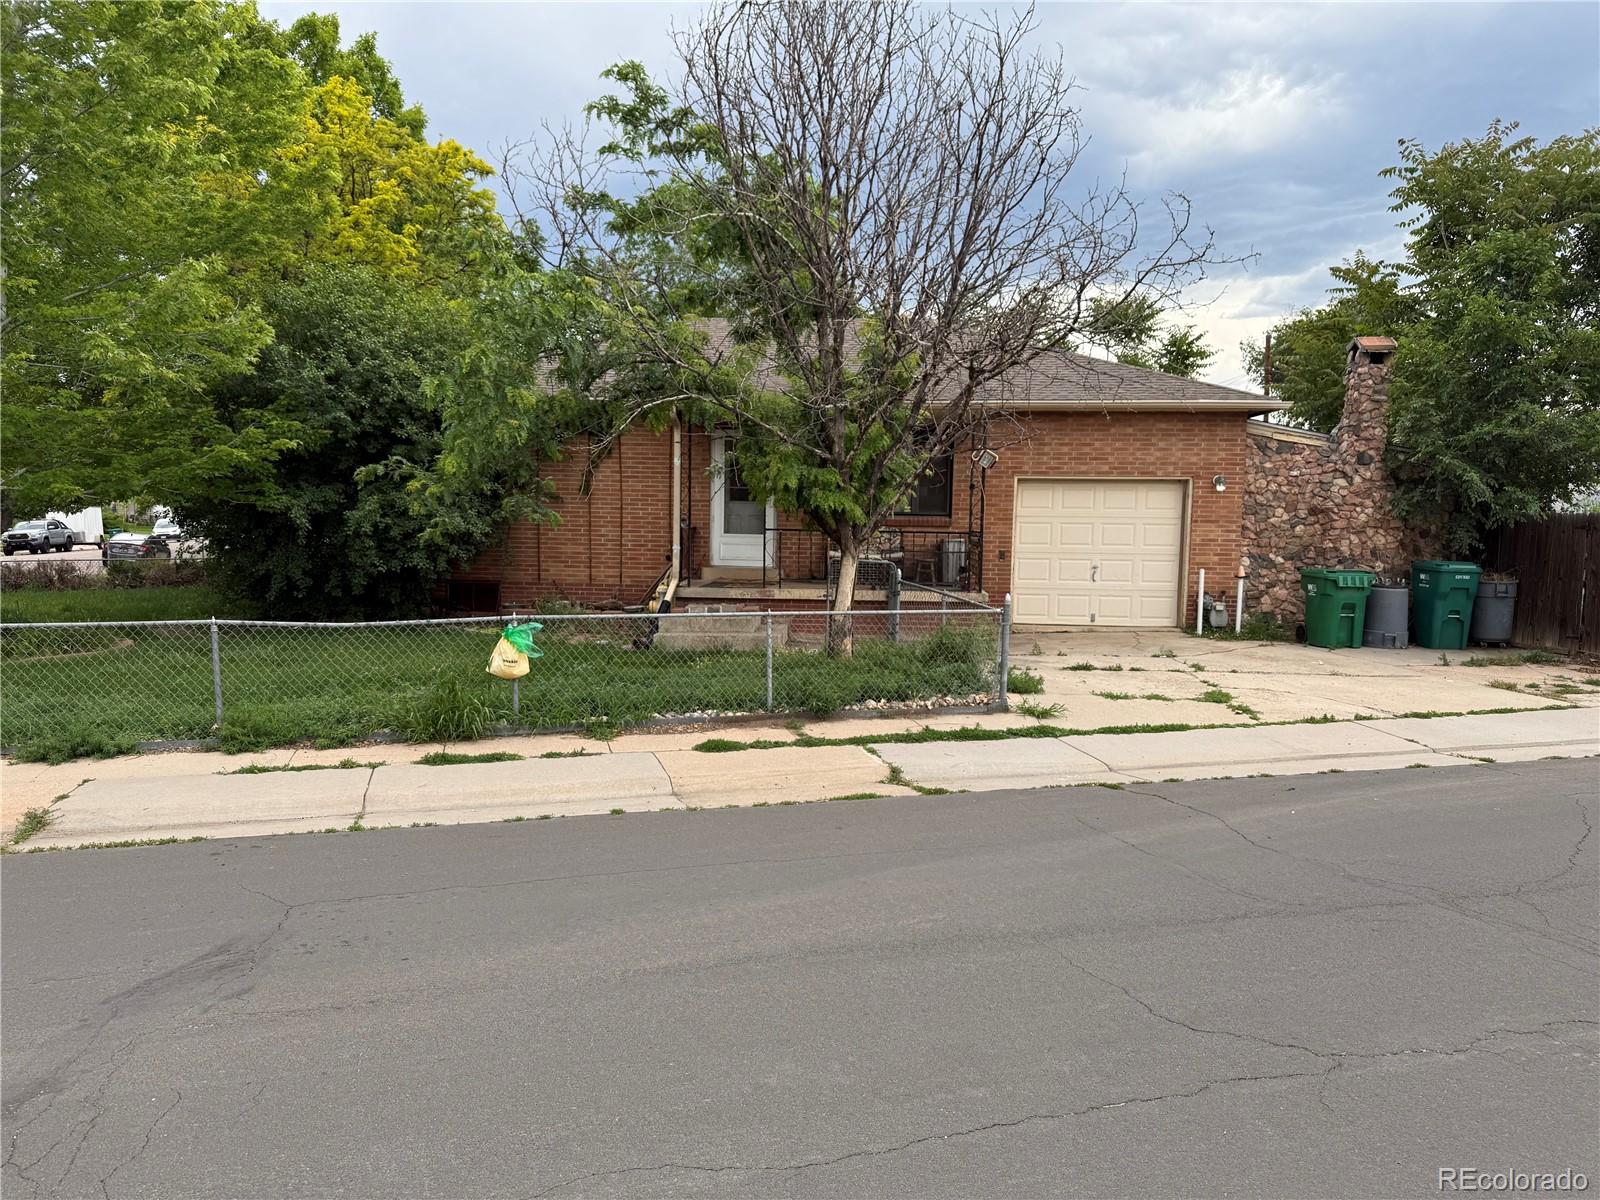
$185,000
1
bds
|
1
ba
|
648
sqft
|
built
1984
4681 S Decatur St, Englewood, CO 80110
$-117
Cash flow
-3.3%
Cash-on-Cash Return
4.9%
Cap rate
0.9%
Rent to Value Ratio
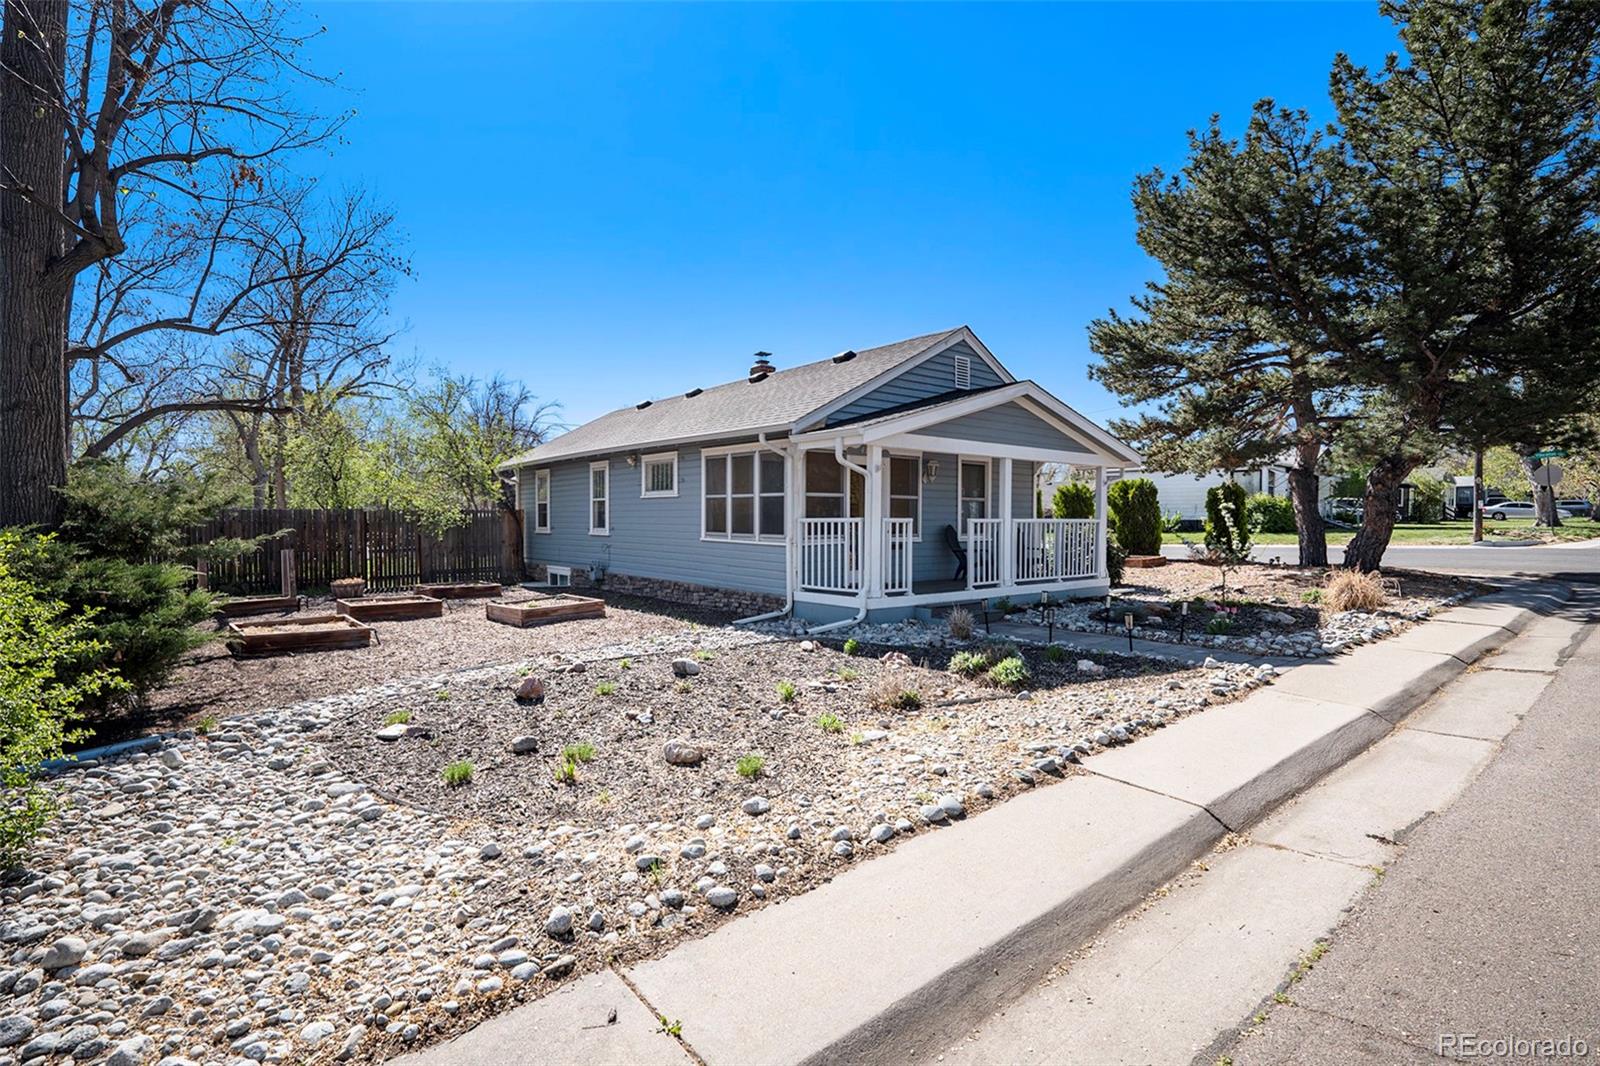
Pending
$400,000
3
bds
|
1
ba
|
1,563
sqft
|
built
1953
595 W Eastman Ave, Englewood, CO 80110
$-191
Cash flow
-2.5%
Cash-on-Cash Return
5.1%
Cap rate
0.7%
Rent to Value Ratio
221 out of 252 properties for sale in Englewood, CO
Limited Results Shown
Create a free account, or log in to reveal all property listings and enjoy the complete experience.

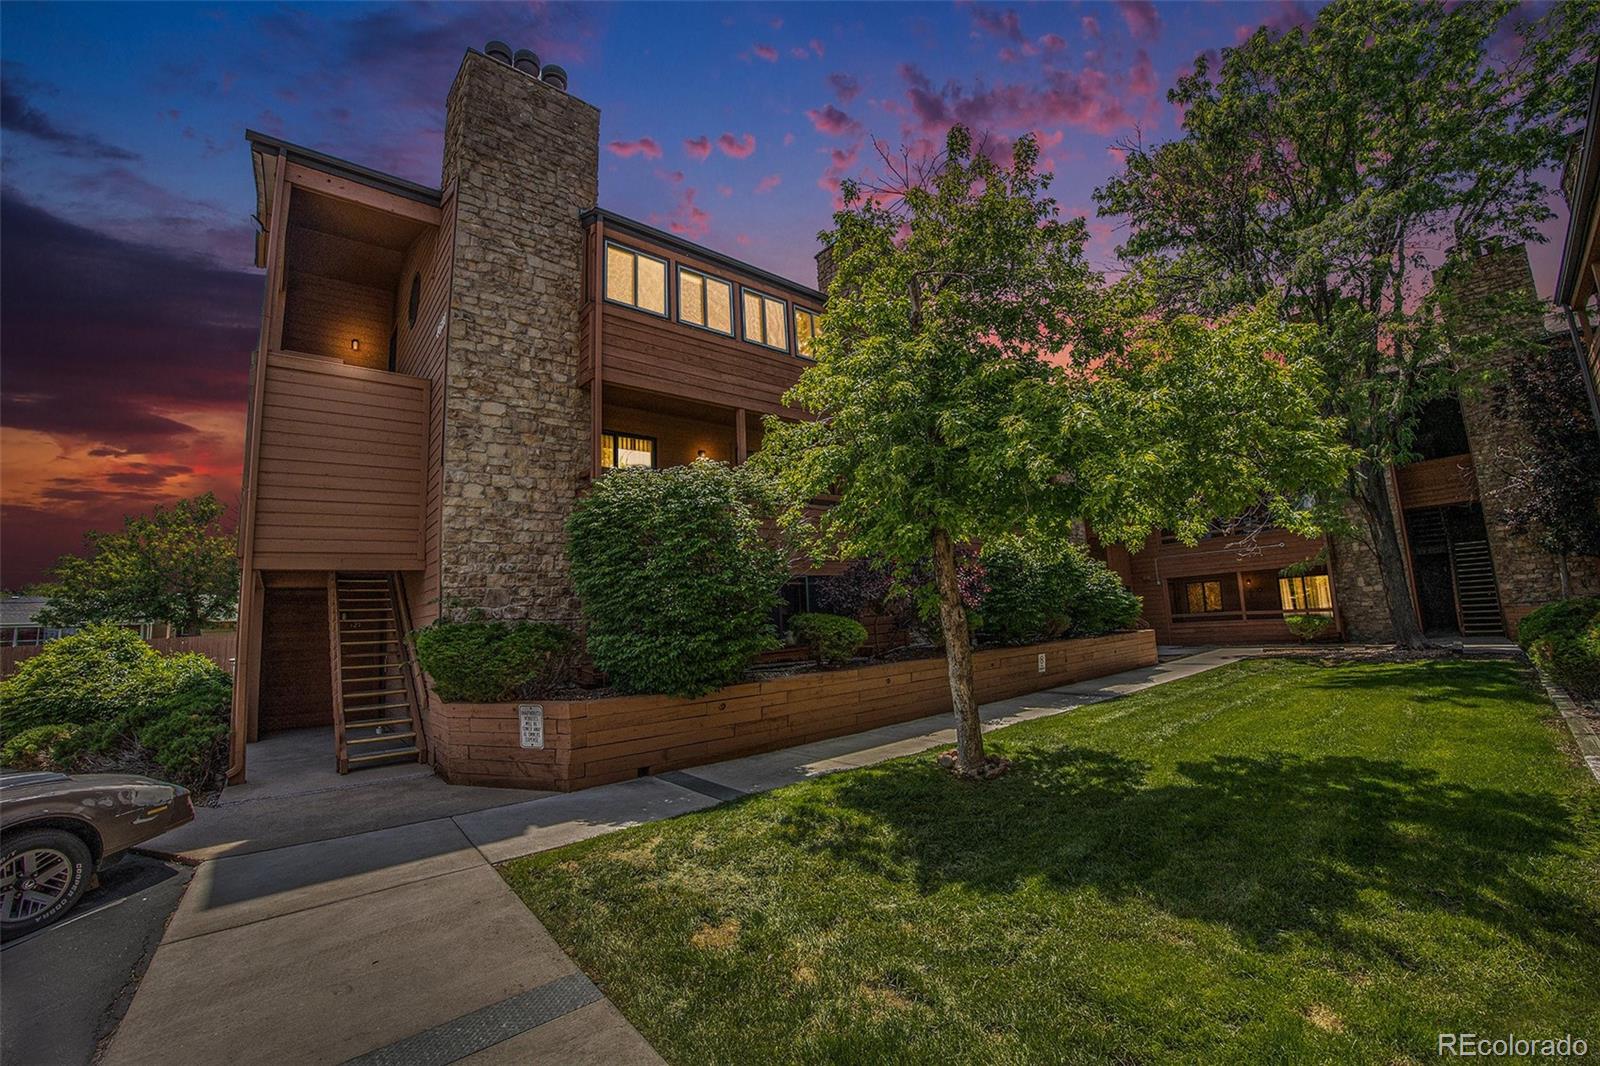
Active
$420,000
3
bds
|
3
ba
|
1,771
sqft
|
built
1988
6475 S Dayton St, Englewood, CO 80111
$-1,061
Cash flow
-13.2%
Cash-on-Cash Return
2.6%
Cap rate
0.6%
Rent to Value Ratio
Active
$499,000
2
bds
|
1
ba
|
1,223
sqft
|
built
1923
4196 S Pennsylvania St, Englewood, CO 80113
$-851
Cash flow
-8.9%
Cash-on-Cash Return
3.6%
Cap rate
0.5%
Rent to Value Ratio
Active
$599,900
3
bds
|
2
ba
|
1,290
sqft
|
built
1958
4745 S Sherman St, Englewood, CO 80113
$-1,880
Cash flow
-16.4%
Cash-on-Cash Return
1.9%
Cap rate
0.3%
Rent to Value Ratio
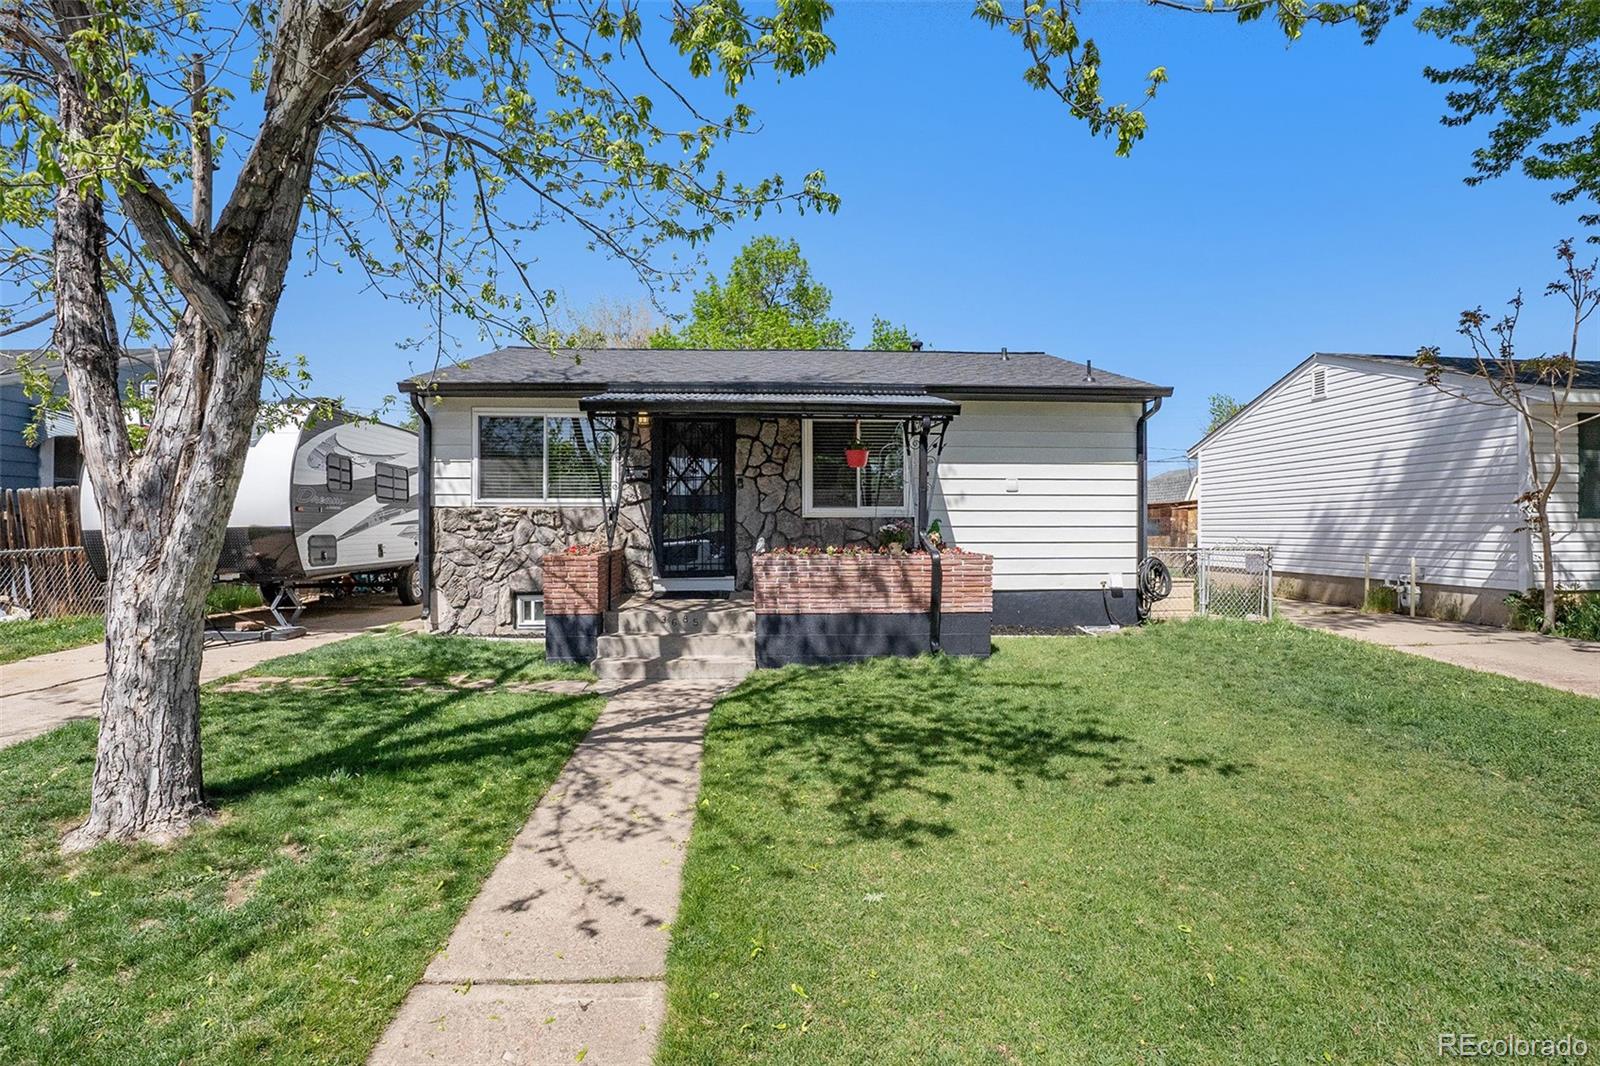
Active
$449,900
4
bds
|
1
ba
|
1,260
sqft
|
built
1956
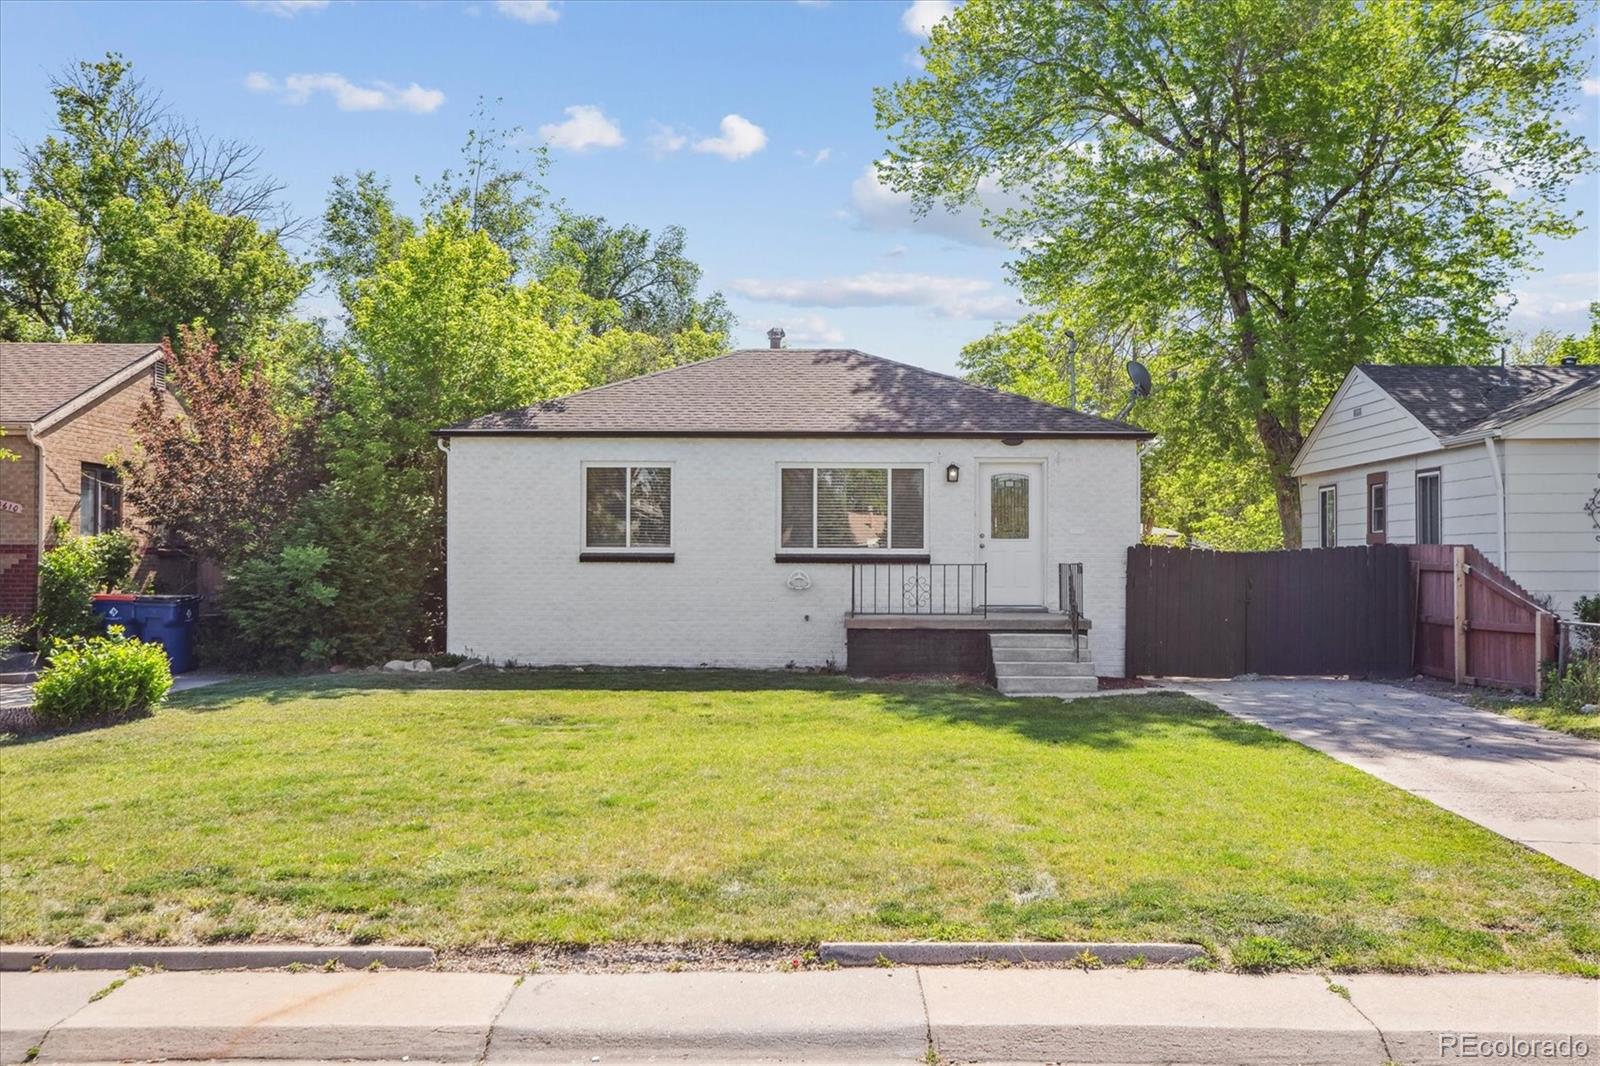
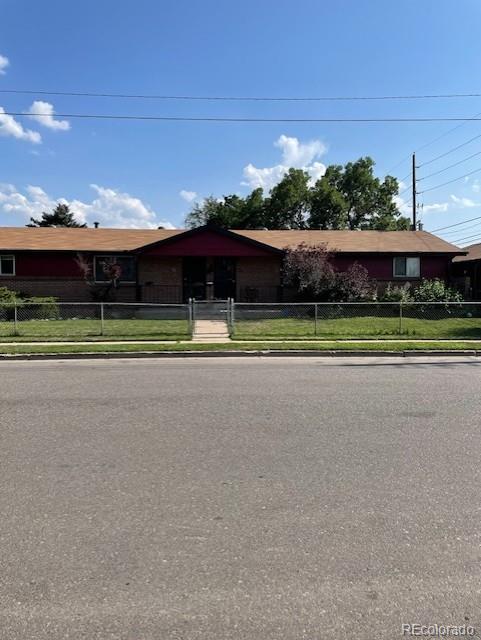
3685 S Hooker St, Englewood, CO 80110
$-620
Cash flow
-7.2%
Cash-on-Cash Return
4.0%
Cap rate
0.6%
Rent to Value Ratio
Active
$550,000
3
bds
|
2
ba
|
2,214
sqft
|
built
1951
4051 S Cherokee St, Englewood, CO 80110
$-704
Cash flow
-6.7%
Cash-on-Cash Return
4.1%
Cap rate
0.6%
Rent to Value Ratio
Active
$3,195,000
6
bds
|
6
ba
|
6,183
sqft
|
built
1971
4285 S Hudson Pkwy, Englewood, CO 80113
$-12,495
Cash flow
-20.4%
Cash-on-Cash Return
1.0%
Cap rate
0.2%
Rent to Value Ratio
Active
$475,000
3
bds
|
1
ba
|
1,009
sqft
|
built
1911
4079 S Bannock St, Englewood, CO 80110
$-659
Cash flow
-7.2%
Cash-on-Cash Return
4.0%
Cap rate
0.5%
Rent to Value Ratio
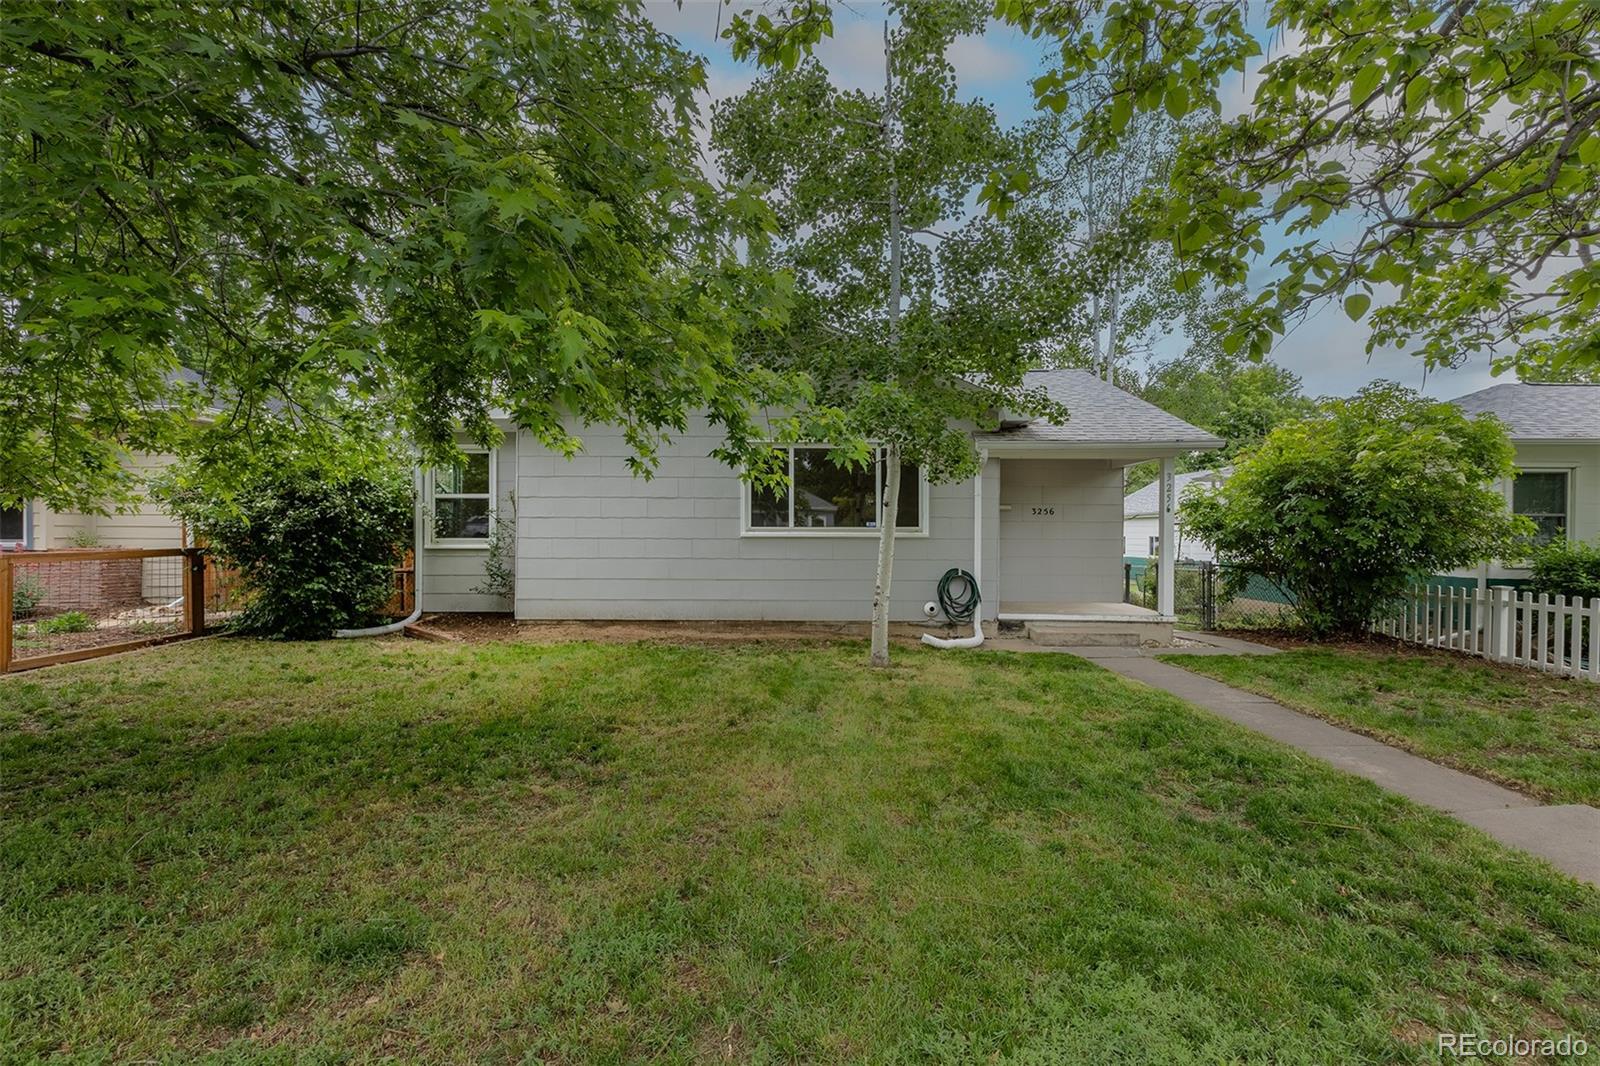
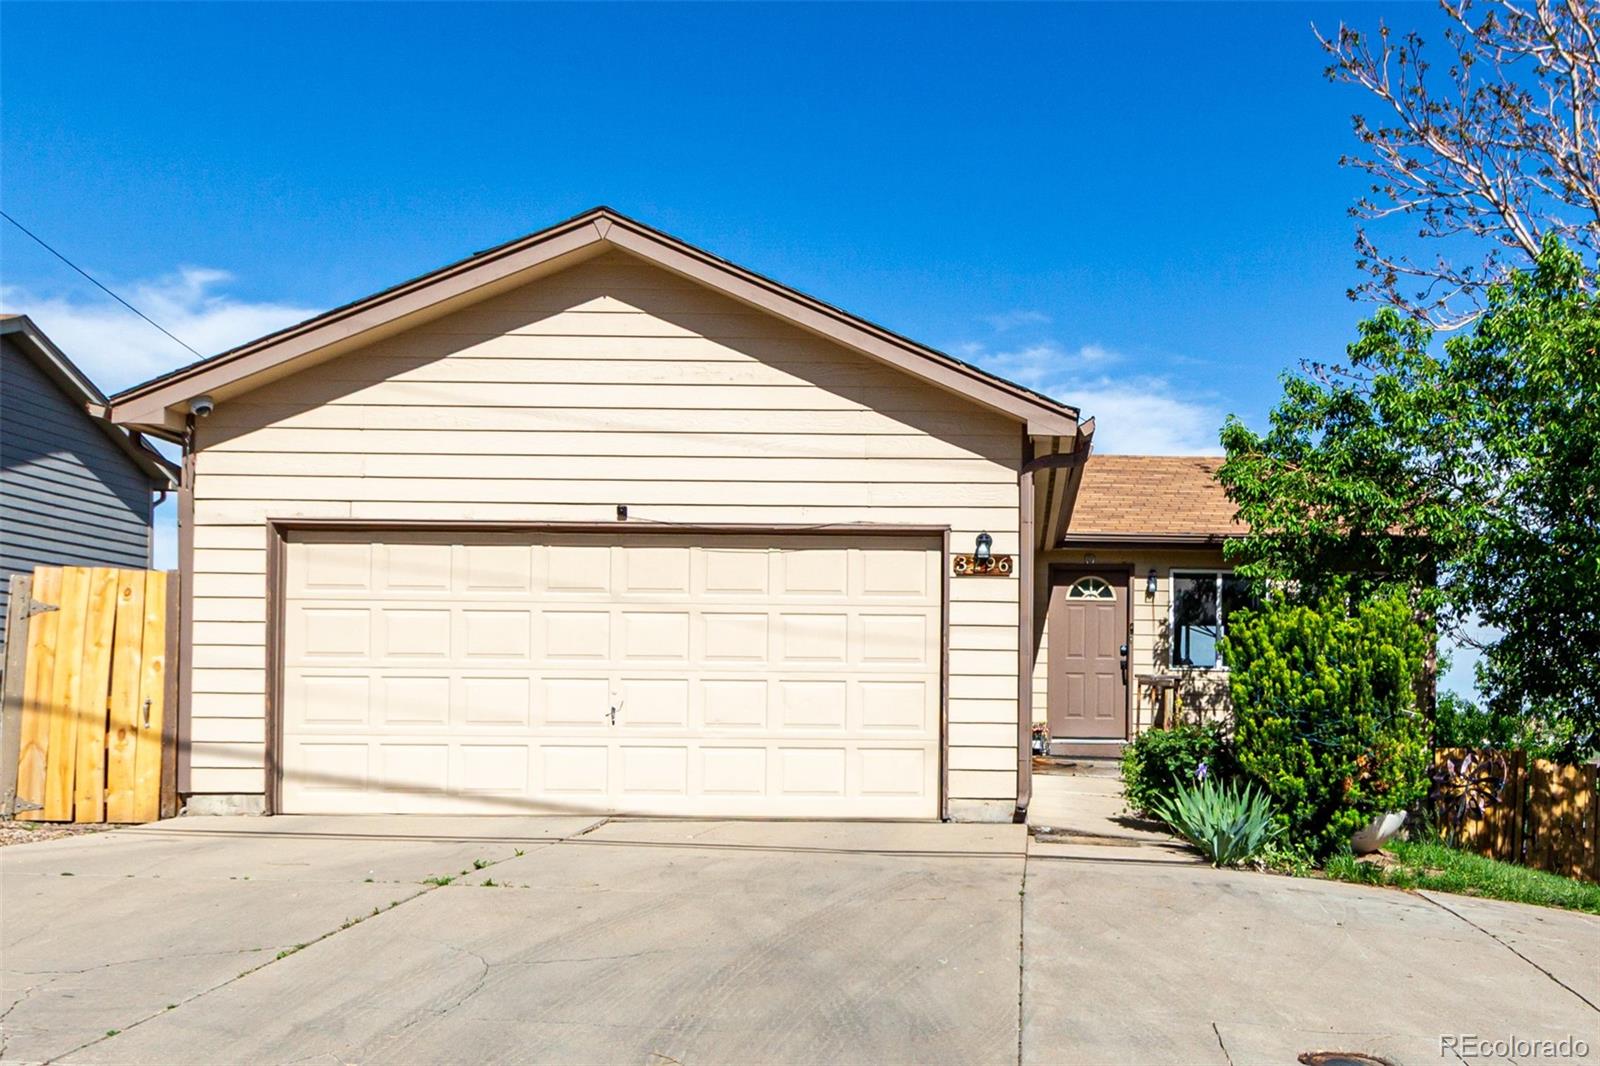
Active
$700,000
4
bds
|
2
ba
|
1,680
sqft
|
built
1953
3256 S Ogden St, Englewood, CO 80113
$-1,597
Cash flow
-11.9%
Cash-on-Cash Return
2.9%
Cap rate
0.4%
Rent to Value Ratio
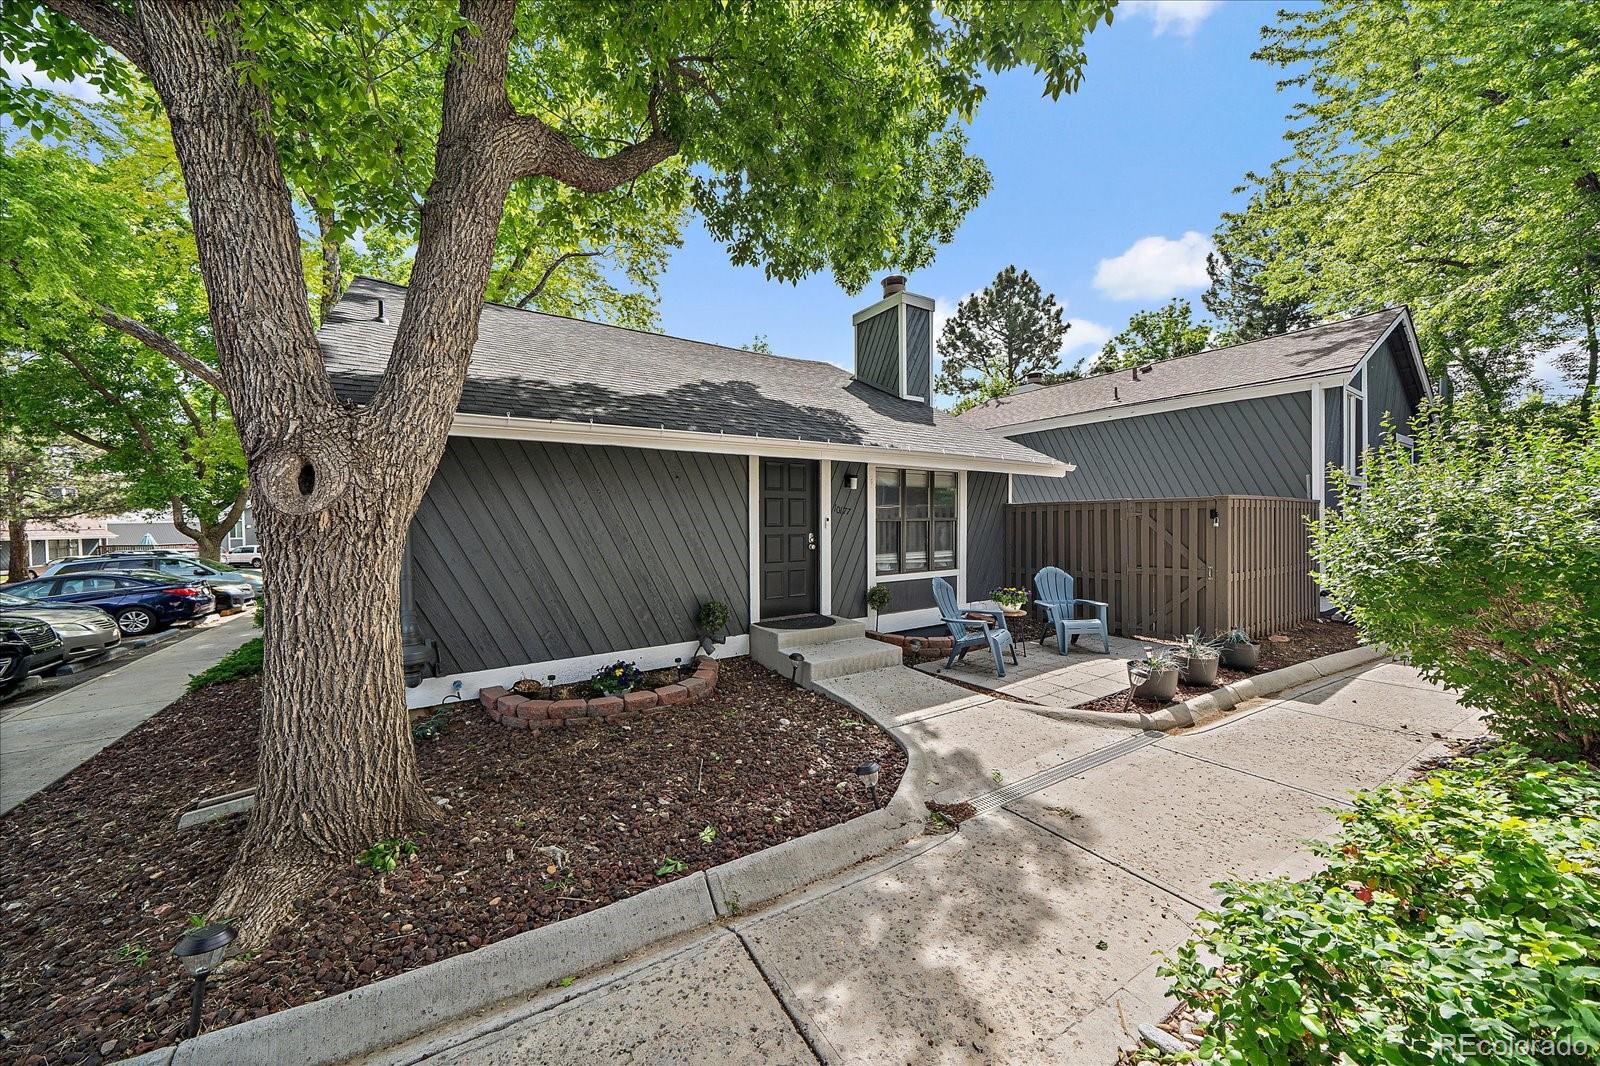
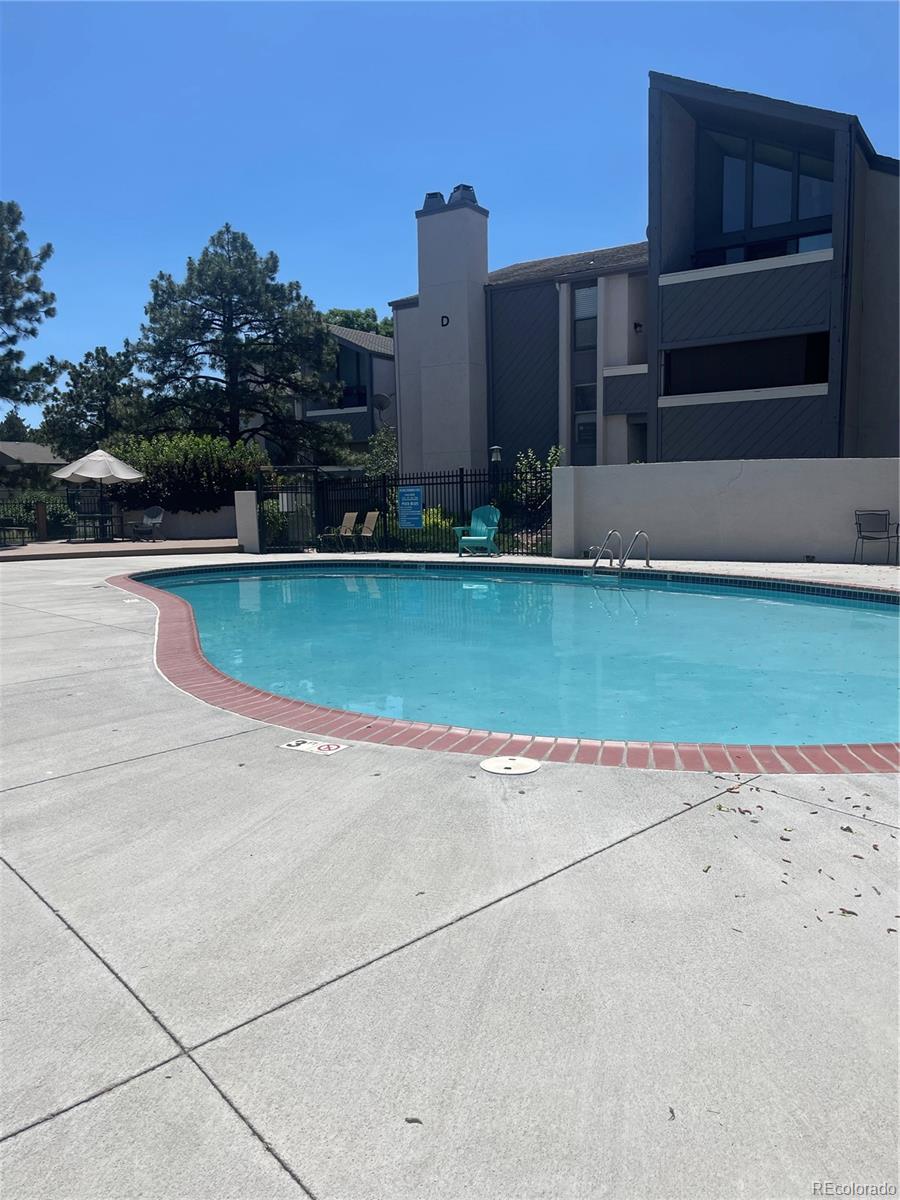
Active
$475,000
4
bds
|
3
ba
|
1,260
sqft
|
built
1979
10177 E Peakview Ave, Englewood, CO 80111
$-963
Cash flow
-10.6%
Cash-on-Cash Return
3.2%
Cap rate
0.5%
Rent to Value Ratio
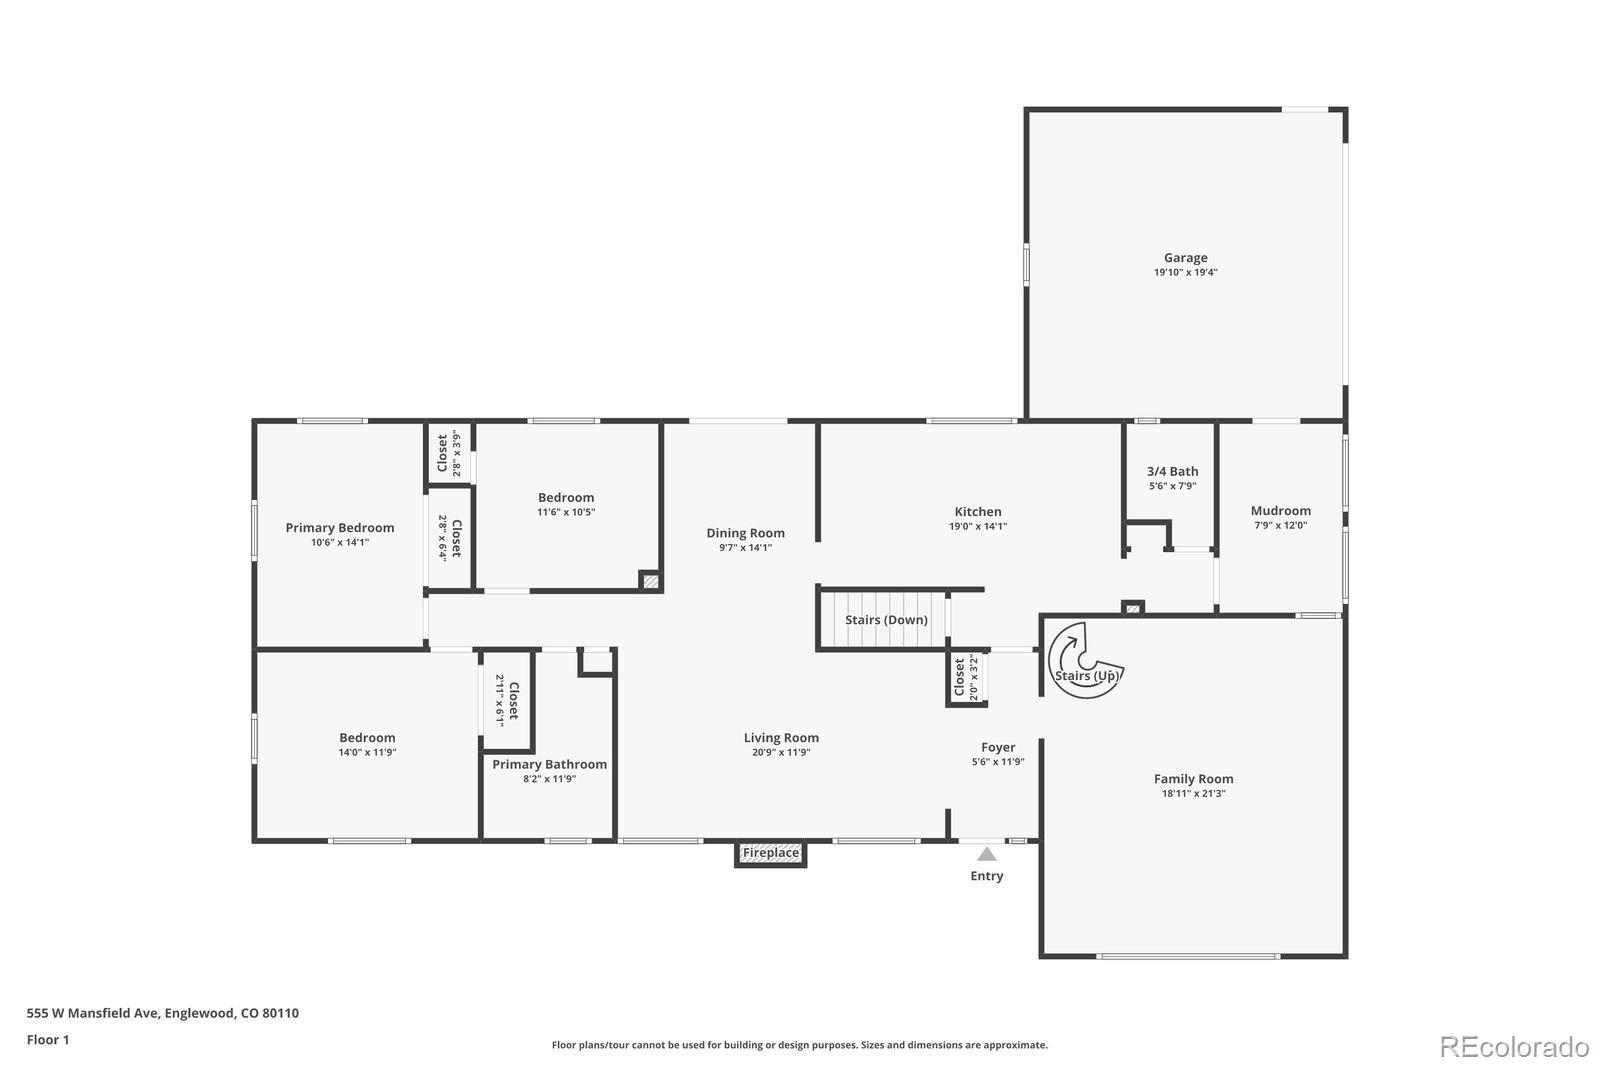
Active
$635,000
5
bds
|
3
ba
|
3,329
sqft
|
built
1952
555 W Mansfield Ave, Englewood, CO 80110
$-573
Cash flow
-4.7%
Cash-on-Cash Return
4.6%
Cap rate
0.6%
Rent to Value Ratio
Active
$185,000
1
bds
|
1
ba
|
648
sqft
|
built
1984
4681 S Decatur St, Englewood, CO 80110
$-117
Cash flow
-3.3%
Cash-on-Cash Return
4.9%
Cap rate
0.9%
Rent to Value Ratio
Active
$259,000
2
bds
|
1
ba
|
825
sqft
|
built
1979
6490 S Dayton St, Englewood, CO 80111
$-512
Cash flow
-10.3%
Cash-on-Cash Return
3.3%
Cap rate
0.7%
Rent to Value Ratio
Active
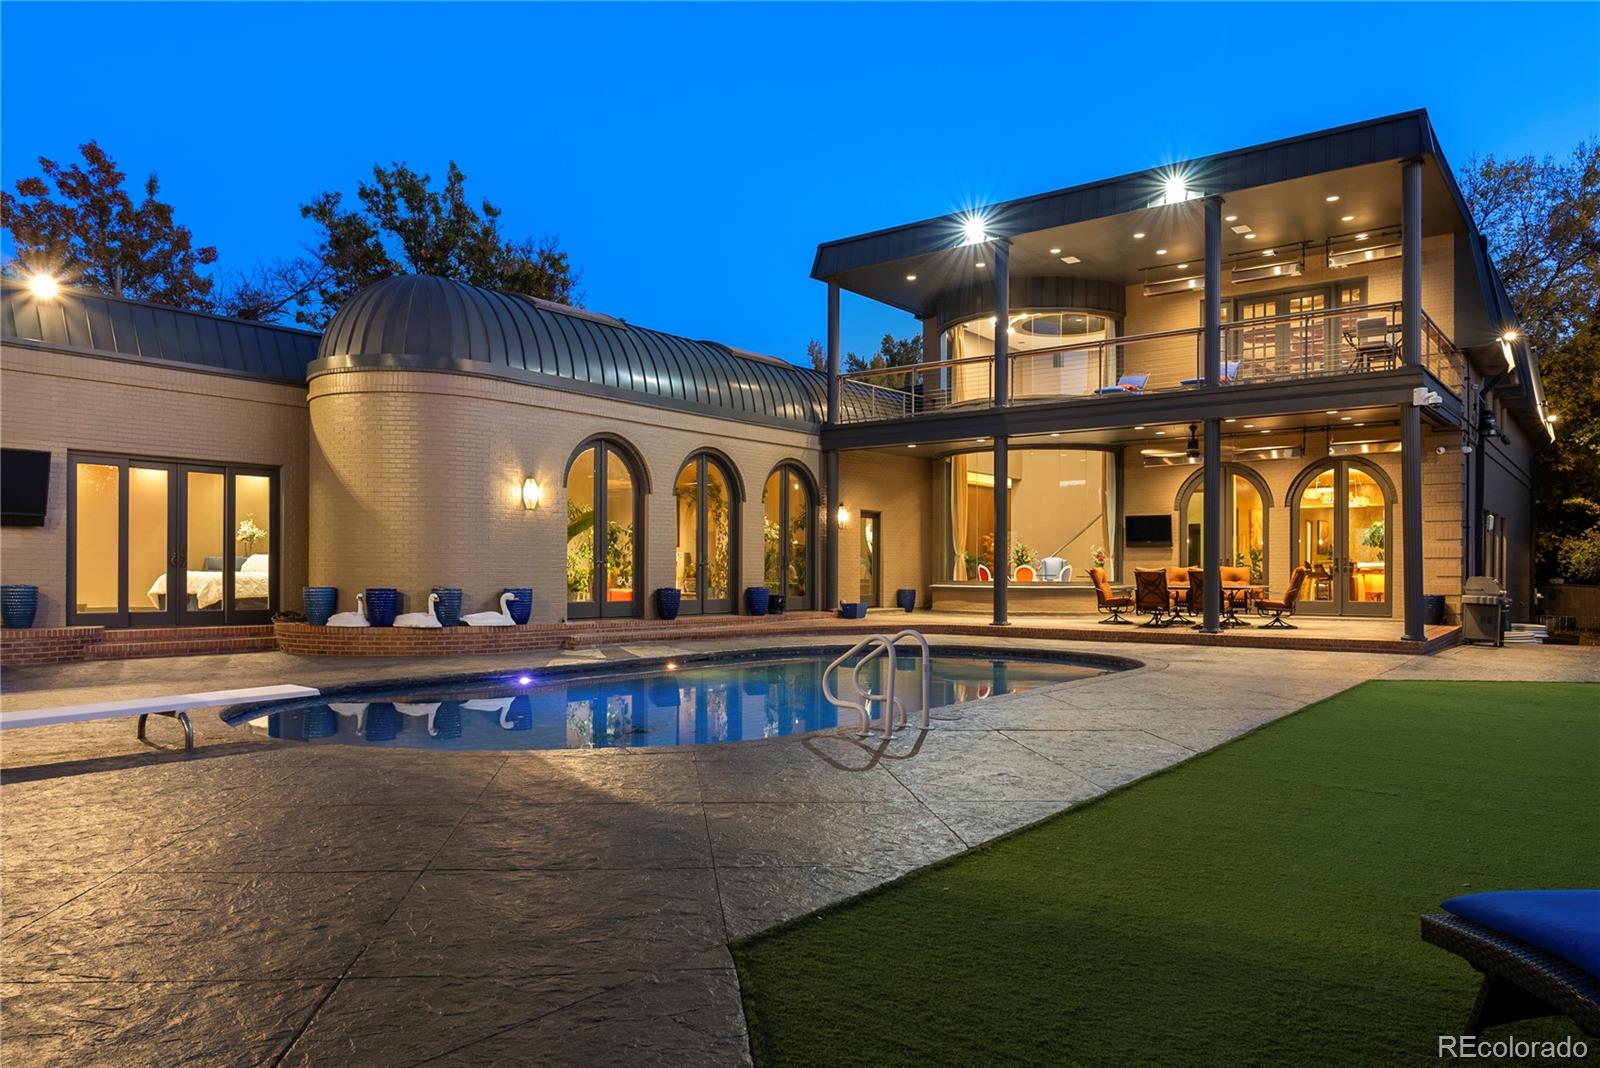
$3,400,000
4
bds
|
5
ba
|
5,219
sqft
|
built
1988
4845 S Gaylord St, Englewood, CO 80113
$-13,995
Cash flow
-21.5%
Cash-on-Cash Return
0.7%
Cap rate
0.2%
Rent to Value Ratio
Pending
$400,000
3
bds
|
1
ba
|
1,563
sqft
|
built
1953
595 W Eastman Ave, Englewood, CO 80110
$-191
Cash flow
-2.5%
Cash-on-Cash Return
5.1%
Cap rate
0.7%
Rent to Value Ratio
Active
$685,000
3
bds
|
2
ba
|
1,796
sqft
|
built
1946
2895 S Sherman St, Englewood, CO 80113
$-1,411
Cash flow
-10.7%
Cash-on-Cash Return
3.2%
Cap rate
0.5%
Rent to Value Ratio
Active
$390,000
2
bds
|
1
ba
|
814
sqft
|
built
1977
3446 S Clay St, Englewood, CO 80110
$-439
Cash flow
-5.9%
Cash-on-Cash Return
4.3%
Cap rate
0.6%
Rent to Value Ratio

Active
$18,000,000
6
bds
|
11
ba
|
21,009
sqft
|
built
2003
4603 S Denice Dr, Englewood, CO 80111
$-87,818
Cash flow
-25.5%
Cash-on-Cash Return
-0.2%
Cap rate
0.0%
Rent to Value Ratio
Active
$498,500
3
bds
|
3
ba
|
1,684
sqft
|
built
2001
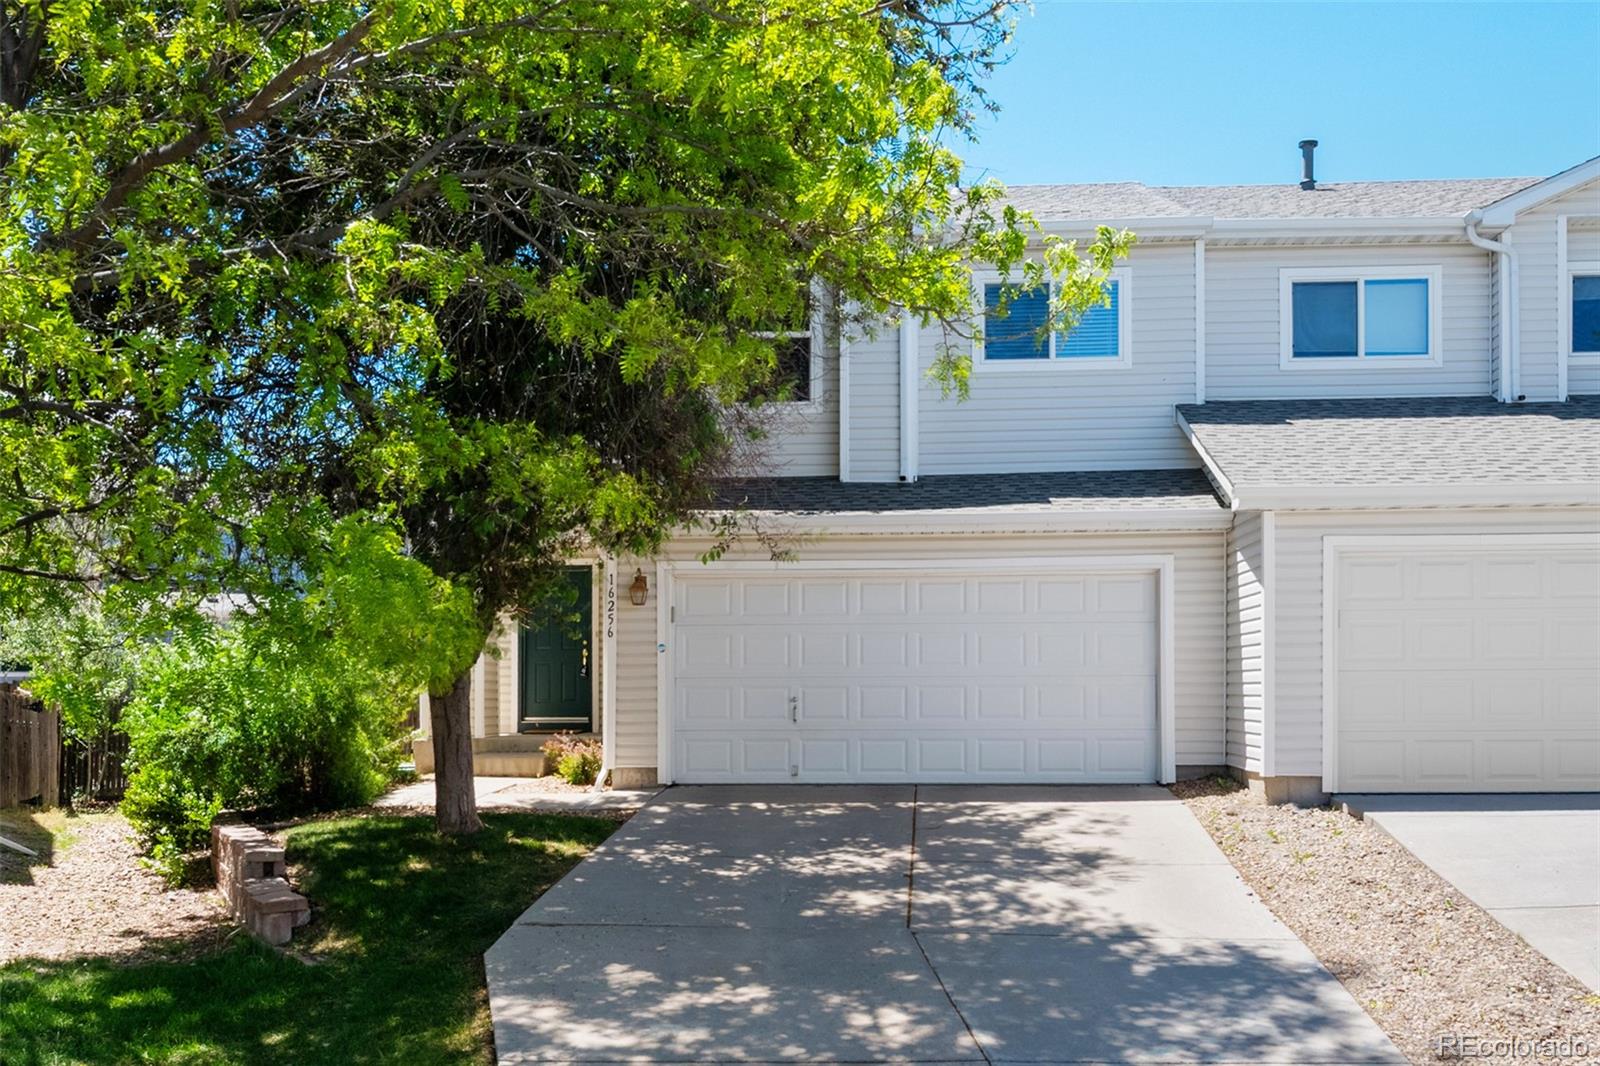
16256 E Otero Pl, Englewood, CO 80112
$-1,098
Cash flow
-11.5%
Cash-on-Cash Return
3.0%
Cap rate
0.5%
Rent to Value Ratio
Active
$5,800,000
8
bds
|
11
ba
|
14,481
sqft
|
built
1976
9 Sedgwick Dr, Englewood, CO 80113
$-23,836
Cash flow
-21.4%
Cash-on-Cash Return
0.7%
Cap rate
0.2%
Rent to Value Ratio
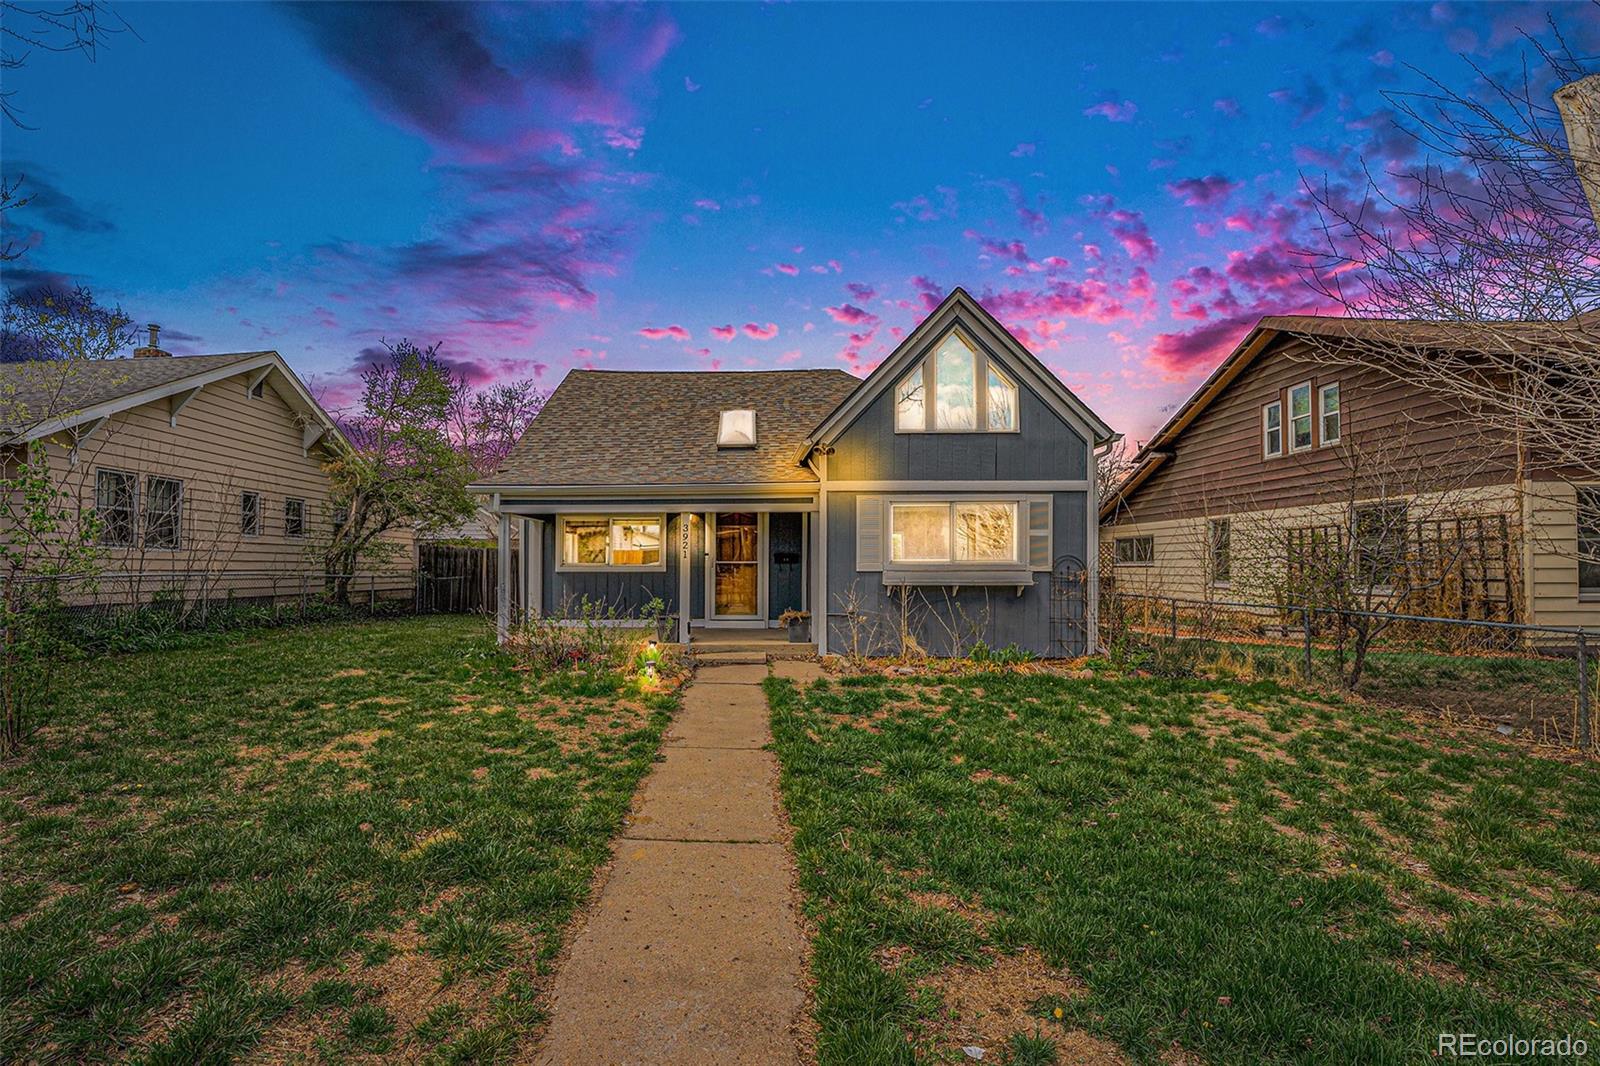
Active
$510,000
3
bds
|
1
ba
|
1,326
sqft
|
built
1906
3921 S Acoma St, Englewood, CO 80110
$-501
Cash flow
-5.1%
Cash-on-Cash Return
4.5%
Cap rate
0.6%
Rent to Value Ratio
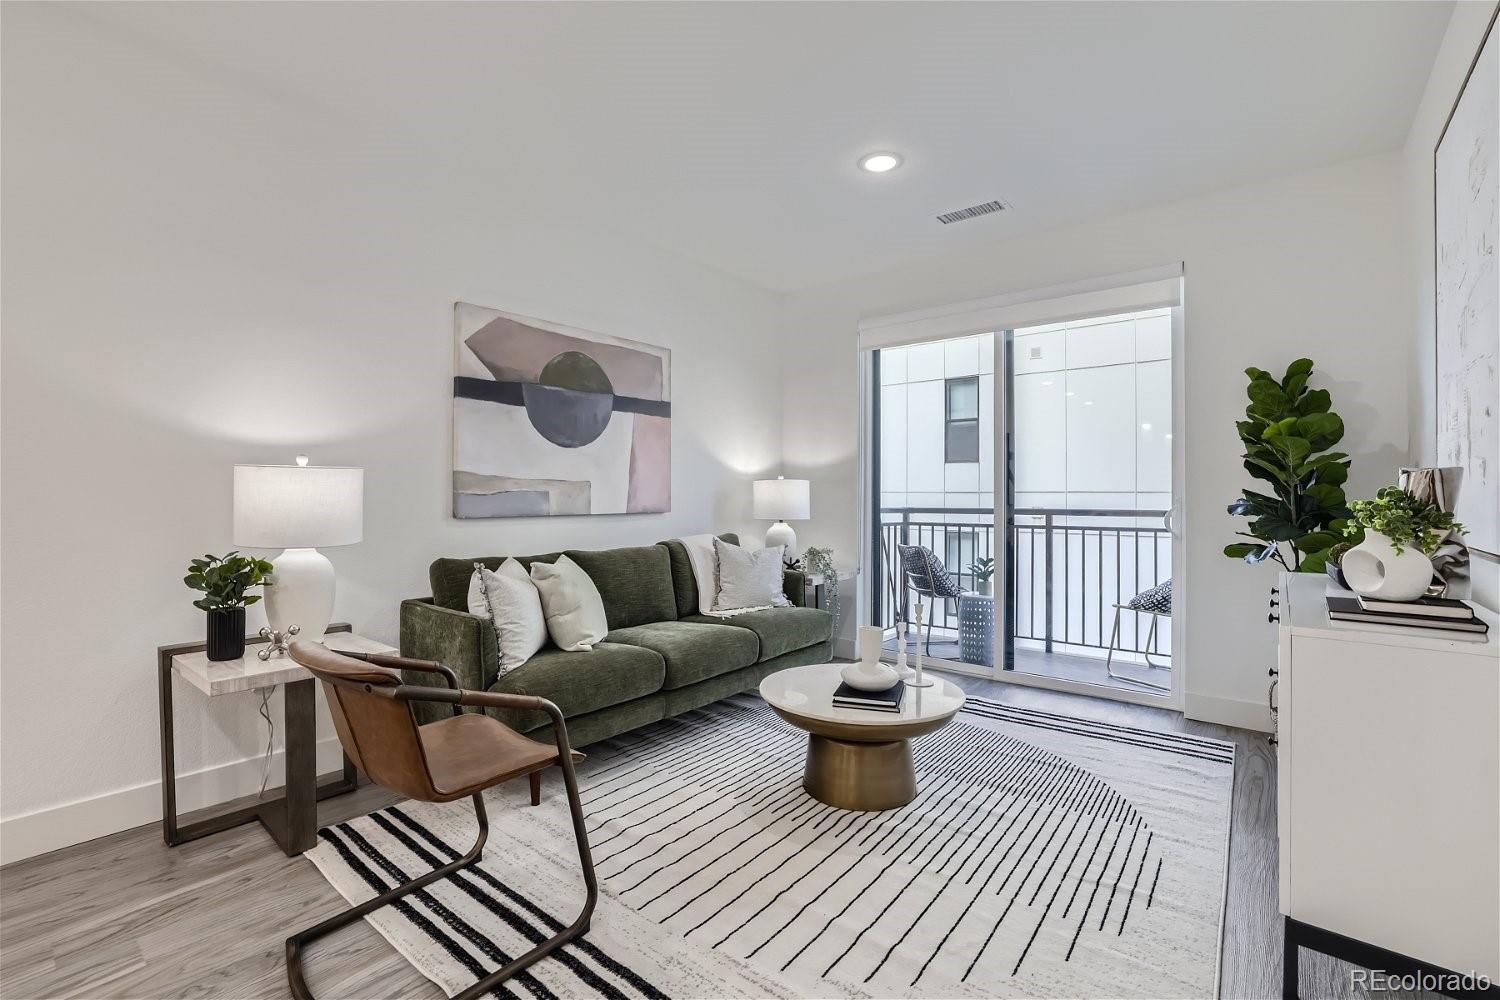
Active
$479,000
2
bds
|
2
ba
|
988
sqft
|
built
2020
3500 S Corona St, Englewood, CO 80113
$-1,515
Cash flow
-16.5%
Cash-on-Cash Return
1.9%
Cap rate
0.4%
Rent to Value Ratio
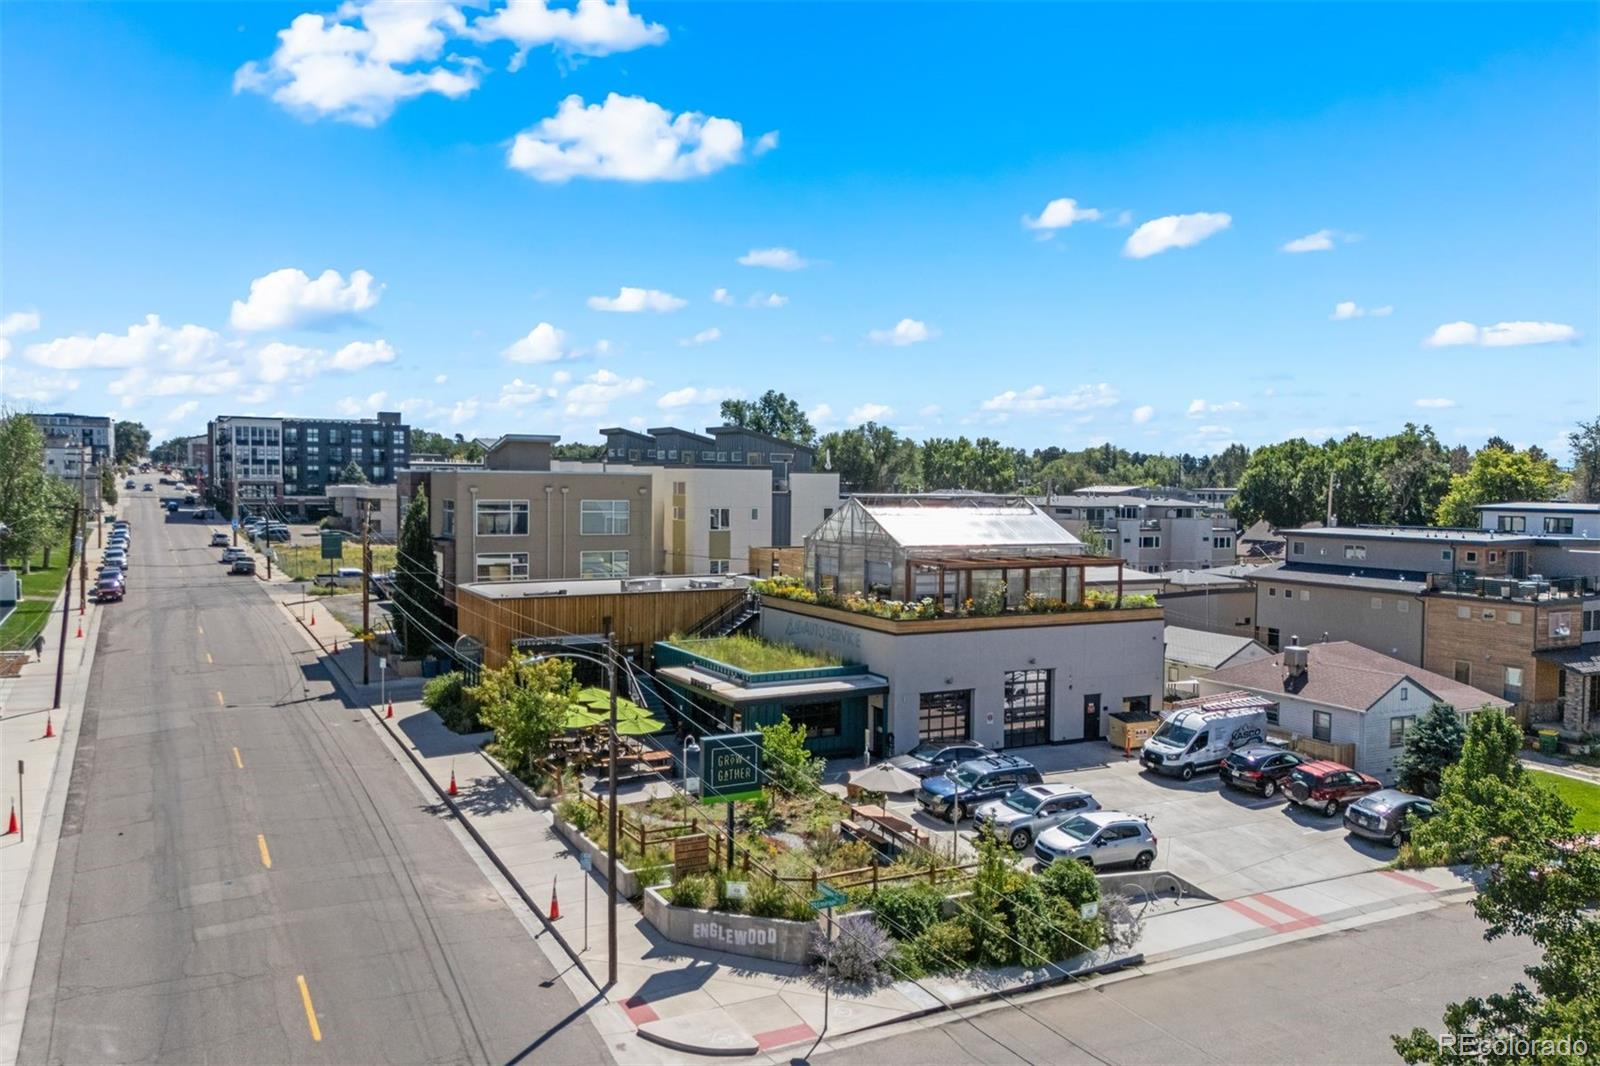
Active
$247,499
1
bds
|
1
ba
|
702
sqft
|
built
1982
311 W Lehow Ave, Englewood, CO 80110
$-414
Cash flow
-8.7%
Cash-on-Cash Return
3.7%
Cap rate
0.7%
Rent to Value Ratio

Active
$599,000
4
bds
|
2
ba
|
2,136
sqft
|
built
1951
3831 S Fox St, Englewood, CO 80110
$-866
Cash flow
-7.5%
Cash-on-Cash Return
3.9%
Cap rate
0.5%
Rent to Value Ratio
Active
$535,000
3
bds
|
2
ba
|
832
sqft
|
built
1954
4624 S Lincoln St, Englewood, CO 80113
$-954
Cash flow
-9.3%
Cash-on-Cash Return
3.5%
Cap rate
0.5%
Rent to Value Ratio
Active
$2,750,000
6
bds
|
7
ba
|
5,018
sqft
|
built
1975
3500 S Franklin St, Englewood, CO 80113
$-7,672
Cash flow
-14.6%
Cash-on-Cash Return
2.3%
Cap rate
0.3%
Rent to Value Ratio
Active
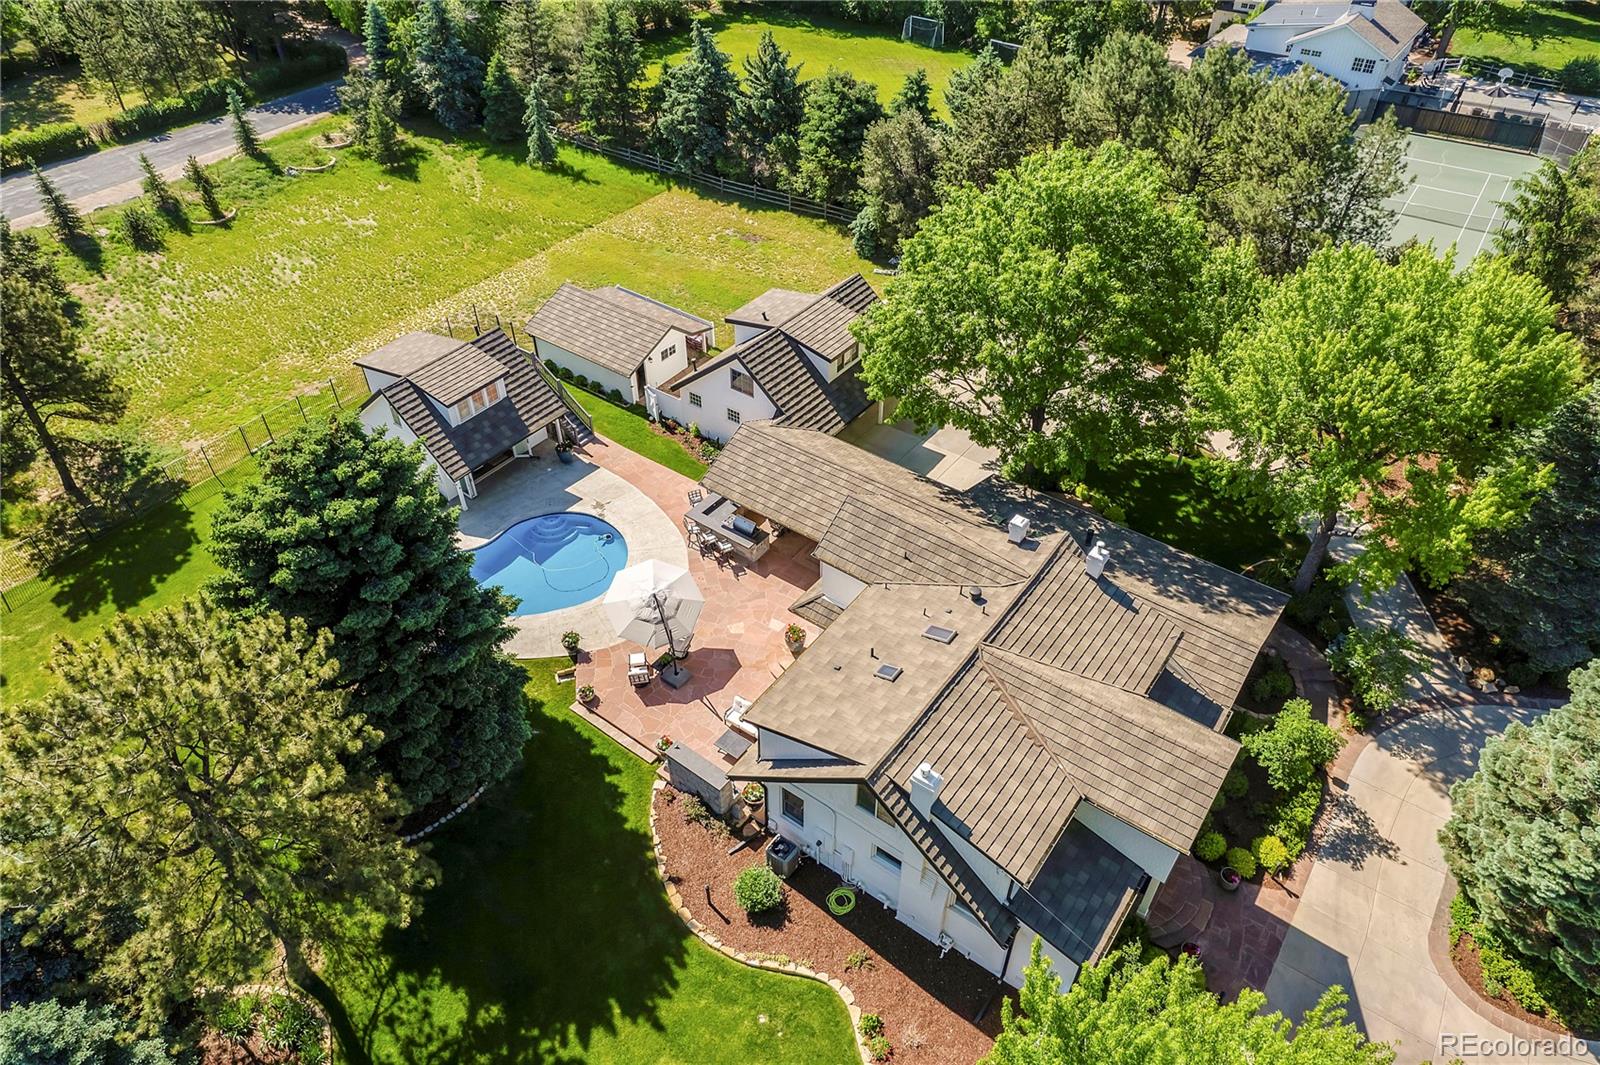
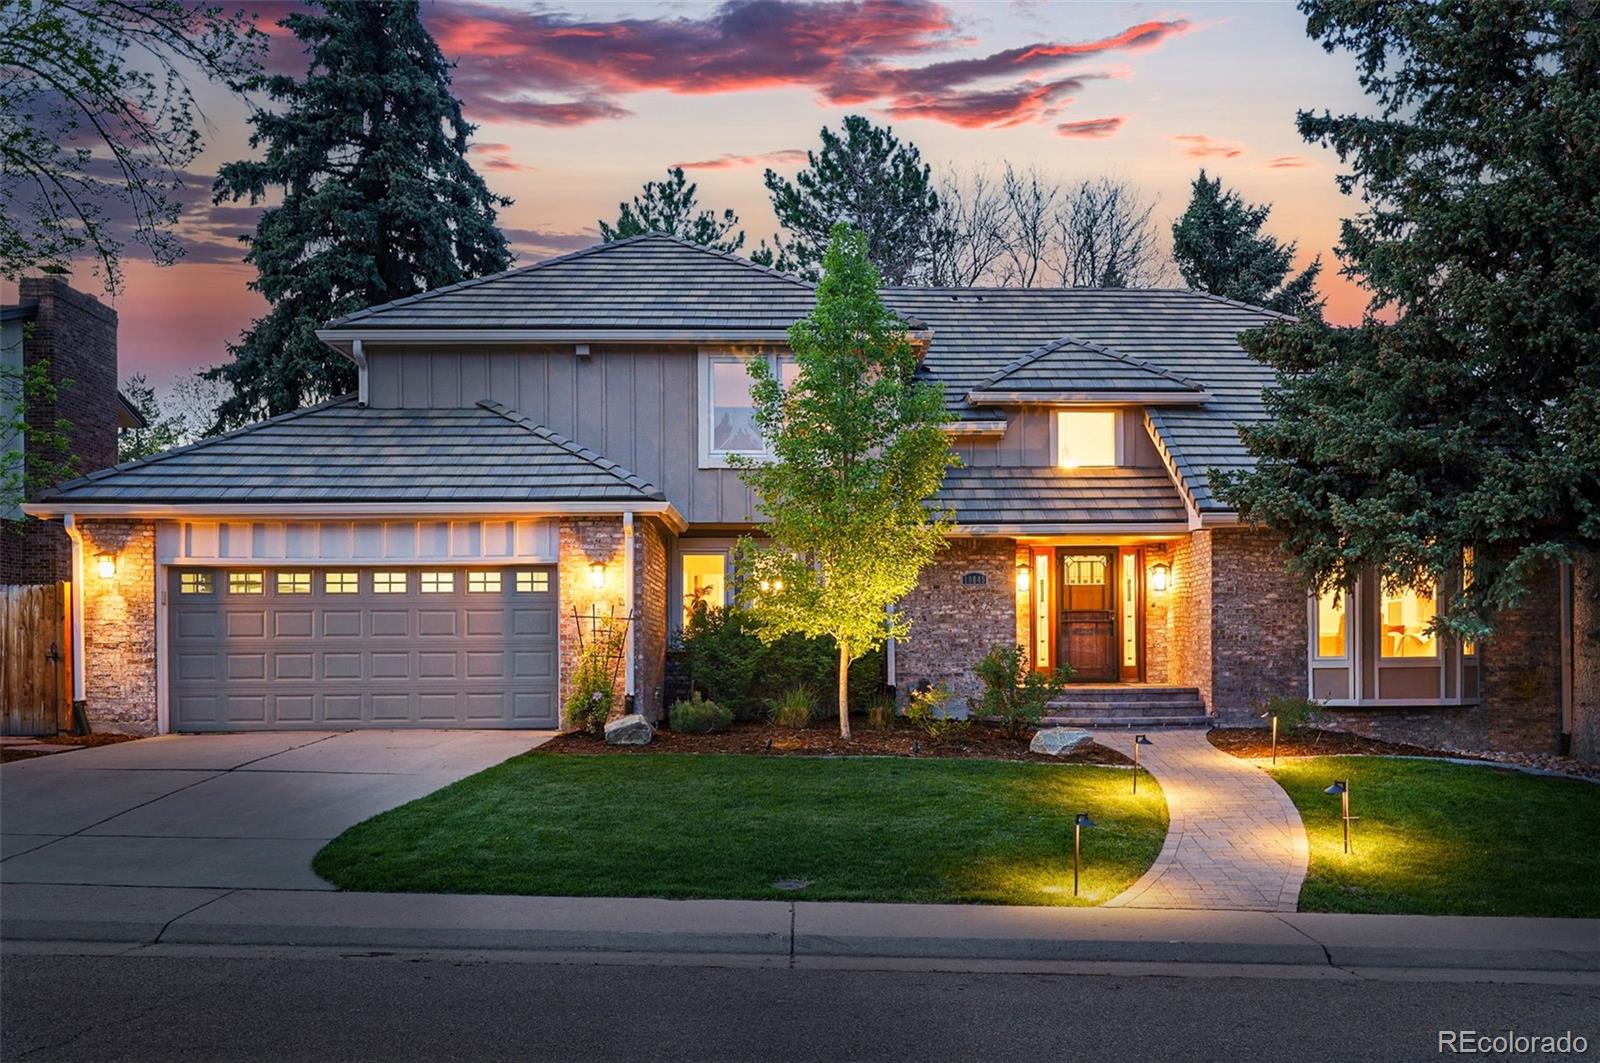
$1,475,000
4
bds
|
4
ba
|
4,271
sqft
|
built
1978
10849 E Crestridge Cir, Englewood, CO 80111
$-4,760
Cash flow
-16.8%
Cash-on-Cash Return
1.8%
Cap rate
0.3%
Rent to Value Ratio
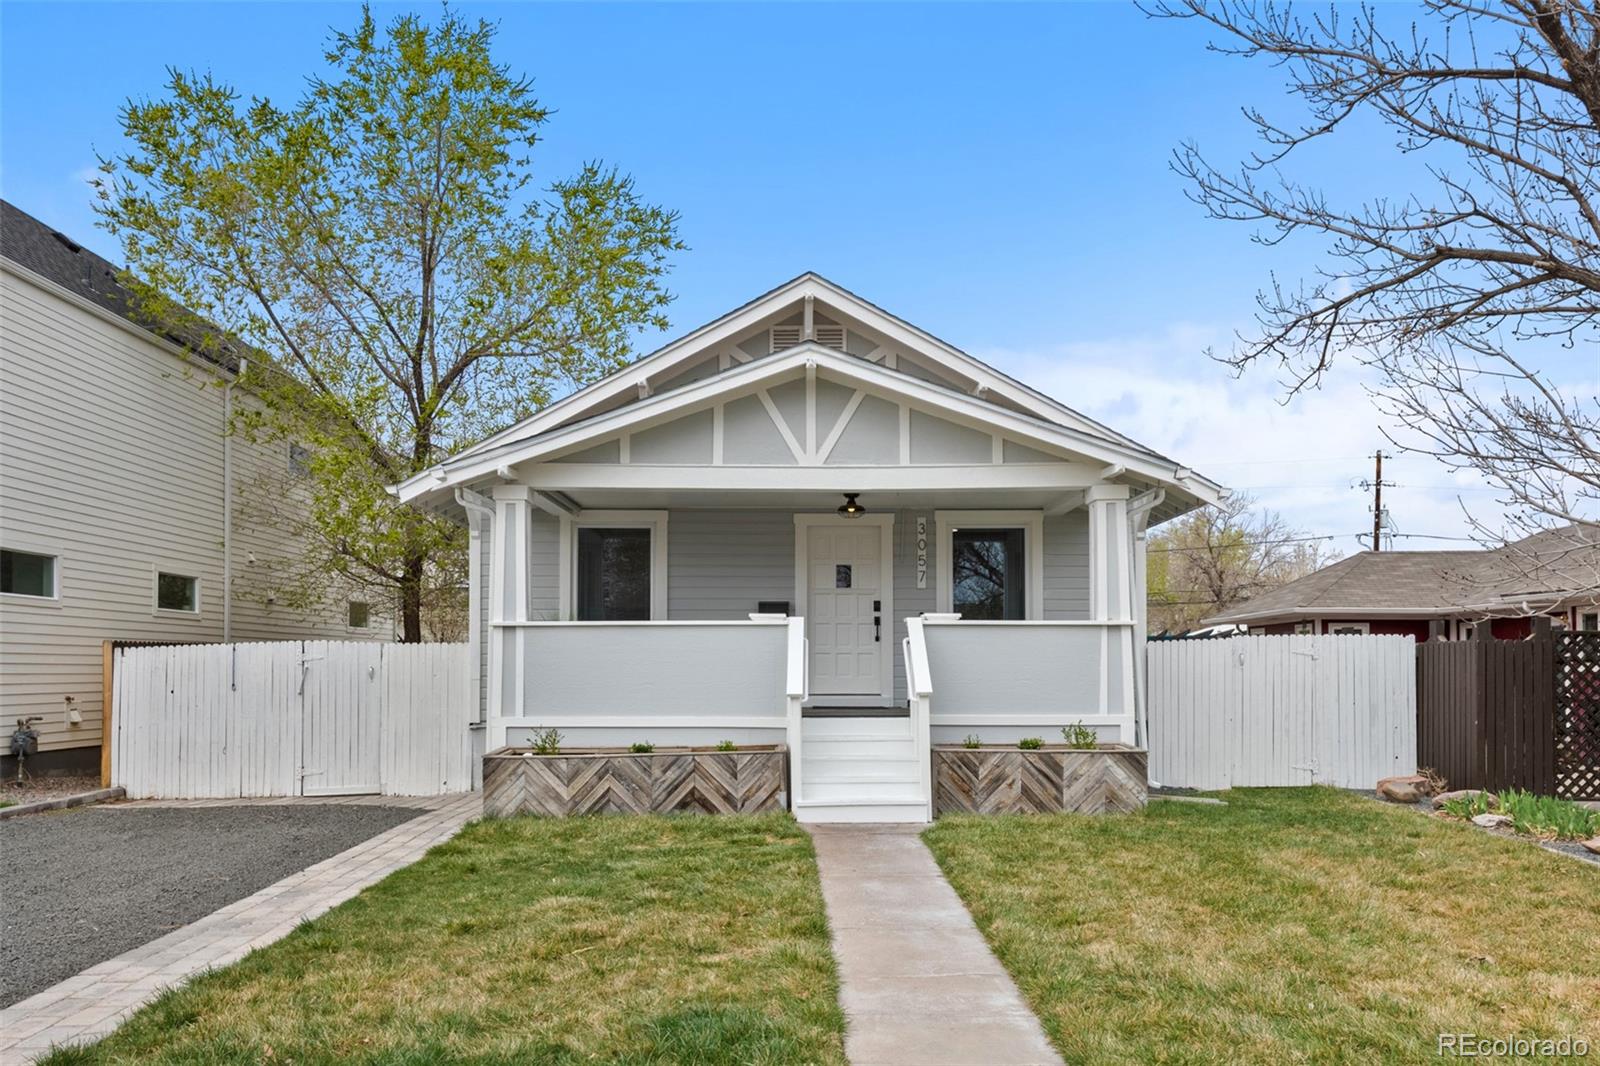
Active under contract
$650,000
3
bds
|
2
ba
|
2,251
sqft
|
built
1932
3057 S Fox St, Englewood, CO 80110
$-1,104
Cash flow
-8.9%
Cash-on-Cash Return
3.6%
Cap rate
0.5%
Rent to Value Ratio
Active
$1,500,000
2
bds
|
1
ba
|
1,212
sqft
|
built
1920
3225 S Lincoln St, Englewood, CO 80113
$-5,549
Cash flow
-19.3%
Cash-on-Cash Return
1.2%
Cap rate
0.2%
Rent to Value Ratio
Active
$2,750,000
5
bds
|
6
ba
|
6,056
sqft
|
built
1959
3980 S Dexter St, Englewood, CO 80113
$-9,285
Cash flow
-17.6%
Cash-on-Cash Return
1.6%
Cap rate
0.3%
Rent to Value Ratio
Active
$864,000
4
bds
|
4
ba
|
2,534
sqft
|
built
1978
10158 E Fair Cir, Englewood, CO 80111
$-2,203
Cash flow
-13.3%
Cash-on-Cash Return
2.6%
Cap rate
0.4%
Rent to Value Ratio
Closed
$360,000
3
bds
|
1
ba
|
1,150
sqft
|
built
1959
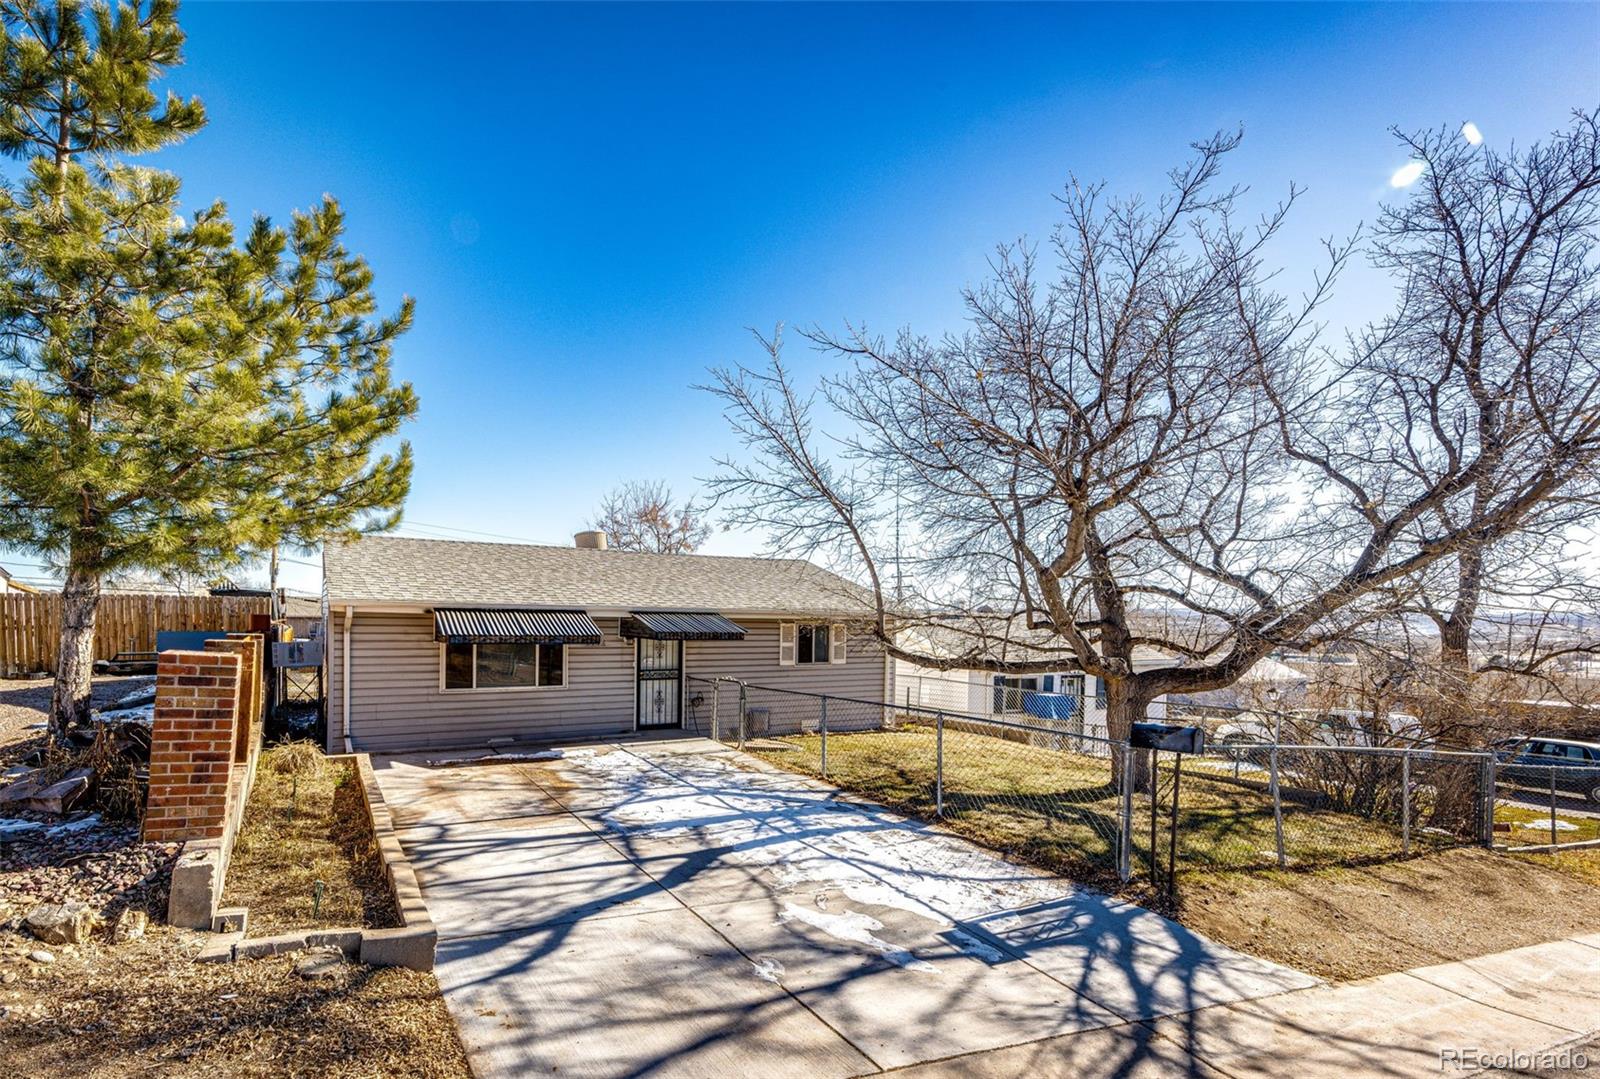
3930 S Hazel Ct, Englewood, CO 80110
$-352
Cash flow
-5.1%
Cash-on-Cash Return
4.5%
Cap rate
0.6%
Rent to Value Ratio
Active
$480,000
4
bds
|
2
ba
|
1,728
sqft
|
built
2000
3296 S Bryant St, Englewood, CO 80110
$-804
Cash flow
-8.7%
Cash-on-Cash Return
3.7%
Cap rate
0.5%
Rent to Value Ratio
Active
$239,000
1
bds
|
1
ba
|
709
sqft
|
built
1979
6410 S Dayton St, Englewood, CO 80111
$-406
Cash flow
-8.9%
Cash-on-Cash Return
3.6%
Cap rate
0.8%
Rent to Value Ratio

Active
$575,000
3
bds
|
1
ba
|
1,367
sqft
|
built
1955
3075 S Emerson Way, Englewood, CO 80113
$-836
Cash flow
-7.6%
Cash-on-Cash Return
3.9%
Cap rate
0.5%
Rent to Value Ratio
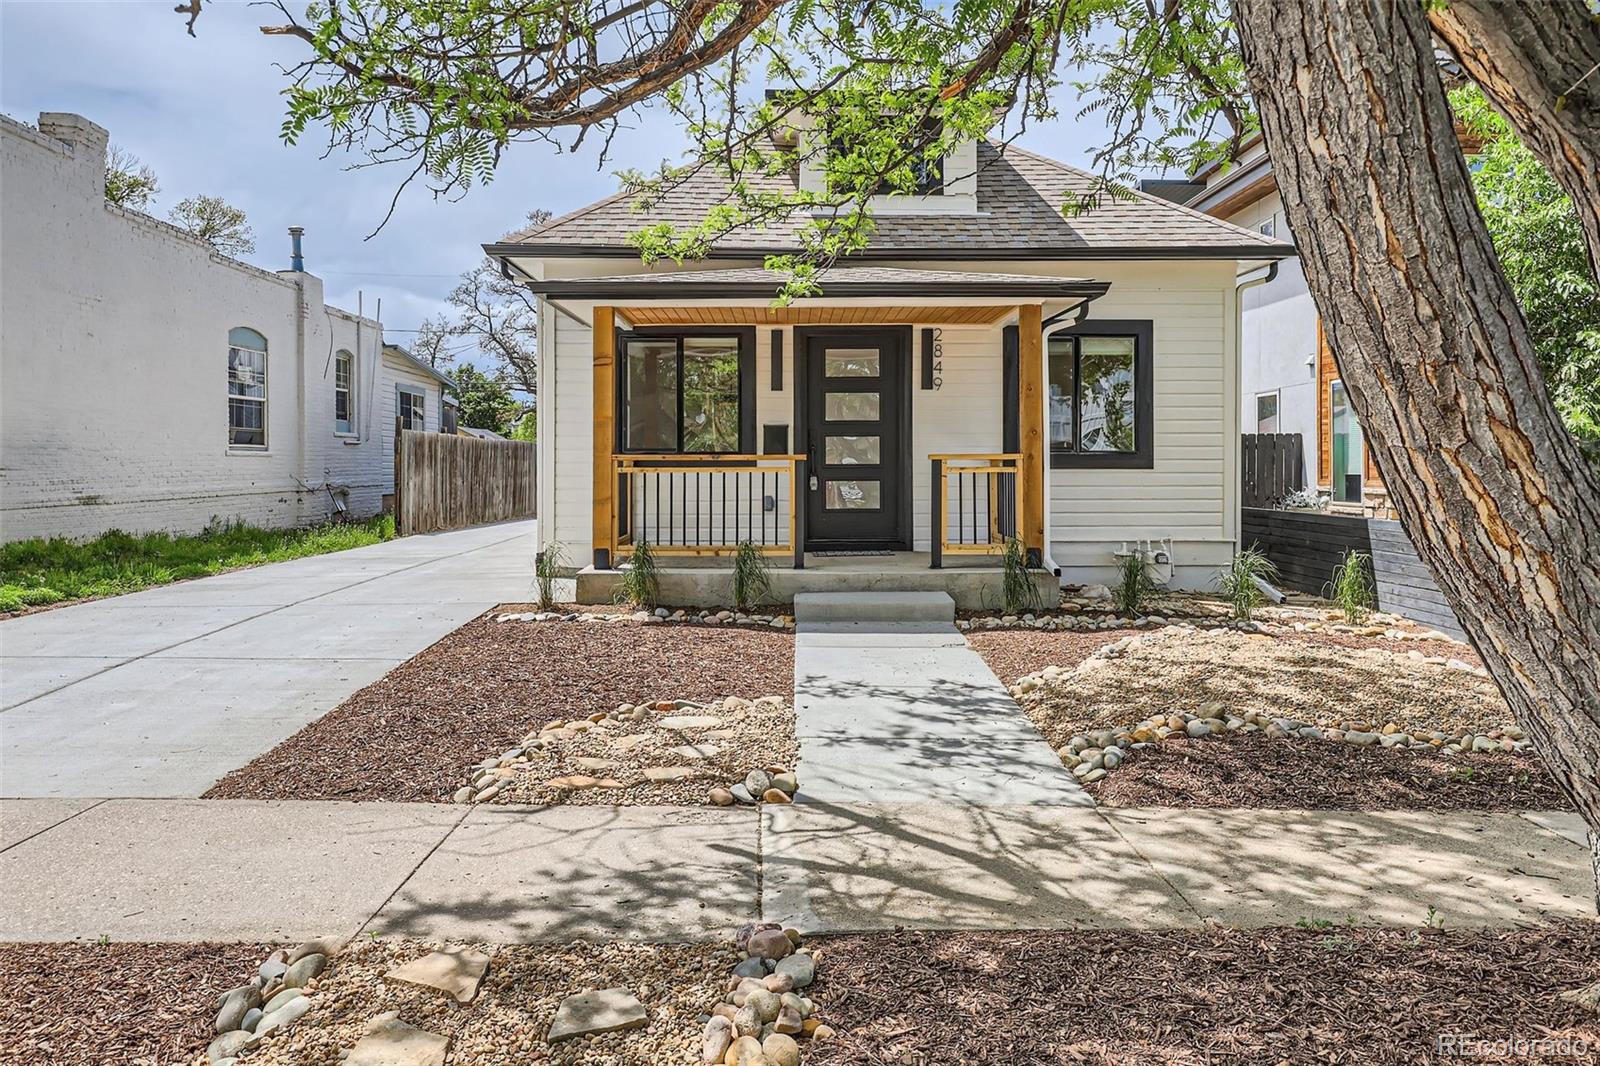
Active
$669,950
2
bds
|
2
ba
|
1,242
sqft
|
built
1905
2849 S Bannock St, Englewood, CO 80110
$-2,111
Cash flow
-16.4%
Cash-on-Cash Return
1.9%
Cap rate
0.3%
Rent to Value Ratio
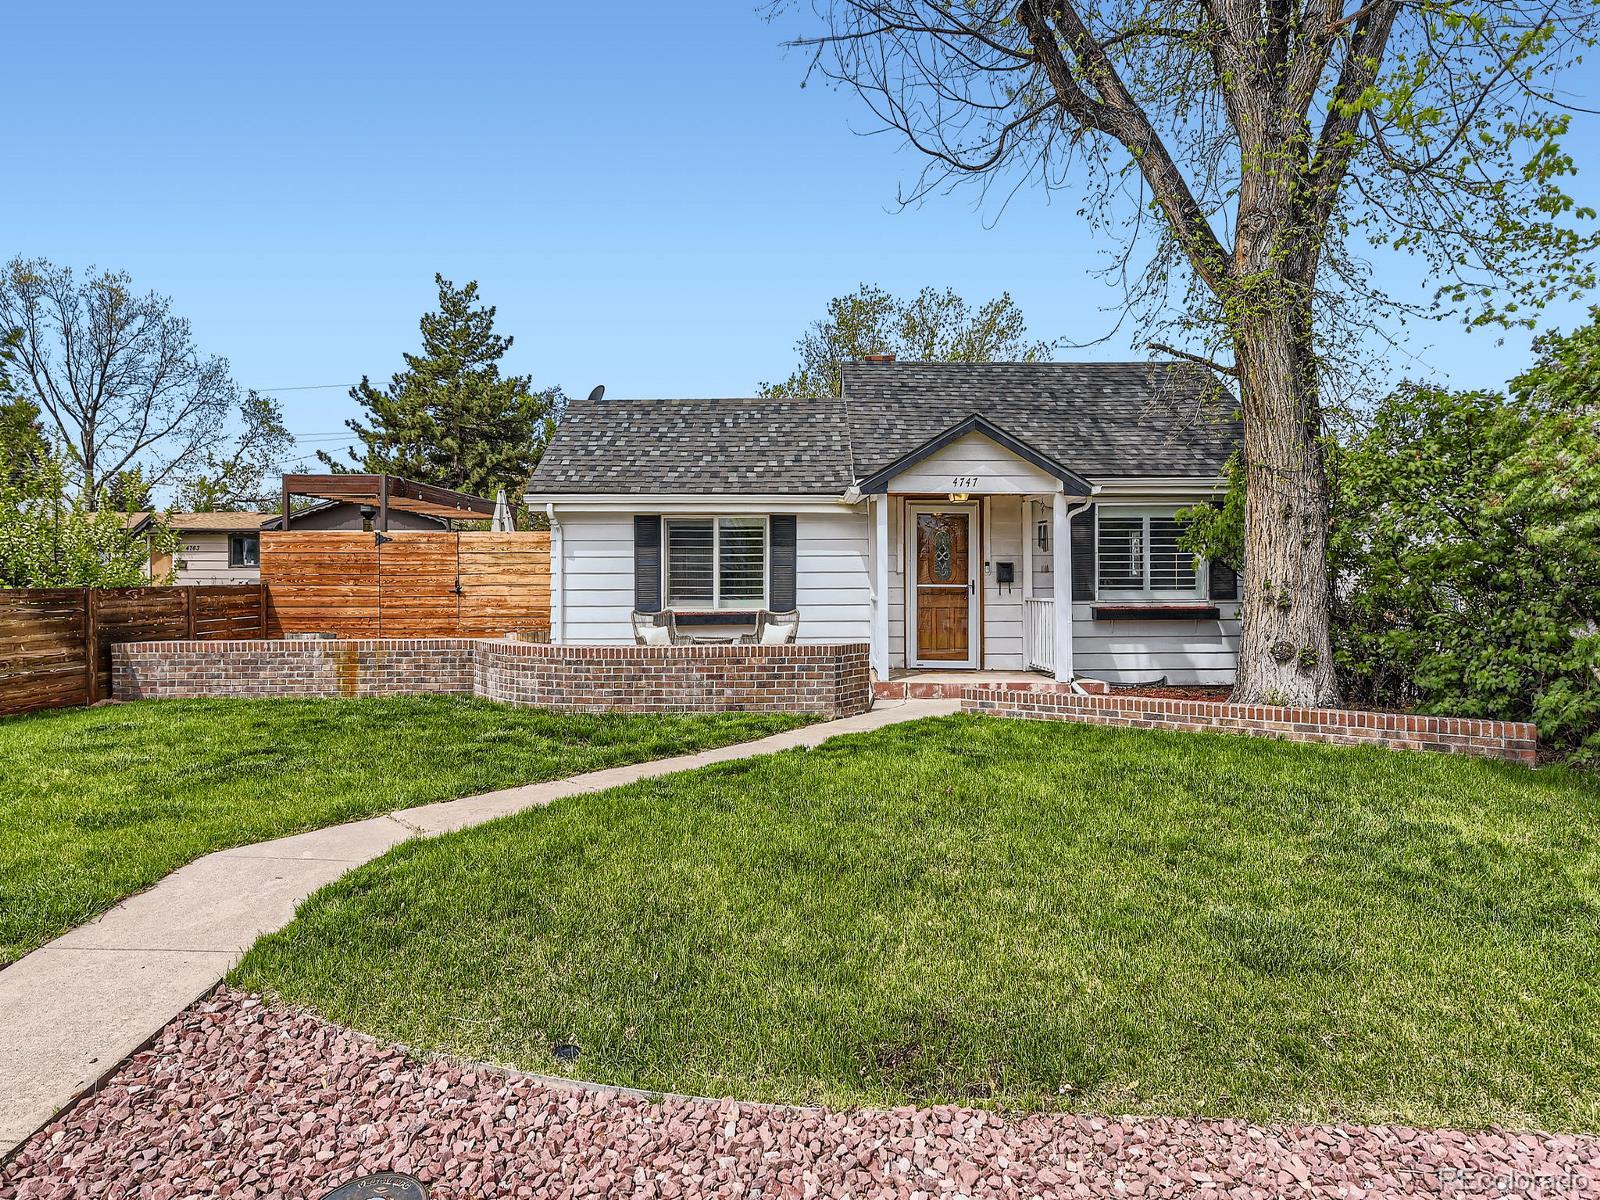
Active
$515,000
2
bds
|
1
ba
|
995
sqft
|
built
1941
4747 S Elati St, Englewood, CO 80110
$-835
Cash flow
-8.5%
Cash-on-Cash Return
3.7%
Cap rate
0.5%
Rent to Value Ratio
Active
$825,000
4
bds
|
4
ba
|
3,850
sqft
|
built
1974
60 E Bates Ave, Englewood, CO 80113
$-3,000
Cash flow
-19.0%
Cash-on-Cash Return
1.3%
Cap rate
0.2%
Rent to Value Ratio
Active
$4,100,000
5
bds
|
6
ba
|
6,166
sqft
|
built
1991
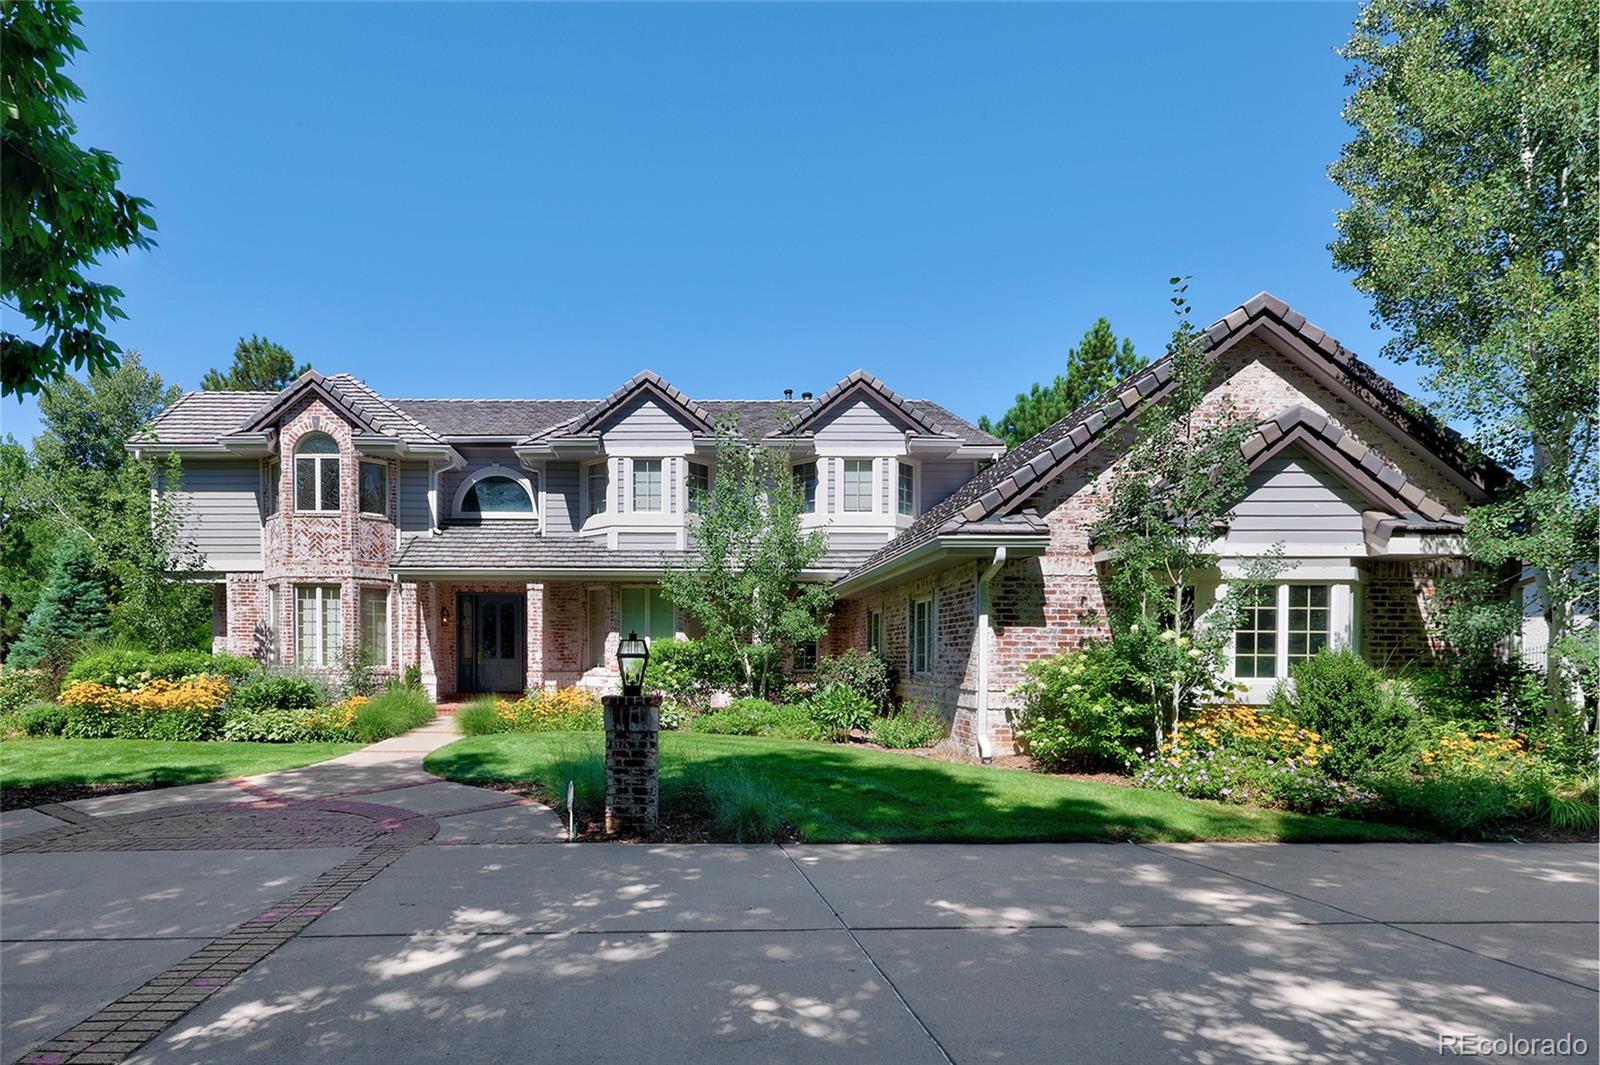
93 Glenmoor Dr, Englewood, CO 80113
$-17,973
Cash flow
-22.9%
Cash-on-Cash Return
0.4%
Cap rate
0.1%
Rent to Value Ratio
Active
$625,000
4
bds
|
2
ba
|
1,585
sqft
|
built
1948
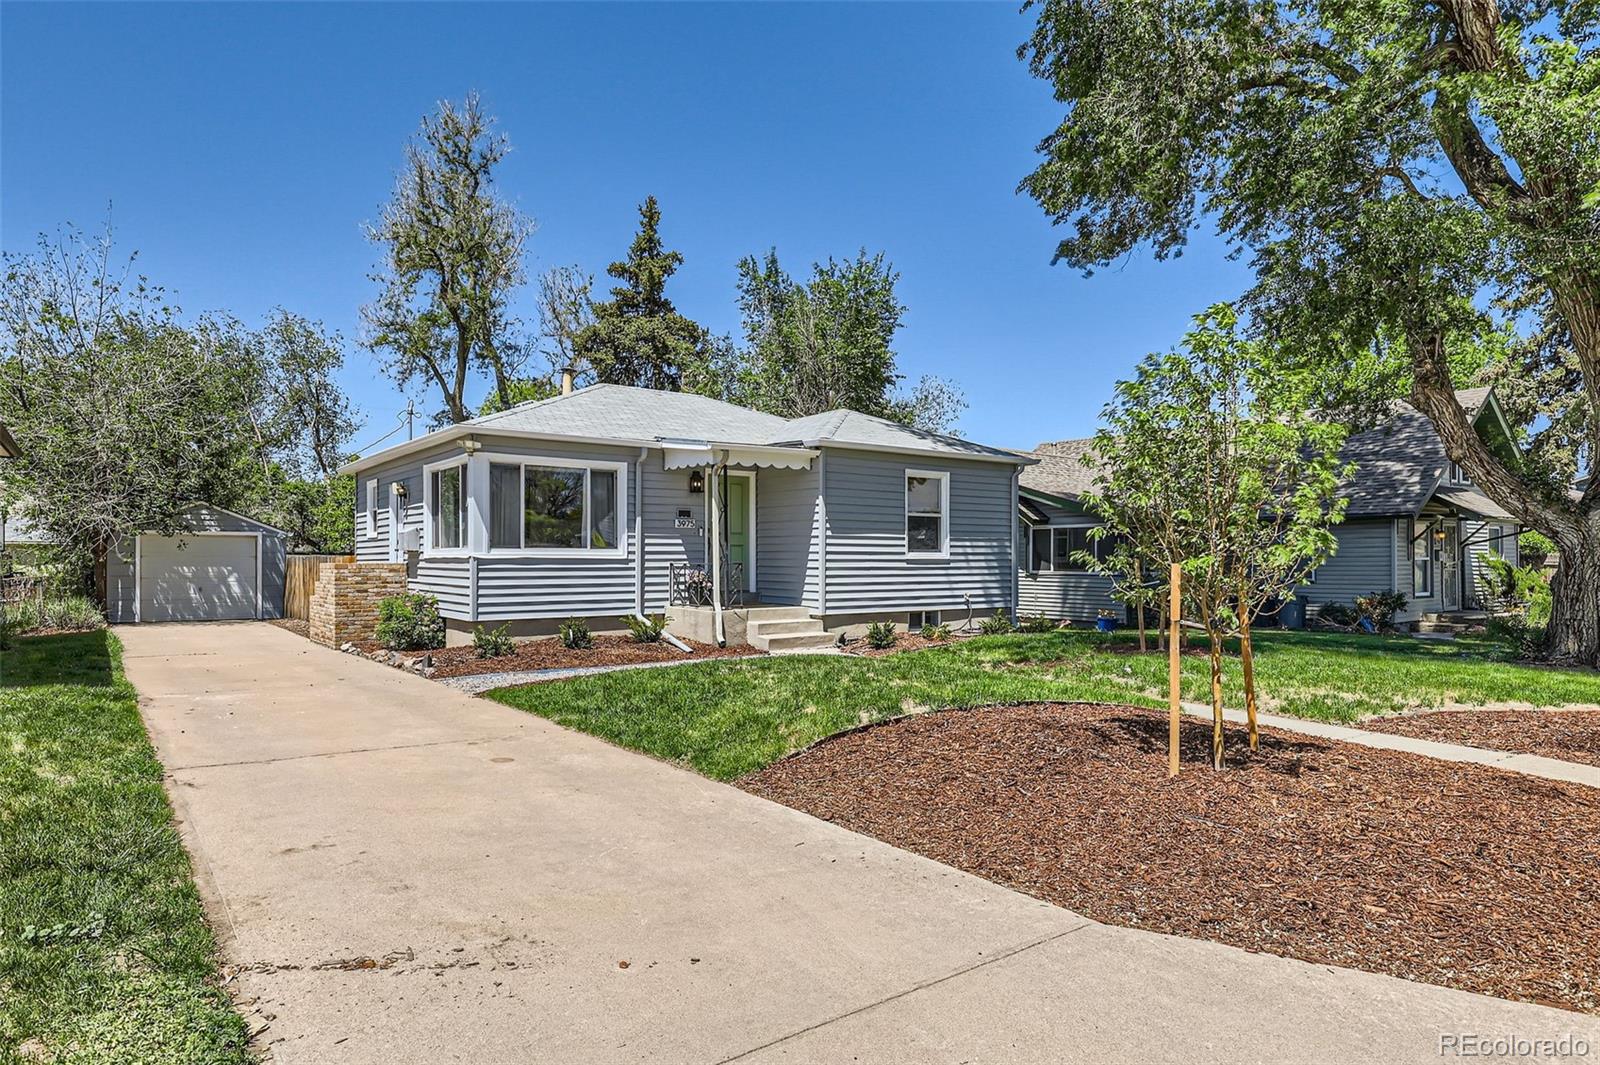
3975 S Logan St, Englewood, CO 80113
$-1,277
Cash flow
-10.7%
Cash-on-Cash Return
3.2%
Cap rate
0.4%
Rent to Value Ratio
Active
$5,500,000
5
bds
|
9
ba
|
7,839
sqft
|
built
1999
13 Buell Mansion Pkwy, Englewood, CO 80113
$-21,915
Cash flow
-20.8%
Cash-on-Cash Return
0.9%
Cap rate
0.2%
Rent to Value Ratio