Englewood, CO Investment Properties for Sale
Browse homes for sale and investment properties in Englewood, CO. Refine your search by price, property type, or more.
Best cash flowing properties in Englewood, CO
Active
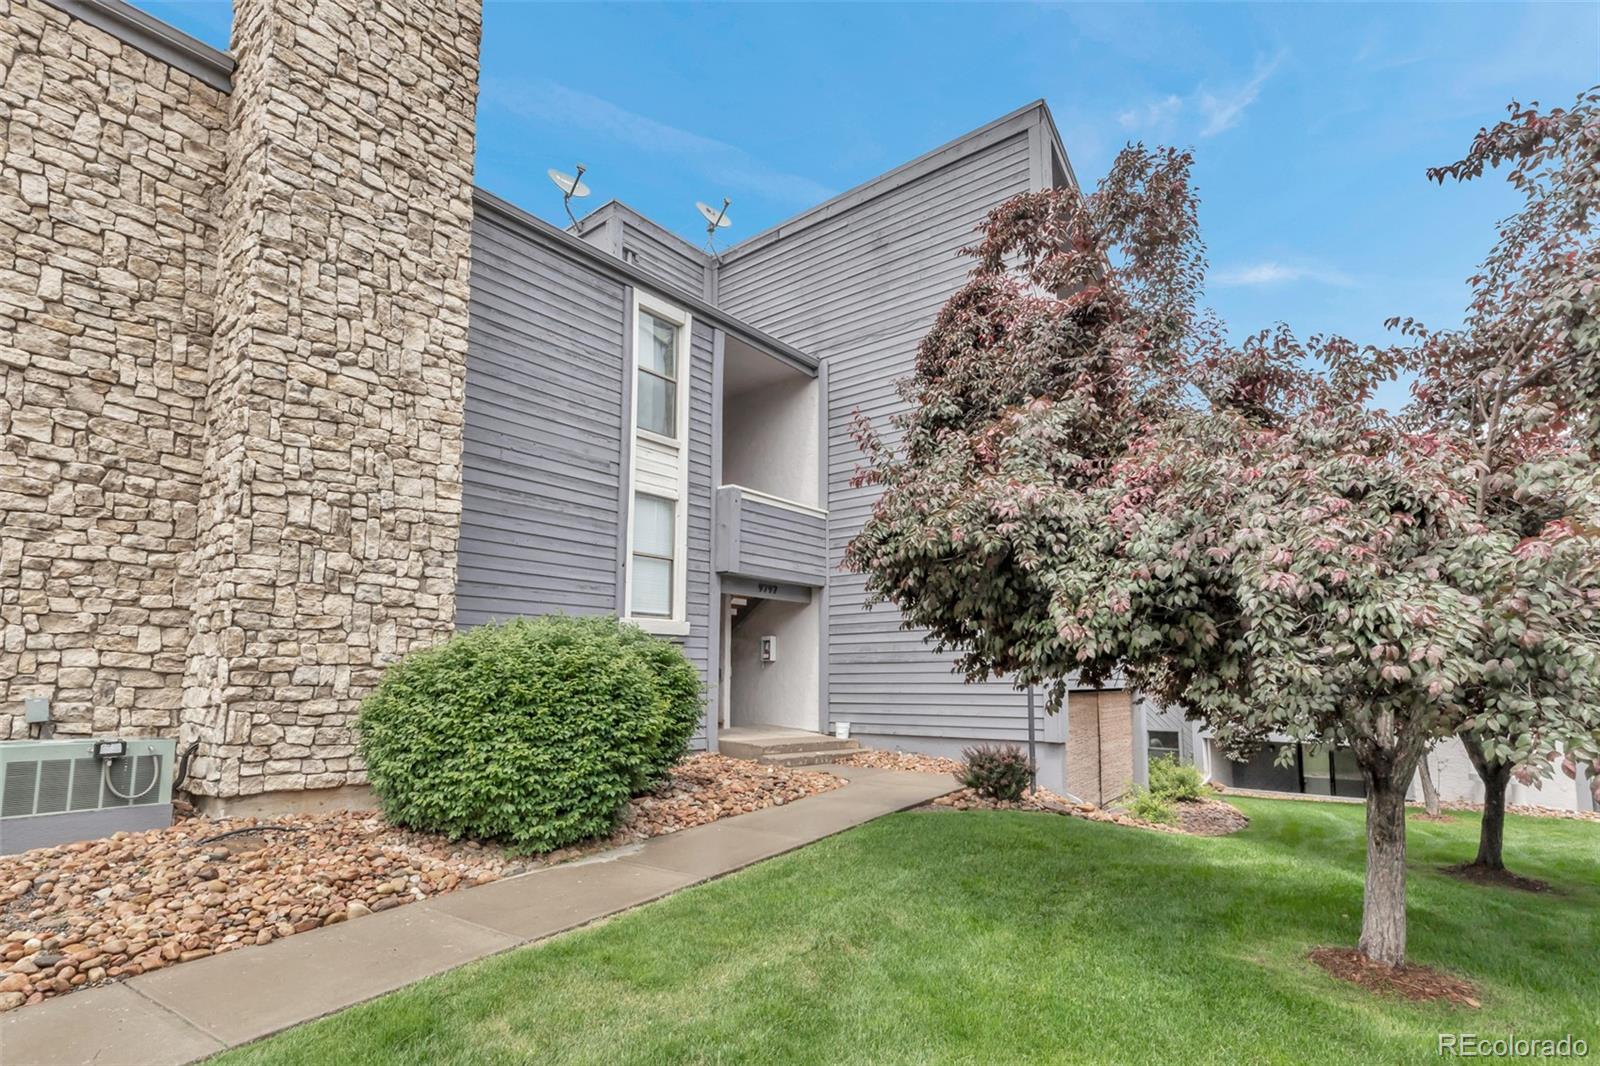
$255,000
1
bds
|
1
ba
|
709
sqft
|
built
1979
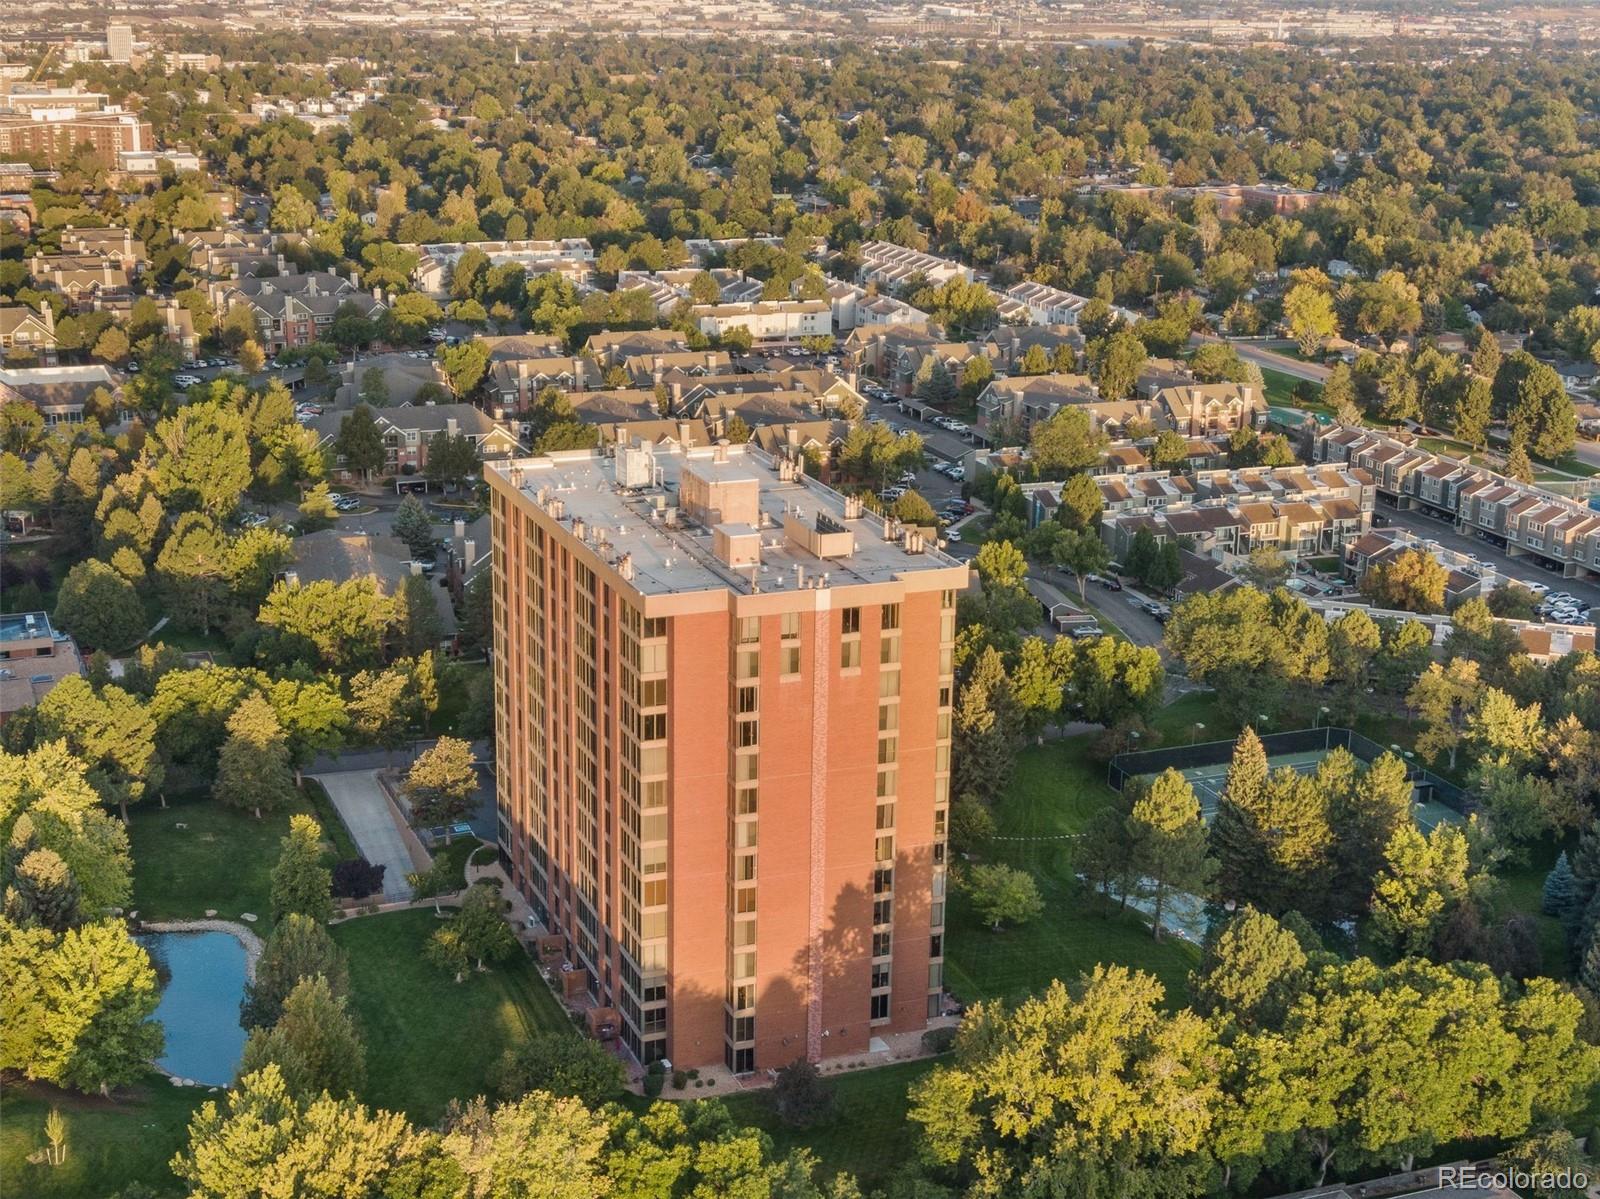
9797 E Peakview Ave, Englewood, CO 80111
$-197
Cash flow
-4.0%
Cash-on-Cash Return
4.8%
Cap rate
0.9%
Rent to Value Ratio
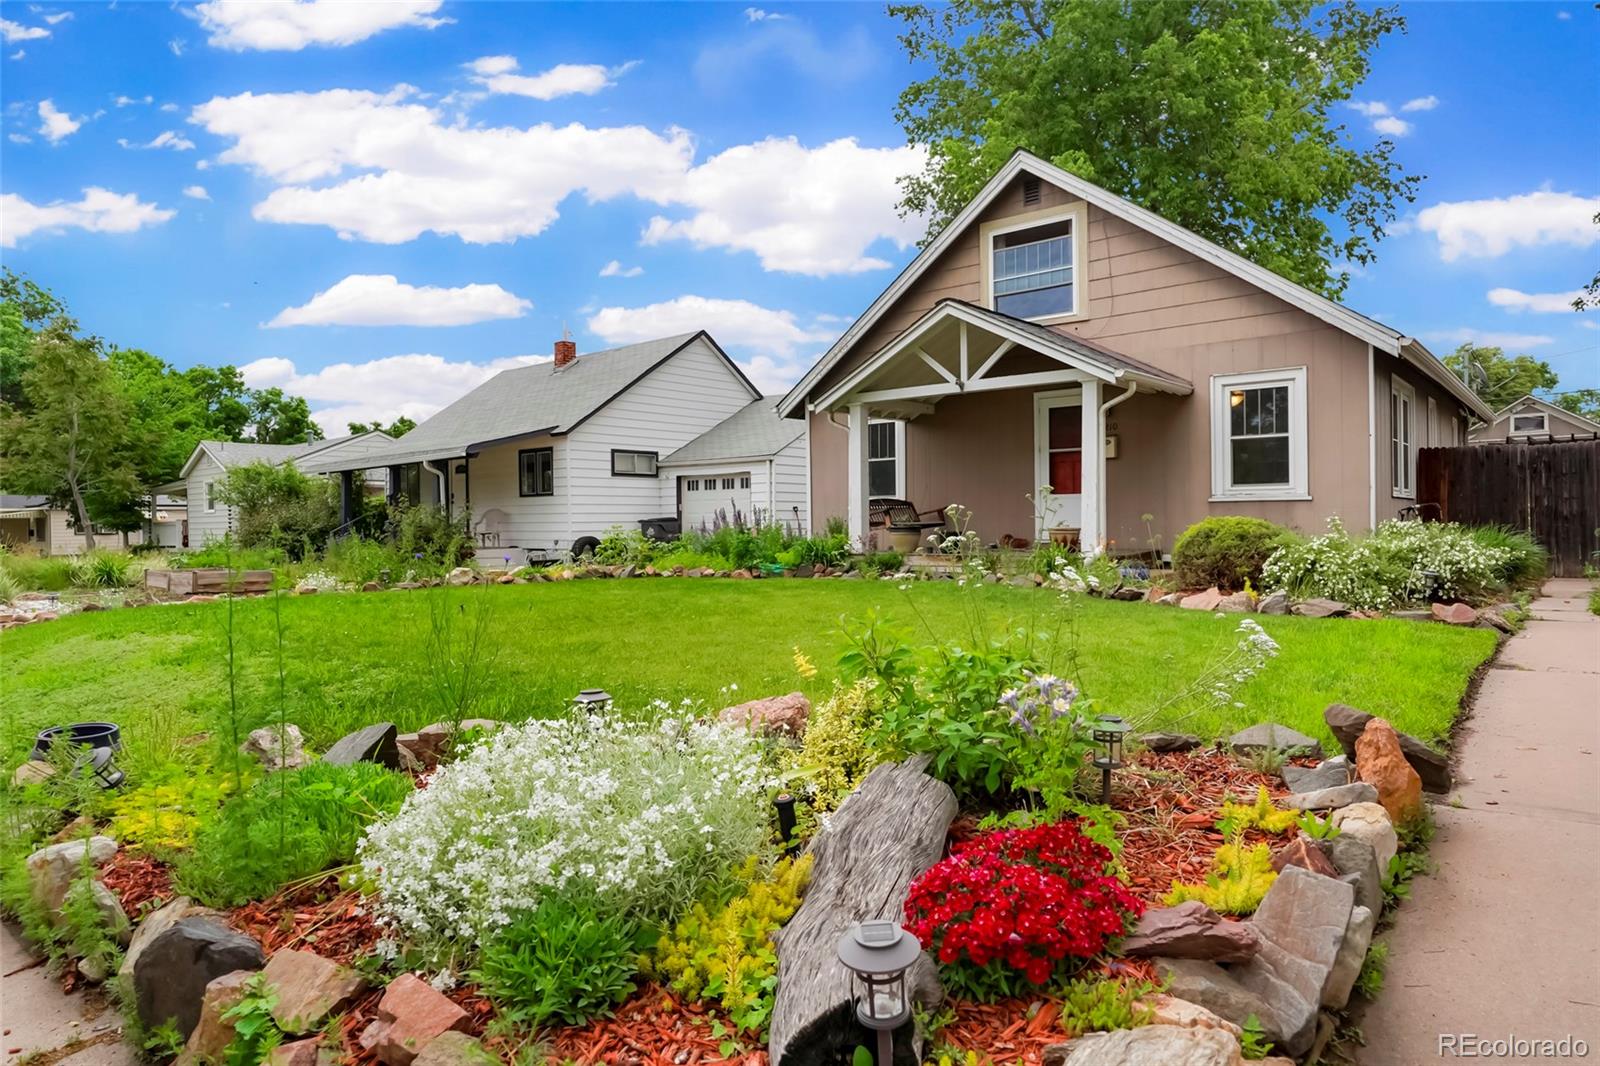
Active under contract
$450,000
3
bds
|
2
ba
|
1,666
sqft
|
built
1921
4210 S Fox St, Englewood, CO 80110
$-210
Cash flow
-2.4%
Cash-on-Cash Return
5.1%
Cap rate
0.7%
Rent to Value Ratio
221 out of 252 properties for sale in Englewood, CO
Limited Results Shown
Create a free account, or log in to reveal all property listings and enjoy the complete experience.
Active under contract
$450,000
3
bds
|
2
ba
|
1,666
sqft
|
built
1921
4210 S Fox St, Englewood, CO 80110
$-210
Cash flow
-2.4%
Cash-on-Cash Return
5.1%
Cap rate
0.7%
Rent to Value Ratio
Active
$825,000
4
bds
|
4
ba
|
3,850
sqft
|
built
1974
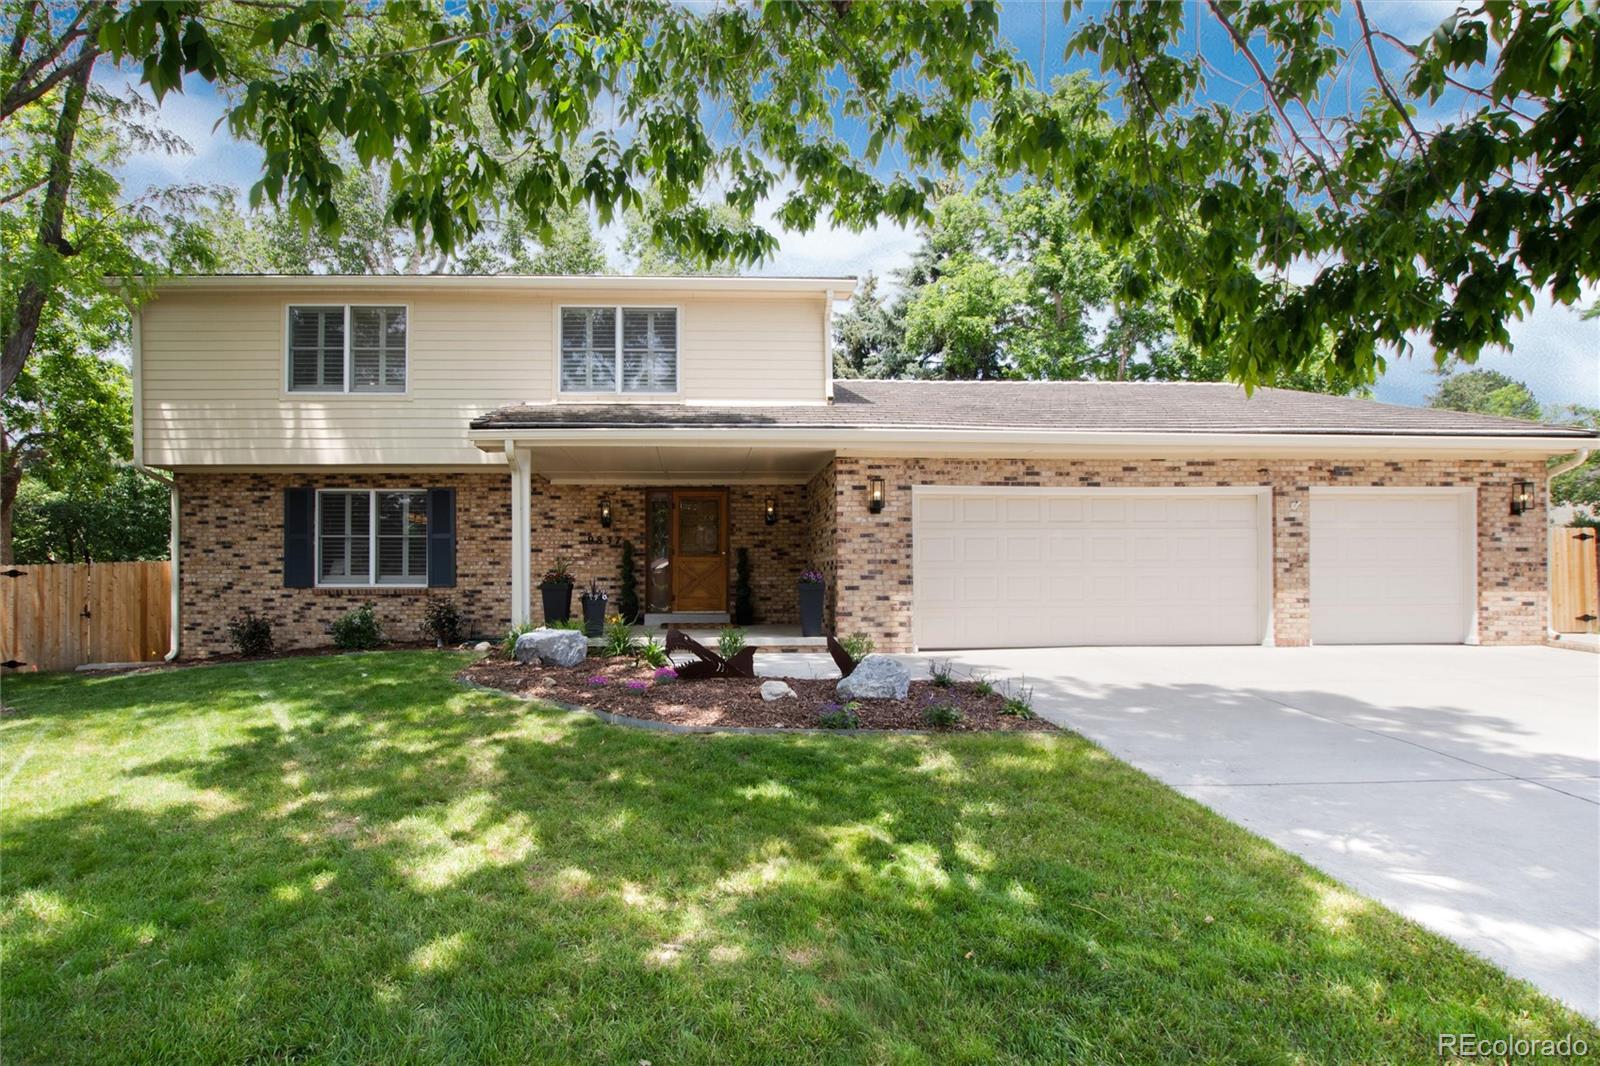
60 E Bates Ave, Englewood, CO 80113
$-3,000
Cash flow
-19.0%
Cash-on-Cash Return
1.3%
Cap rate
0.2%
Rent to Value Ratio
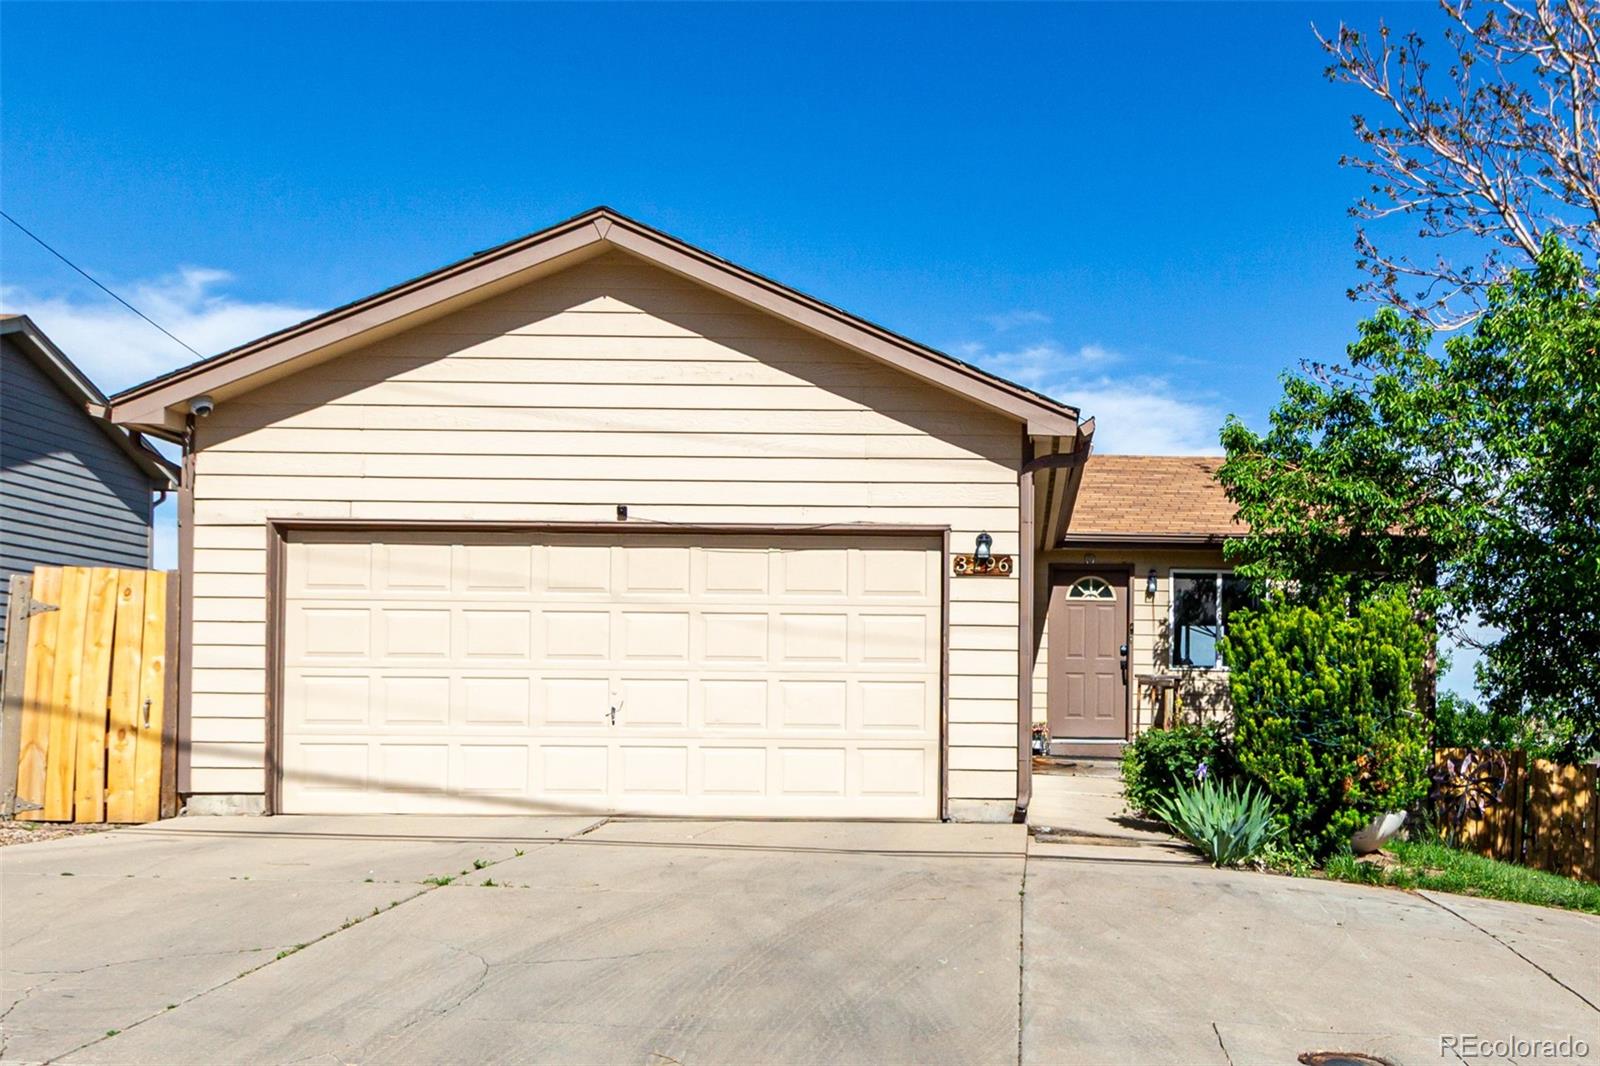
Active
$480,000
4
bds
|
2
ba
|
1,728
sqft
|
built
2000
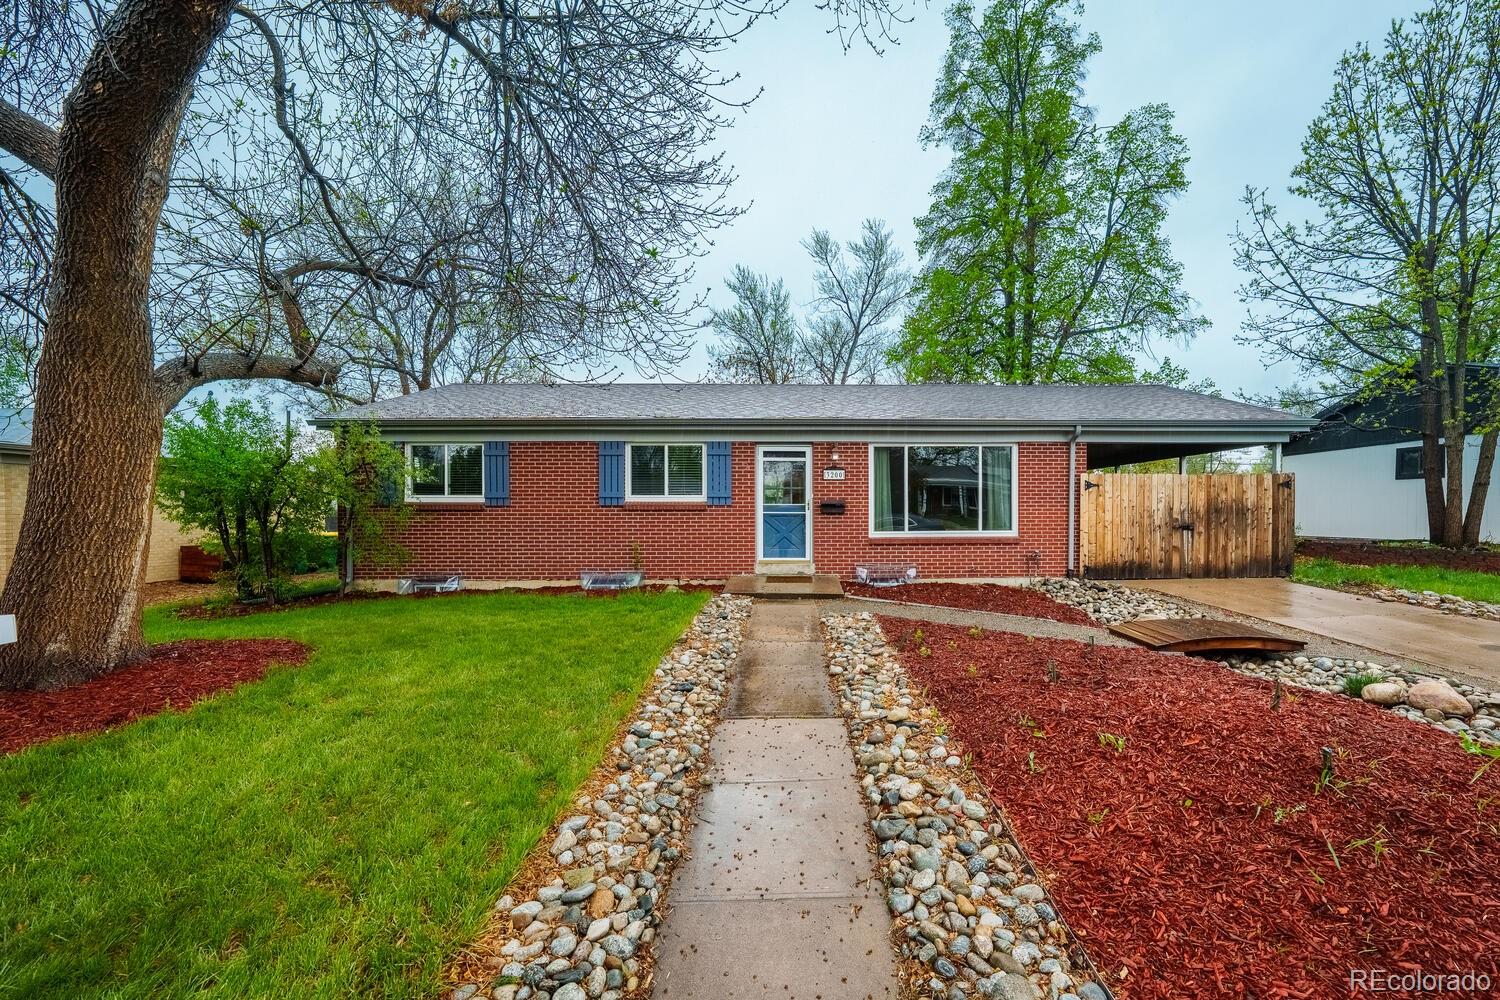
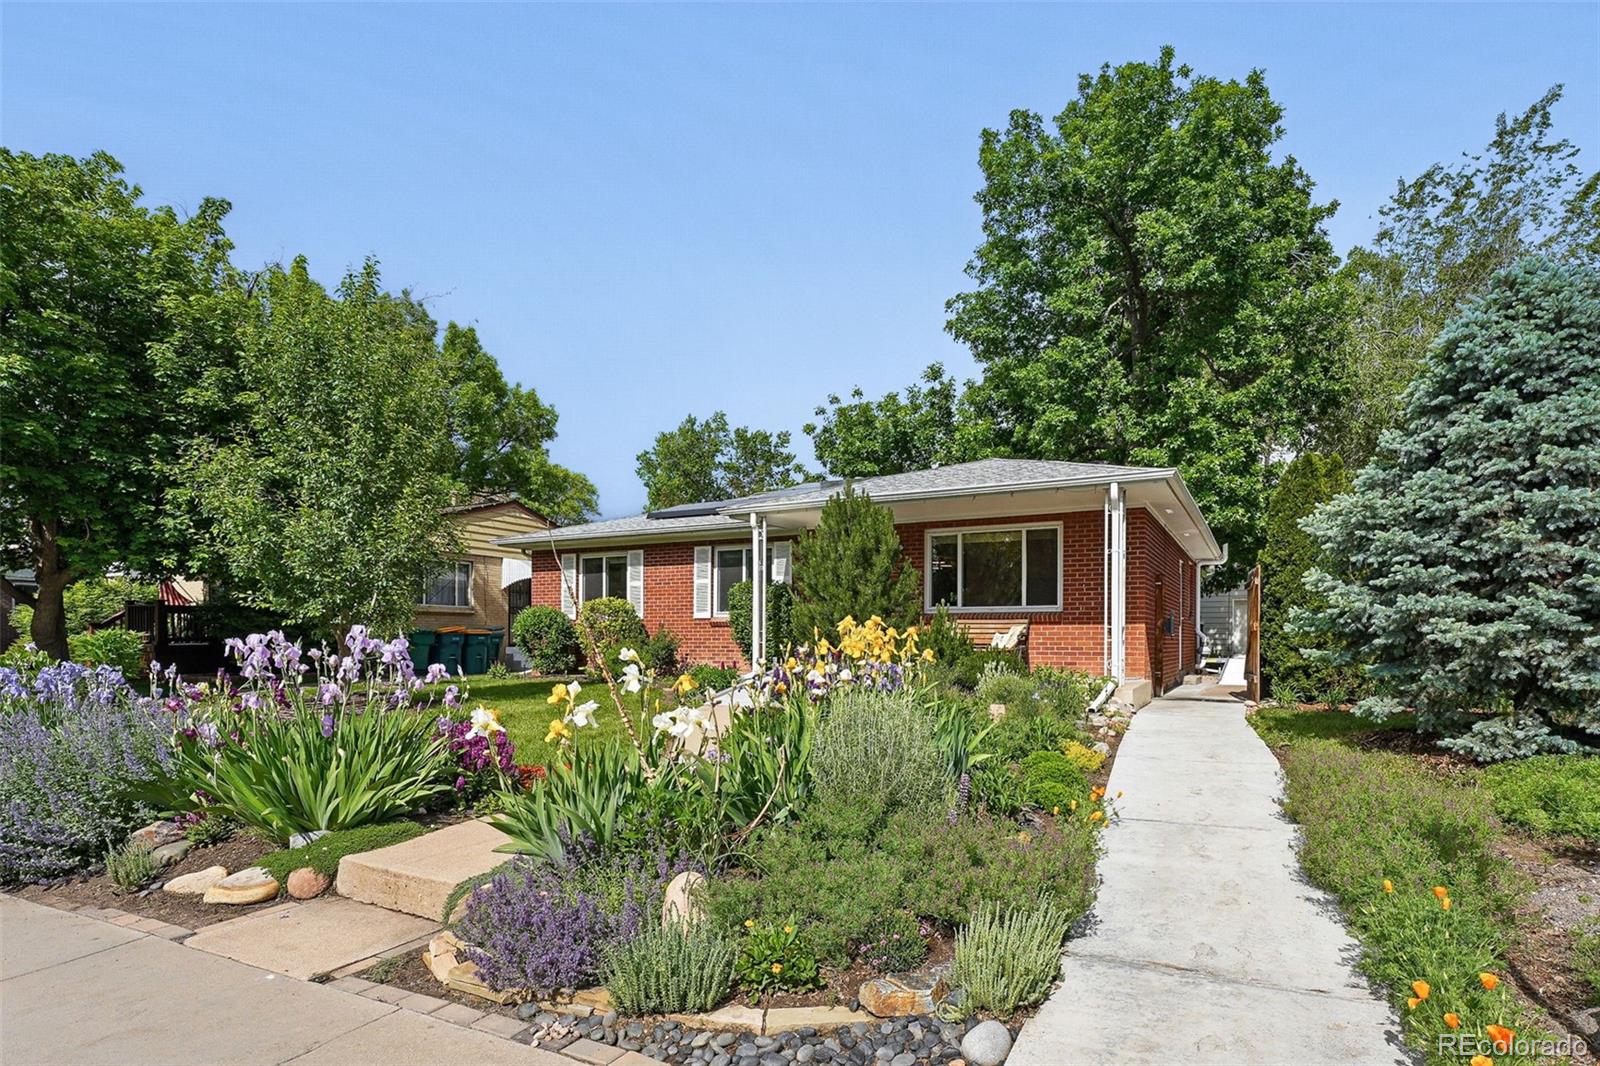
3296 S Bryant St, Englewood, CO 80110
$-804
Cash flow
-8.7%
Cash-on-Cash Return
3.7%
Cap rate
0.5%
Rent to Value Ratio
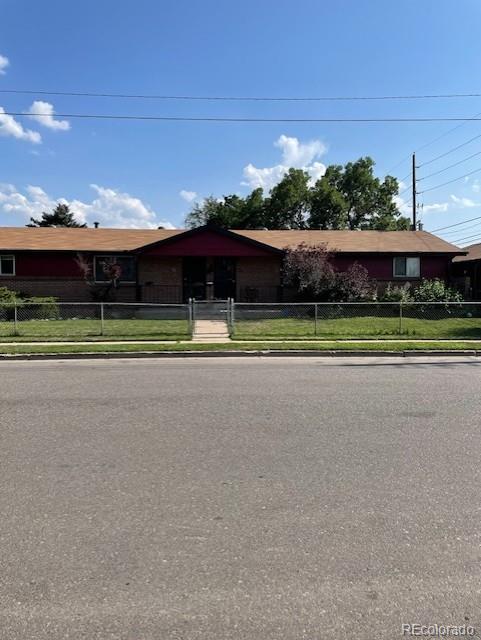
Active
$650,000
3
bds
|
2
ba
|
1,497
sqft
|
built
1954
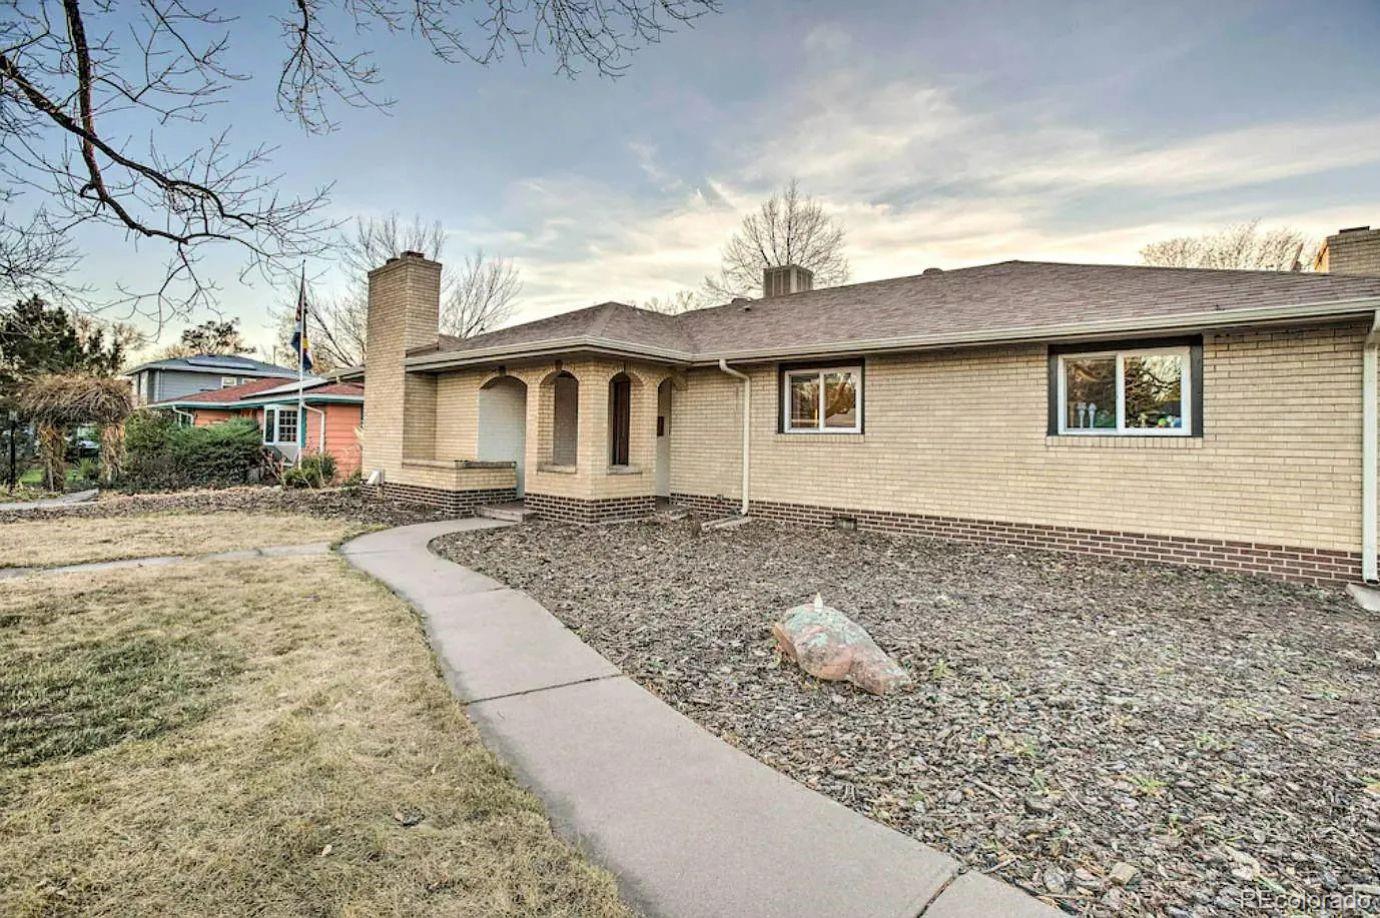
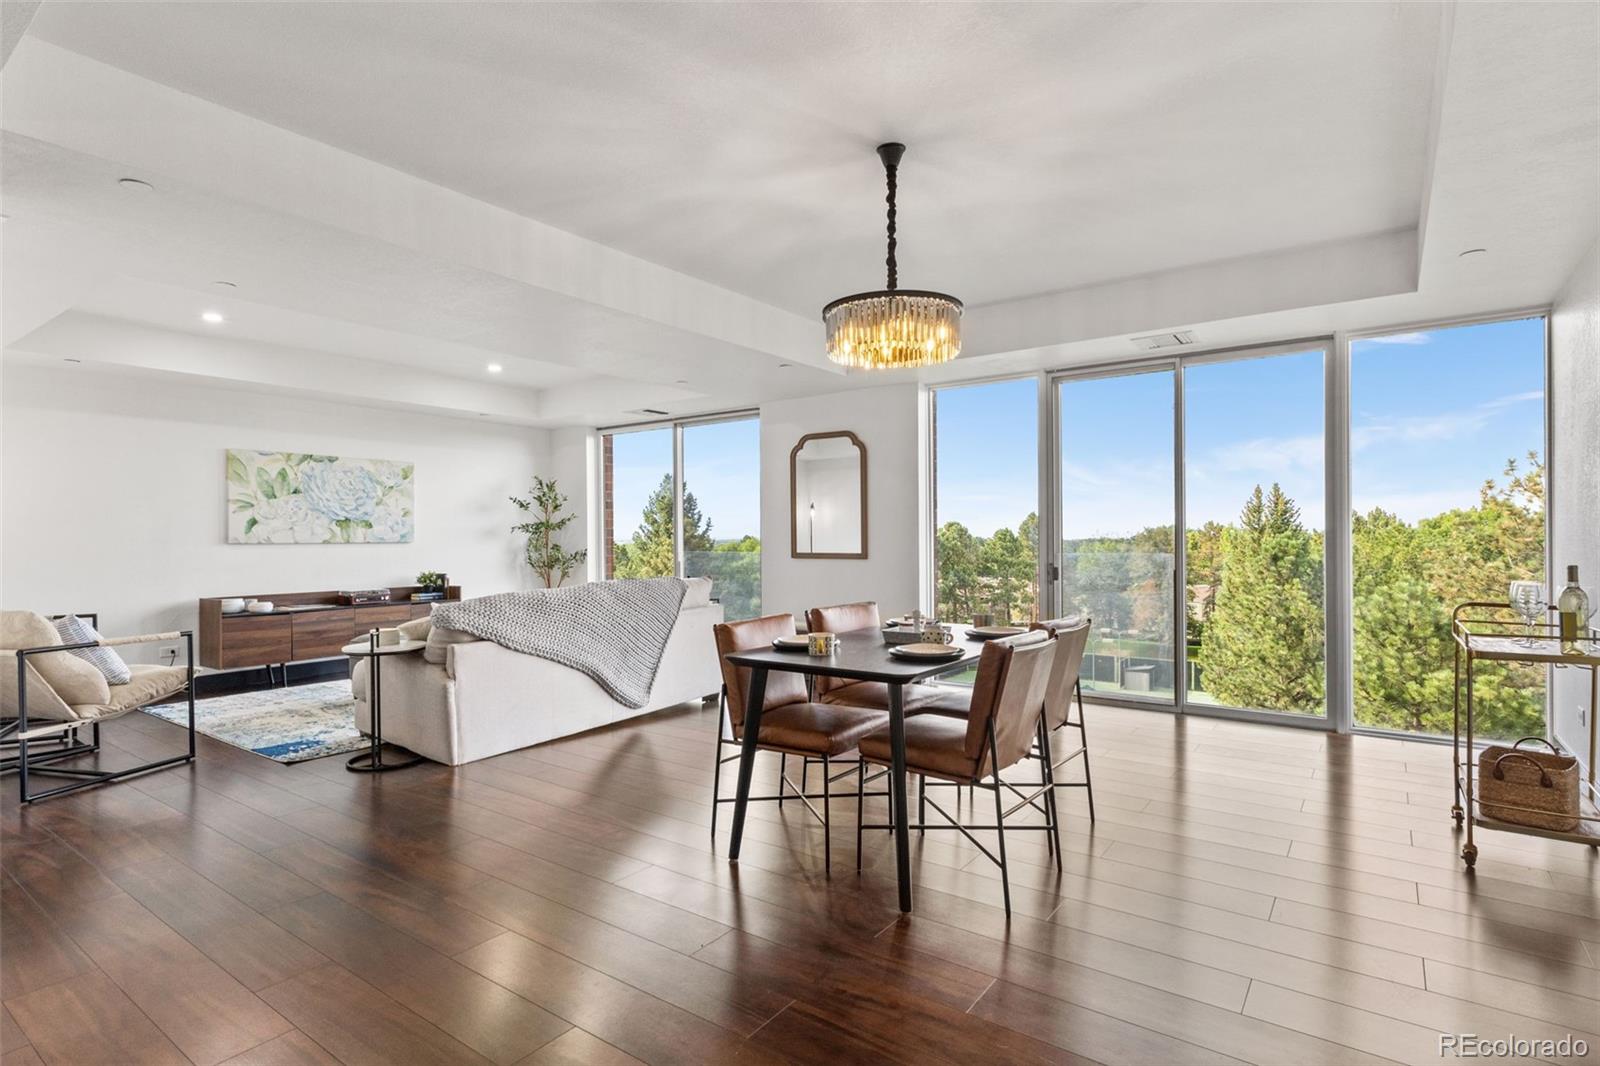
3119 S University Blvd, Englewood, CO 80113
$-1,394
Cash flow
-11.2%
Cash-on-Cash Return
3.1%
Cap rate
0.4%
Rent to Value Ratio

Active
$535,000
2
bds
|
2
ba
|
1,153
sqft
|
built
2008
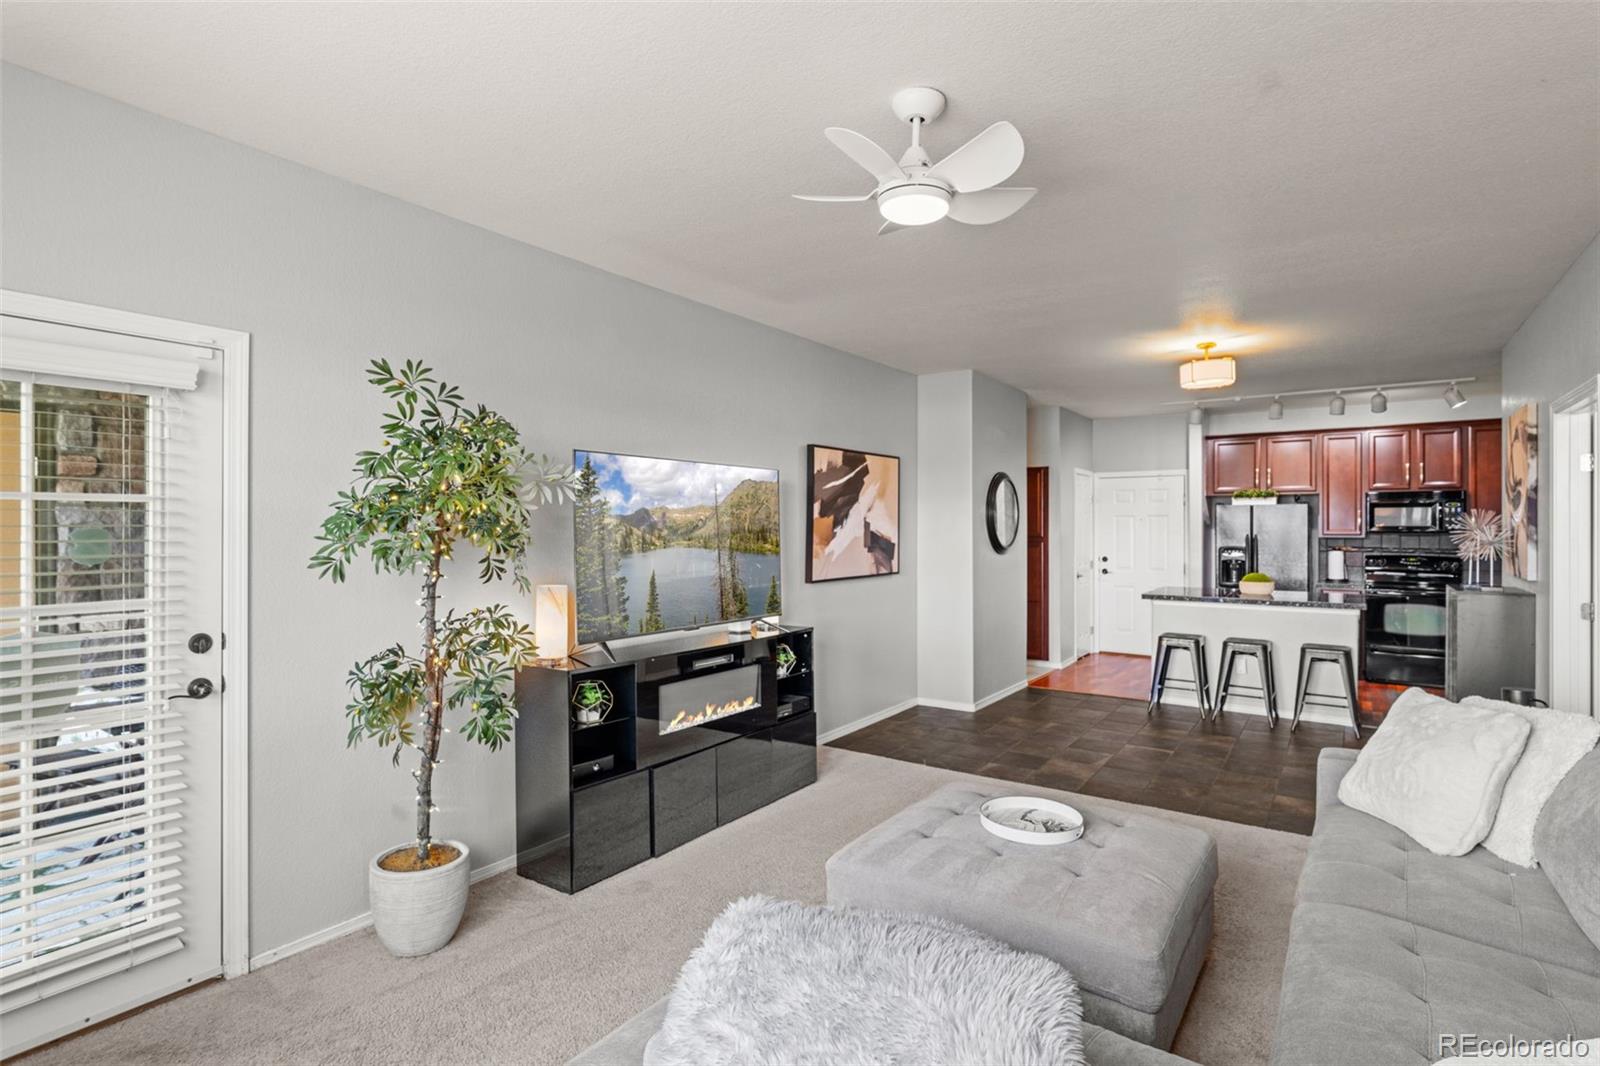
7865 Vallagio Ln, Englewood, CO 80112
$-1,499
Cash flow
-14.6%
Cash-on-Cash Return
2.3%
Cap rate
0.5%
Rent to Value Ratio
Active
$2,875,000
4
bds
|
5
ba
|
4,224
sqft
|
built
1960
3925 S Cherry St, Englewood, CO 80113
$-11,238
Cash flow
-20.4%
Cash-on-Cash Return
1.0%
Cap rate
0.2%
Rent to Value Ratio
Active
$850,000
2
bds
|
4
ba
|
2,576
sqft
|
built
1971
3436 S Race St, Englewood, CO 80113
$-2,954
Cash flow
-18.1%
Cash-on-Cash Return
1.5%
Cap rate
0.4%
Rent to Value Ratio
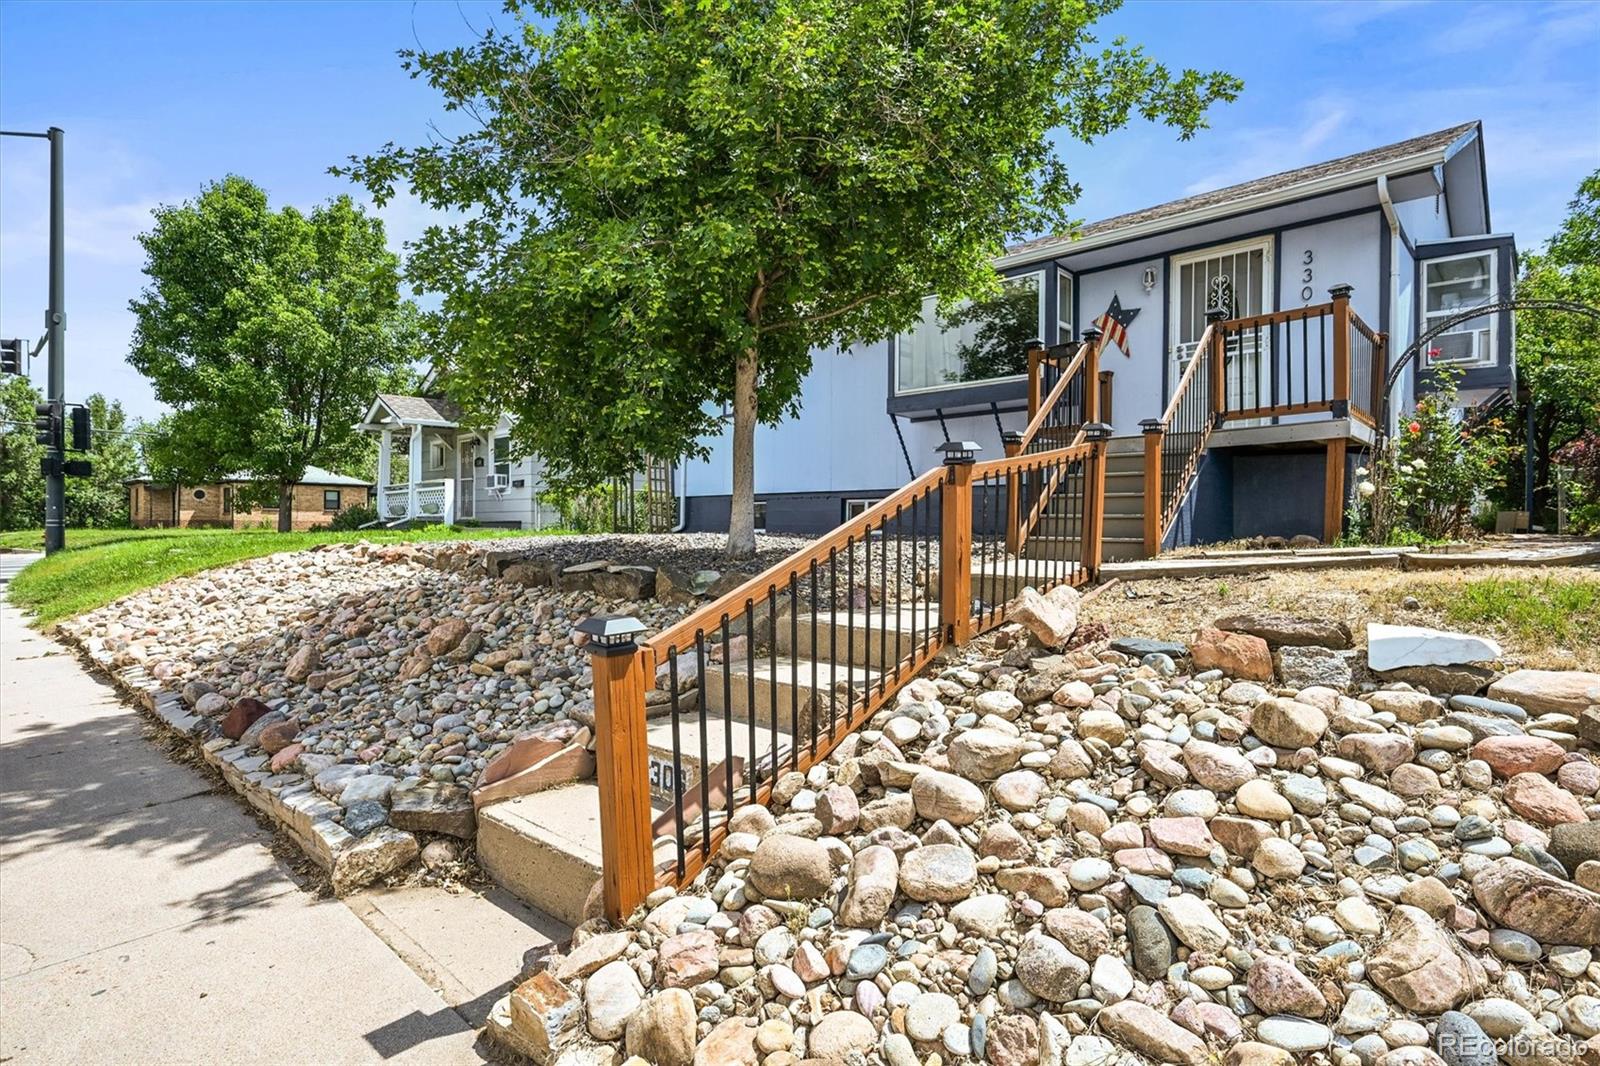
Active
$665,000
3
bds
|
2
ba
|
1,521
sqft
|
built
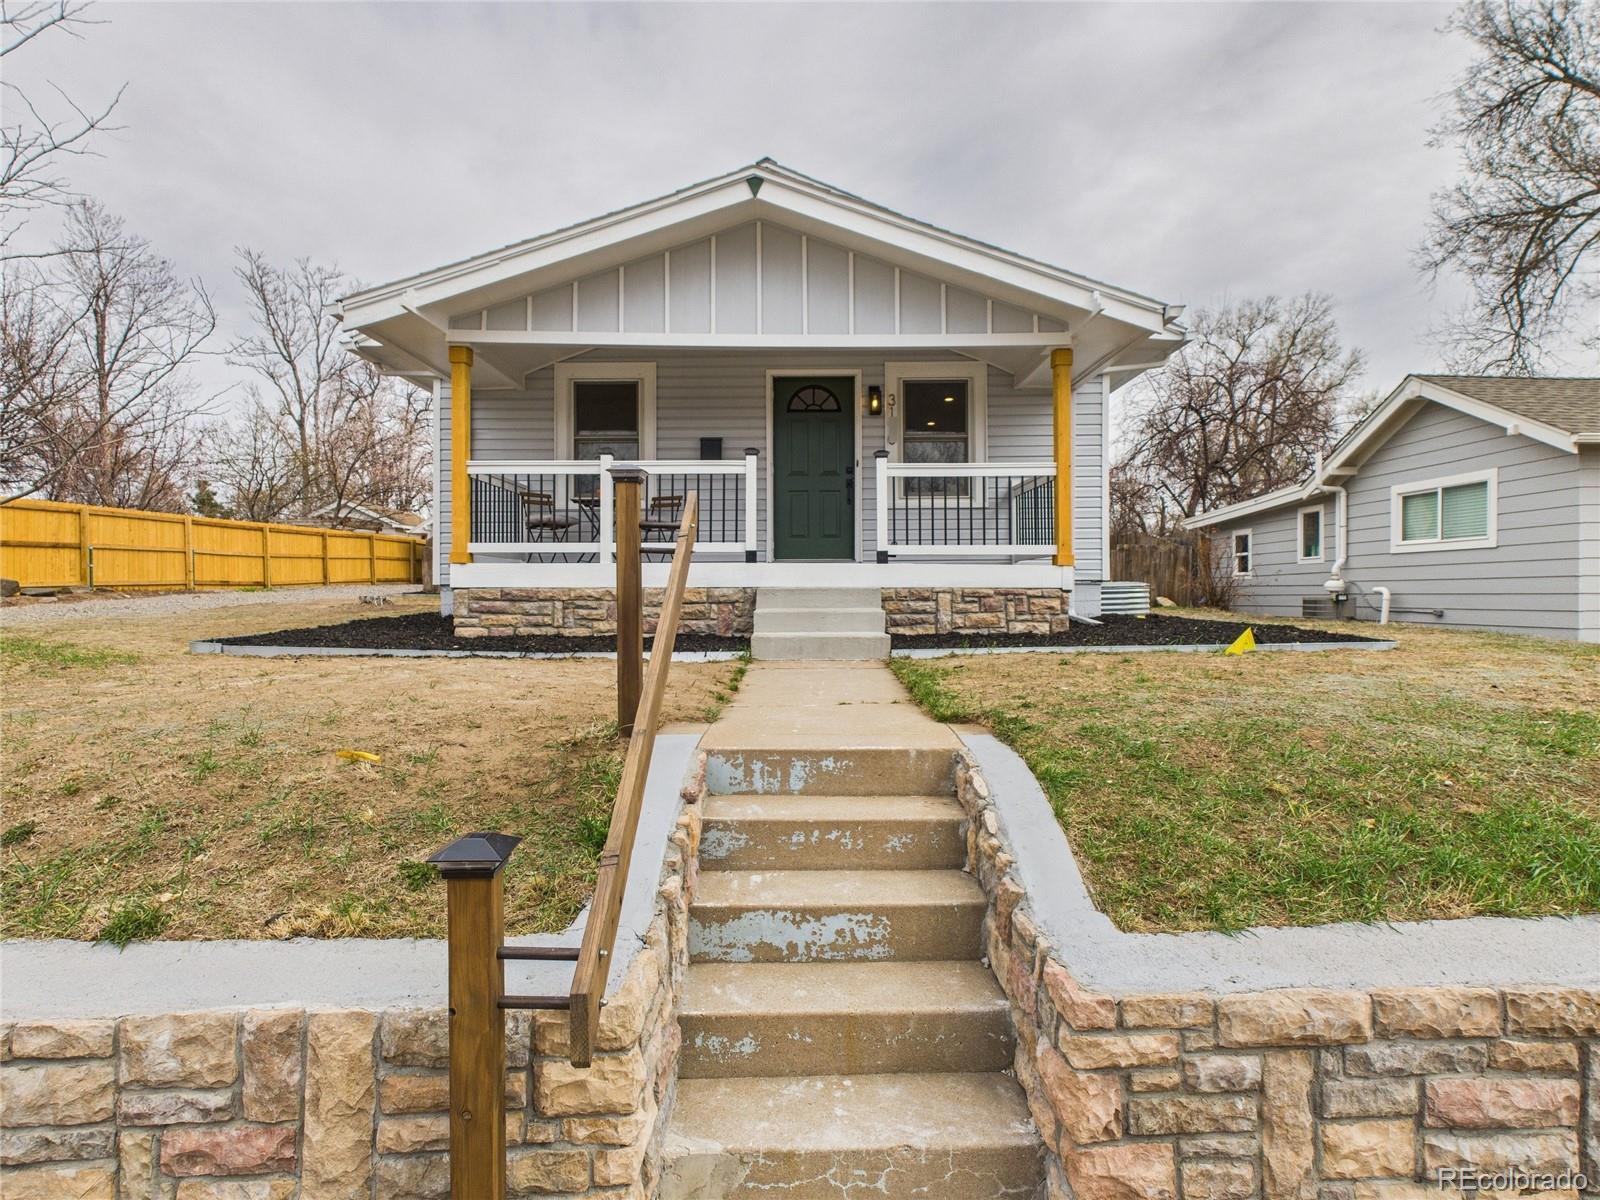
1931
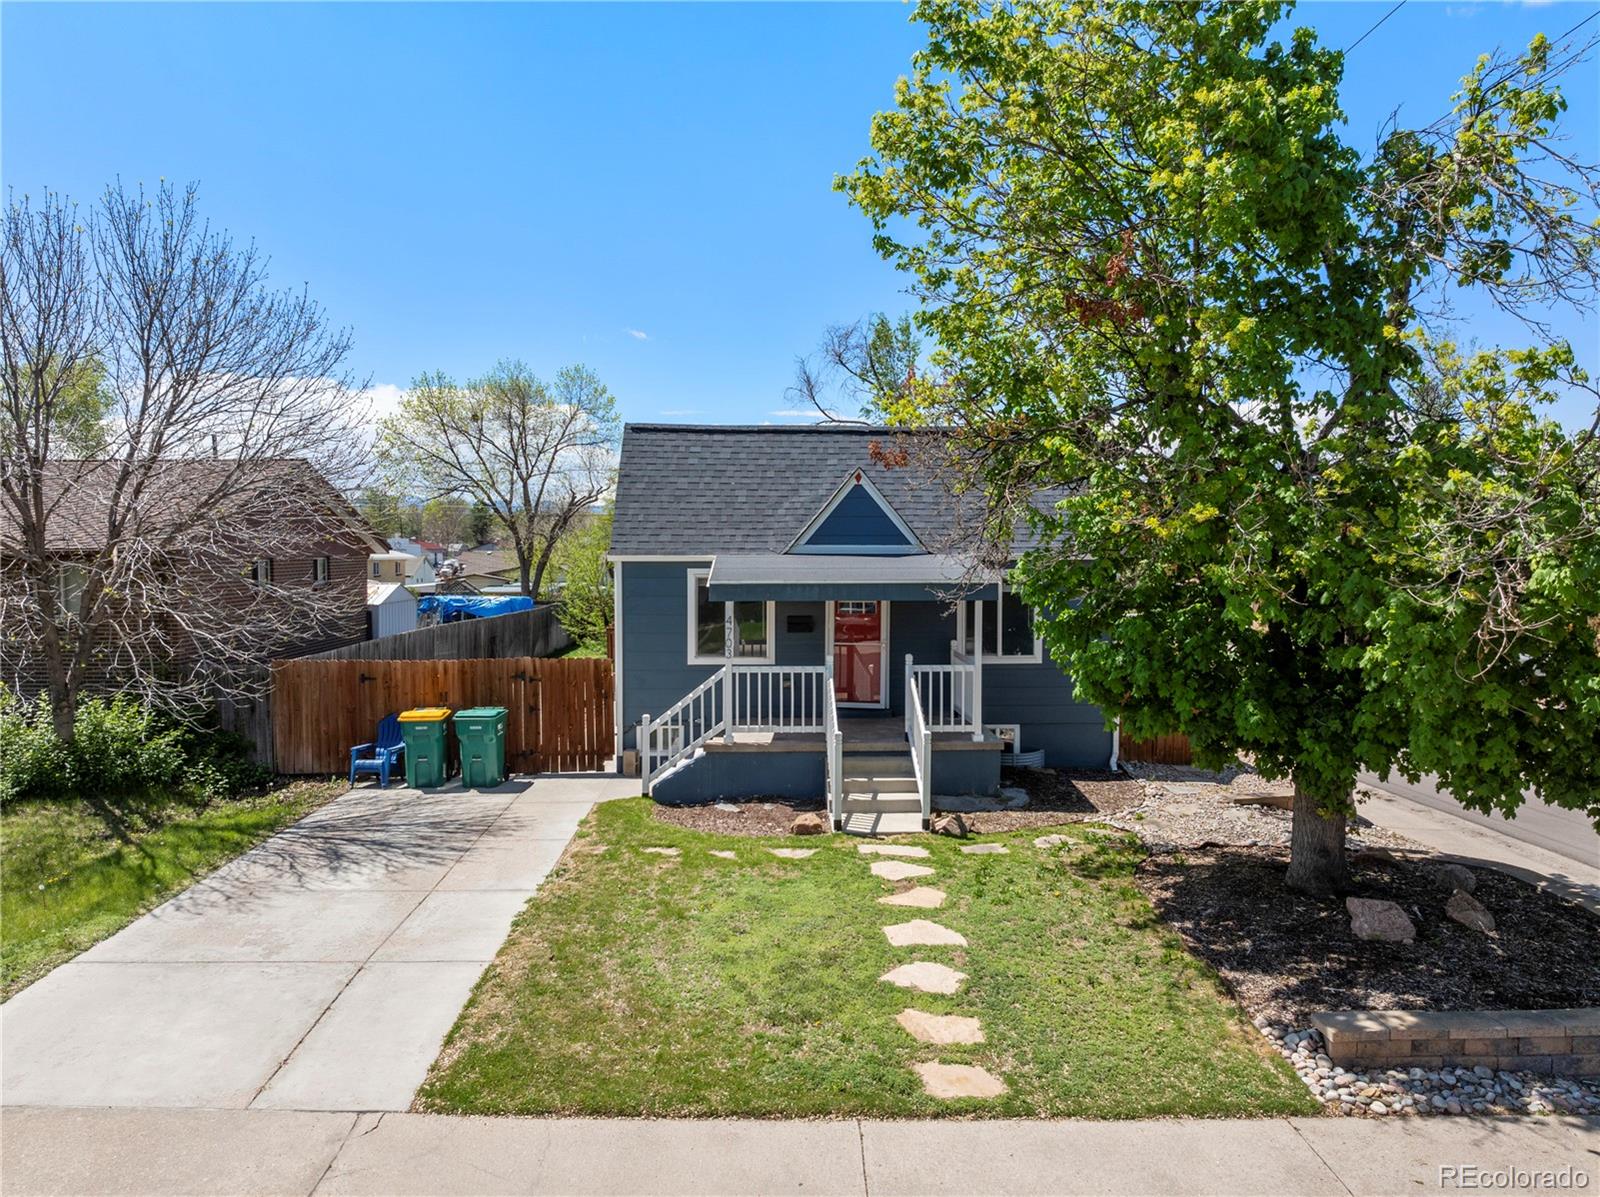
4703 S Sherman St, Englewood, CO 80113
$-1,451
Cash flow
-11.4%
Cash-on-Cash Return
3.1%
Cap rate
0.4%
Rent to Value Ratio

Active
$2,185,000
4
bds
|
6
ba
|
2,170
sqft
|
built
1959
3975 S Cherry St, Englewood, CO 80113
$-6,791
Cash flow
-16.2%
Cash-on-Cash Return
1.9%
Cap rate
0.3%
Rent to Value Ratio
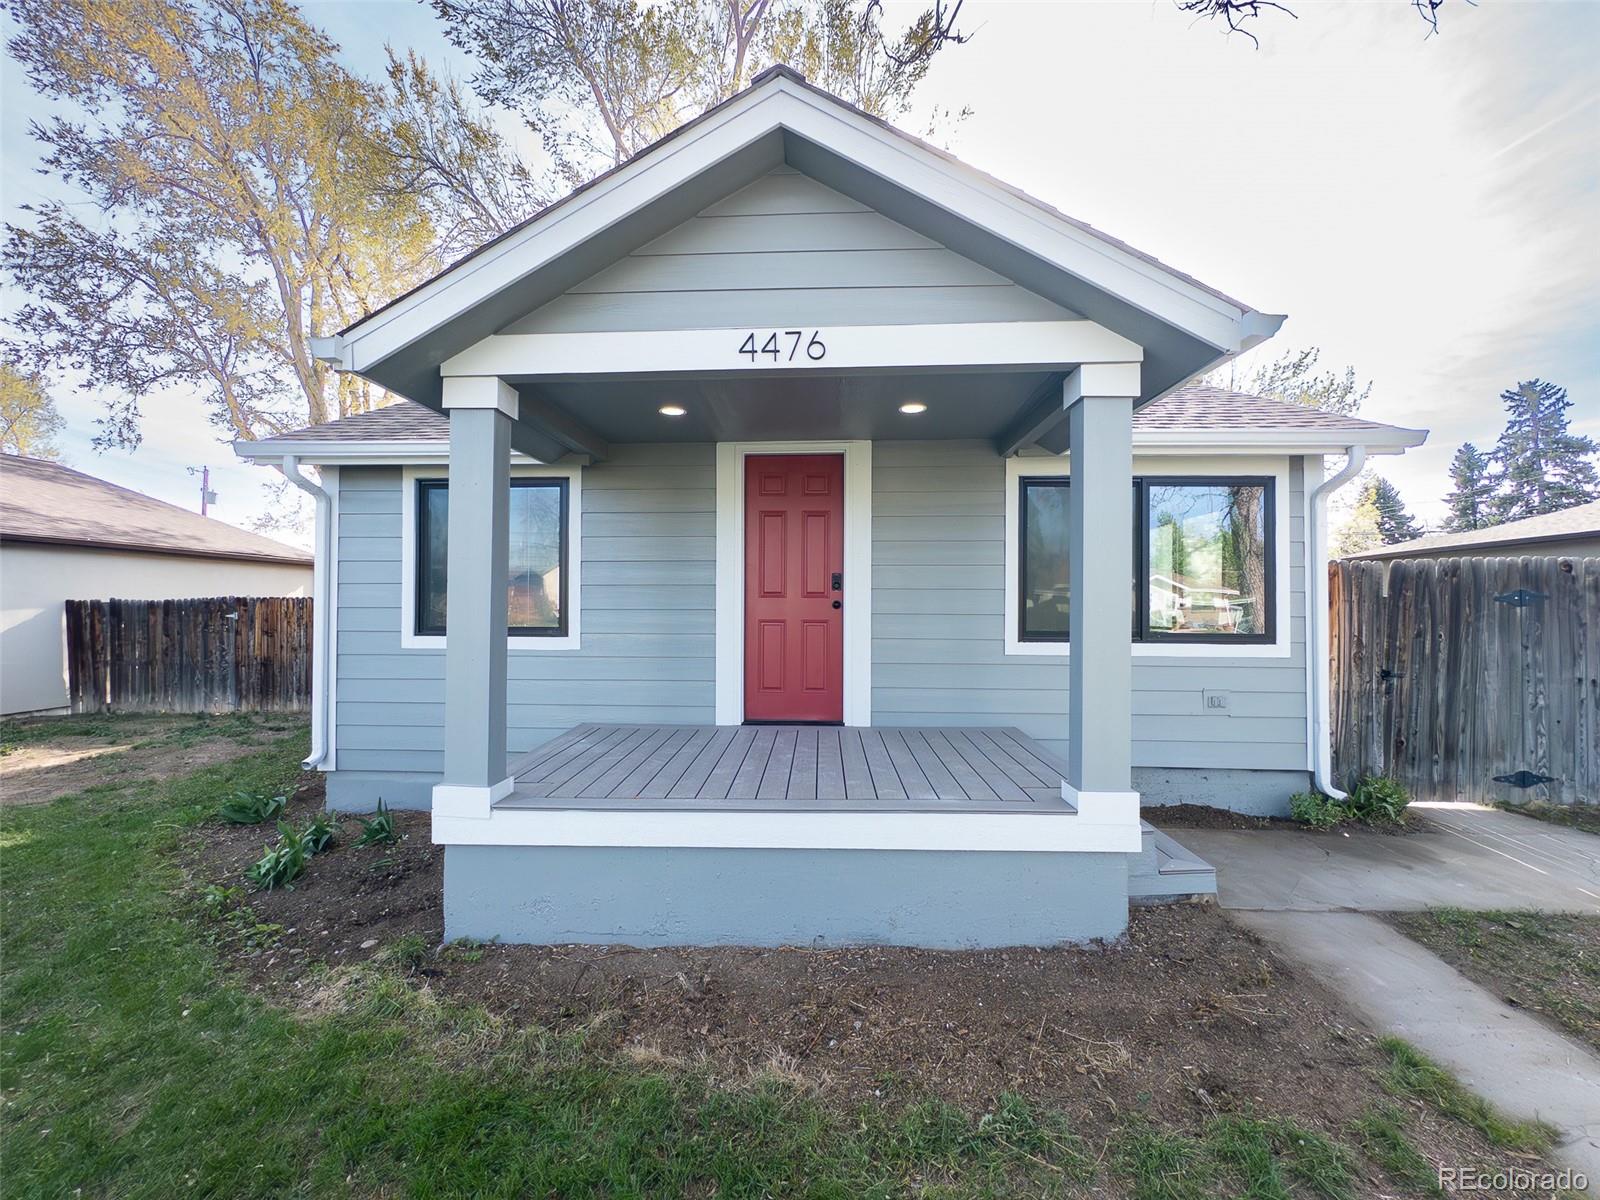
Active
$535,000
3
bds
|
2
ba
|
780
sqft
|
built
1906
4476 S Grant St, Englewood, CO 80113
$-1,536
Cash flow
-15.0%
Cash-on-Cash Return
2.2%
Cap rate
0.3%
Rent to Value Ratio
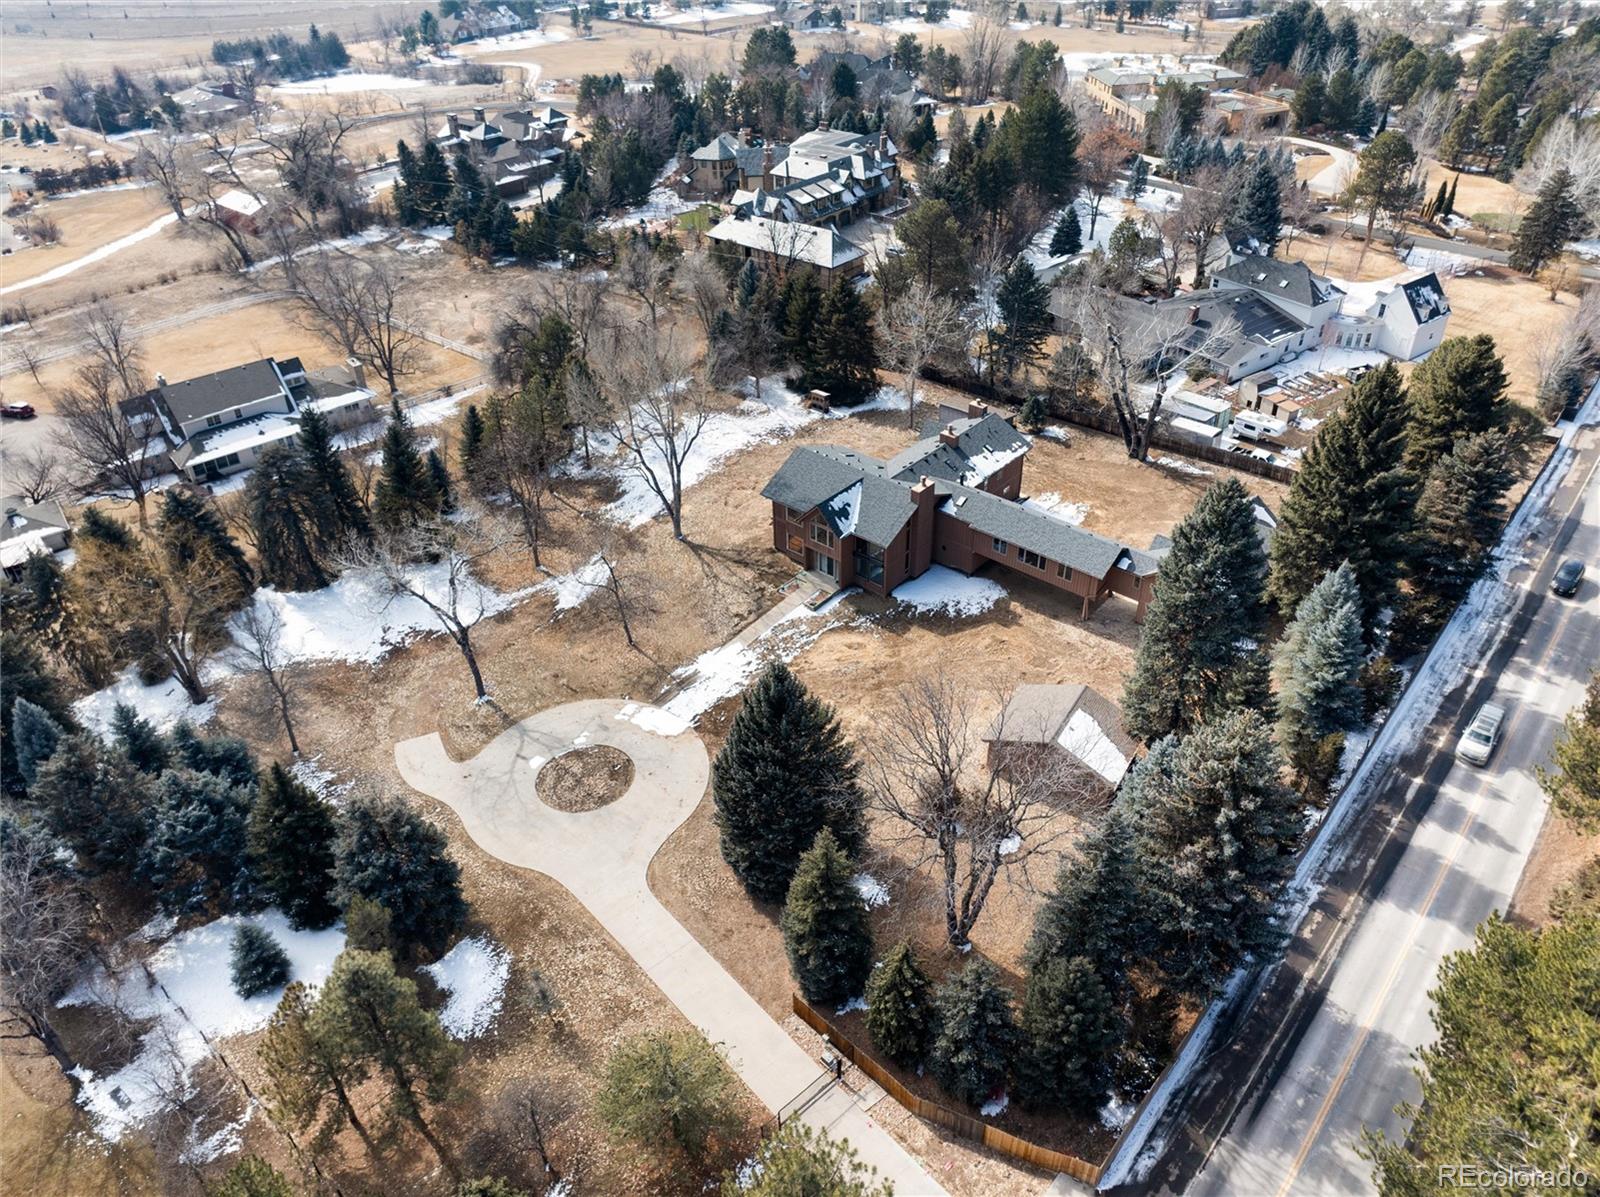
Active
$3,400,000
4
bds
|
0
ba
|
7,262
sqft
|
built
1978
3720 E Quincy Ave, Englewood, CO 80113
$-11,770
Cash flow
-18.1%
Cash-on-Cash Return
1.5%
Cap rate
0.2%
Rent to Value Ratio
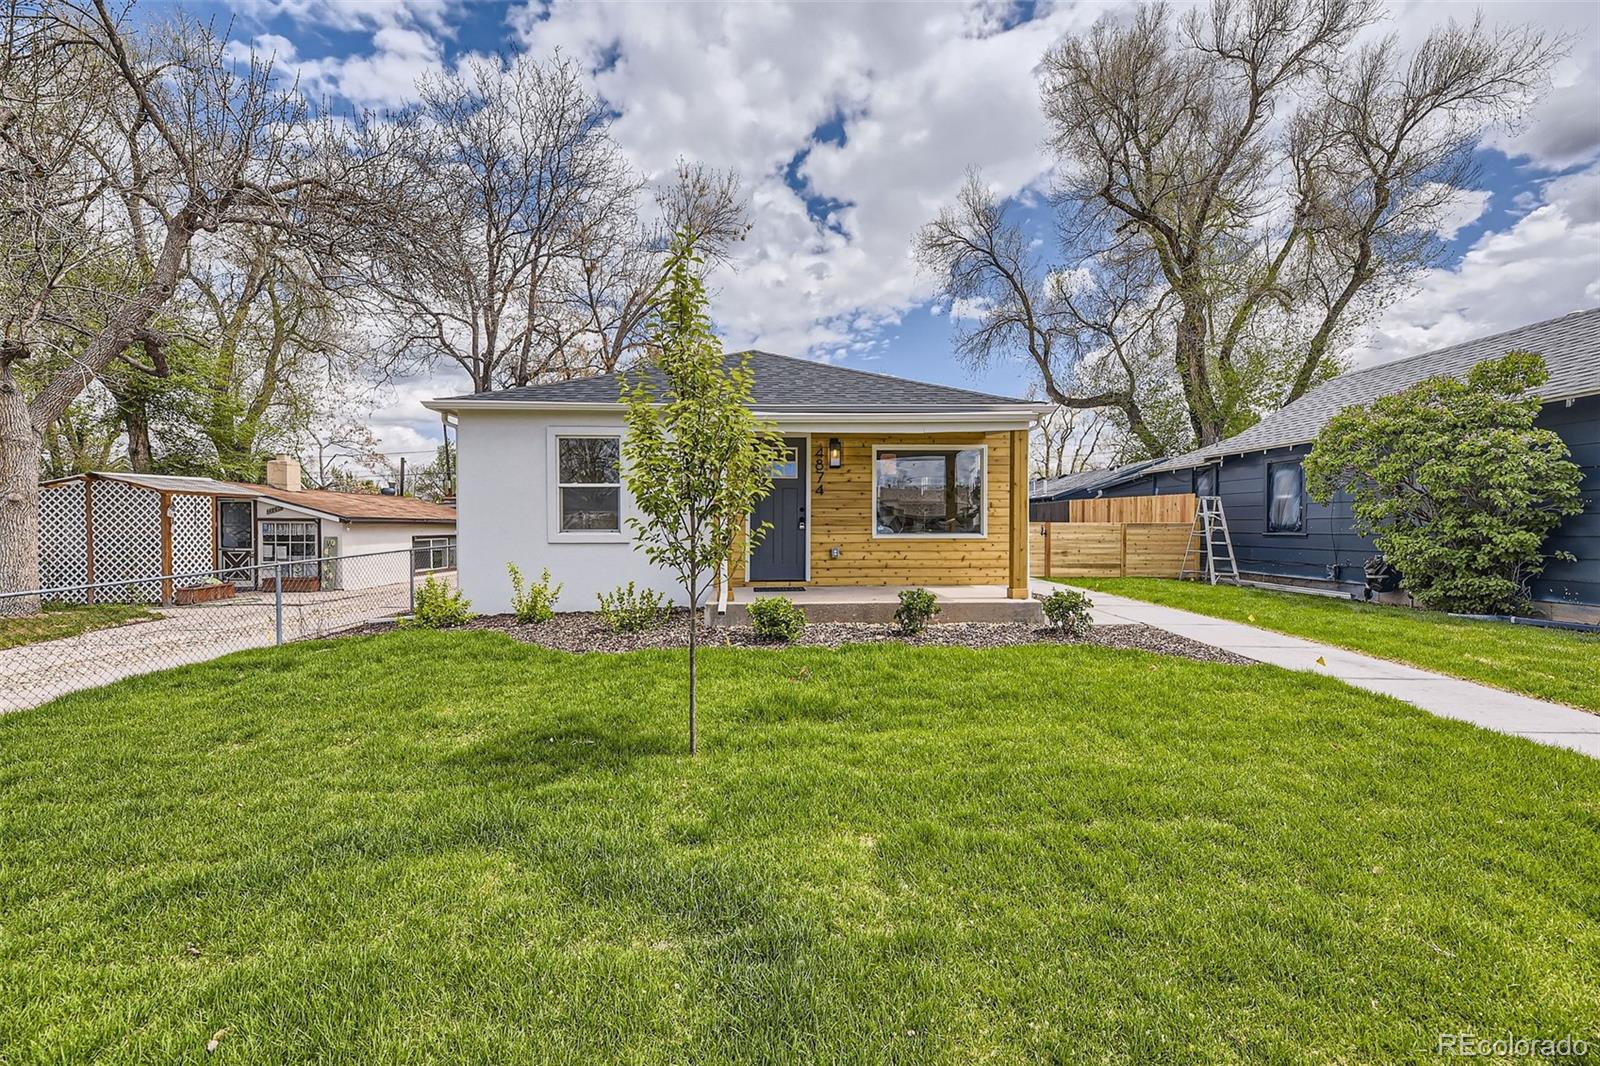
Active
$518,500
2
bds
|
1
ba
|
832
sqft
|
built
1956
4874 S Lincoln St, Englewood, CO 80113
$-1,108
Cash flow
-11.1%
Cash-on-Cash Return
3.1%
Cap rate
0.4%
Rent to Value Ratio
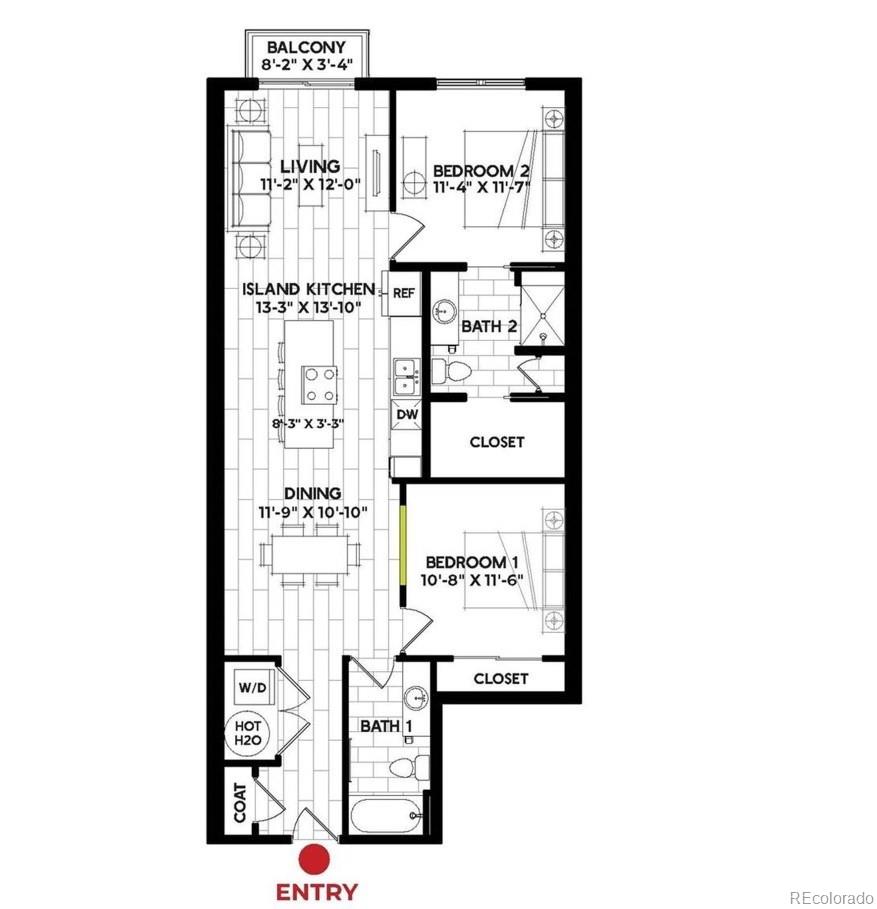
Active
$484,900
2
bds
|
2
ba
|
1,120
sqft
|
built
2020
3500 S Corona St, Englewood, CO 80113
$-1,033
Cash flow
-11.1%
Cash-on-Cash Return
3.1%
Cap rate
0.6%
Rent to Value Ratio
Active
$239,800
1
bds
|
1
ba
|
648
sqft
|
built
1984
4691 S Decatur St, Englewood, CO 80110
$-328
Cash flow
-7.1%
Cash-on-Cash Return
4.0%
Cap rate
0.7%
Rent to Value Ratio
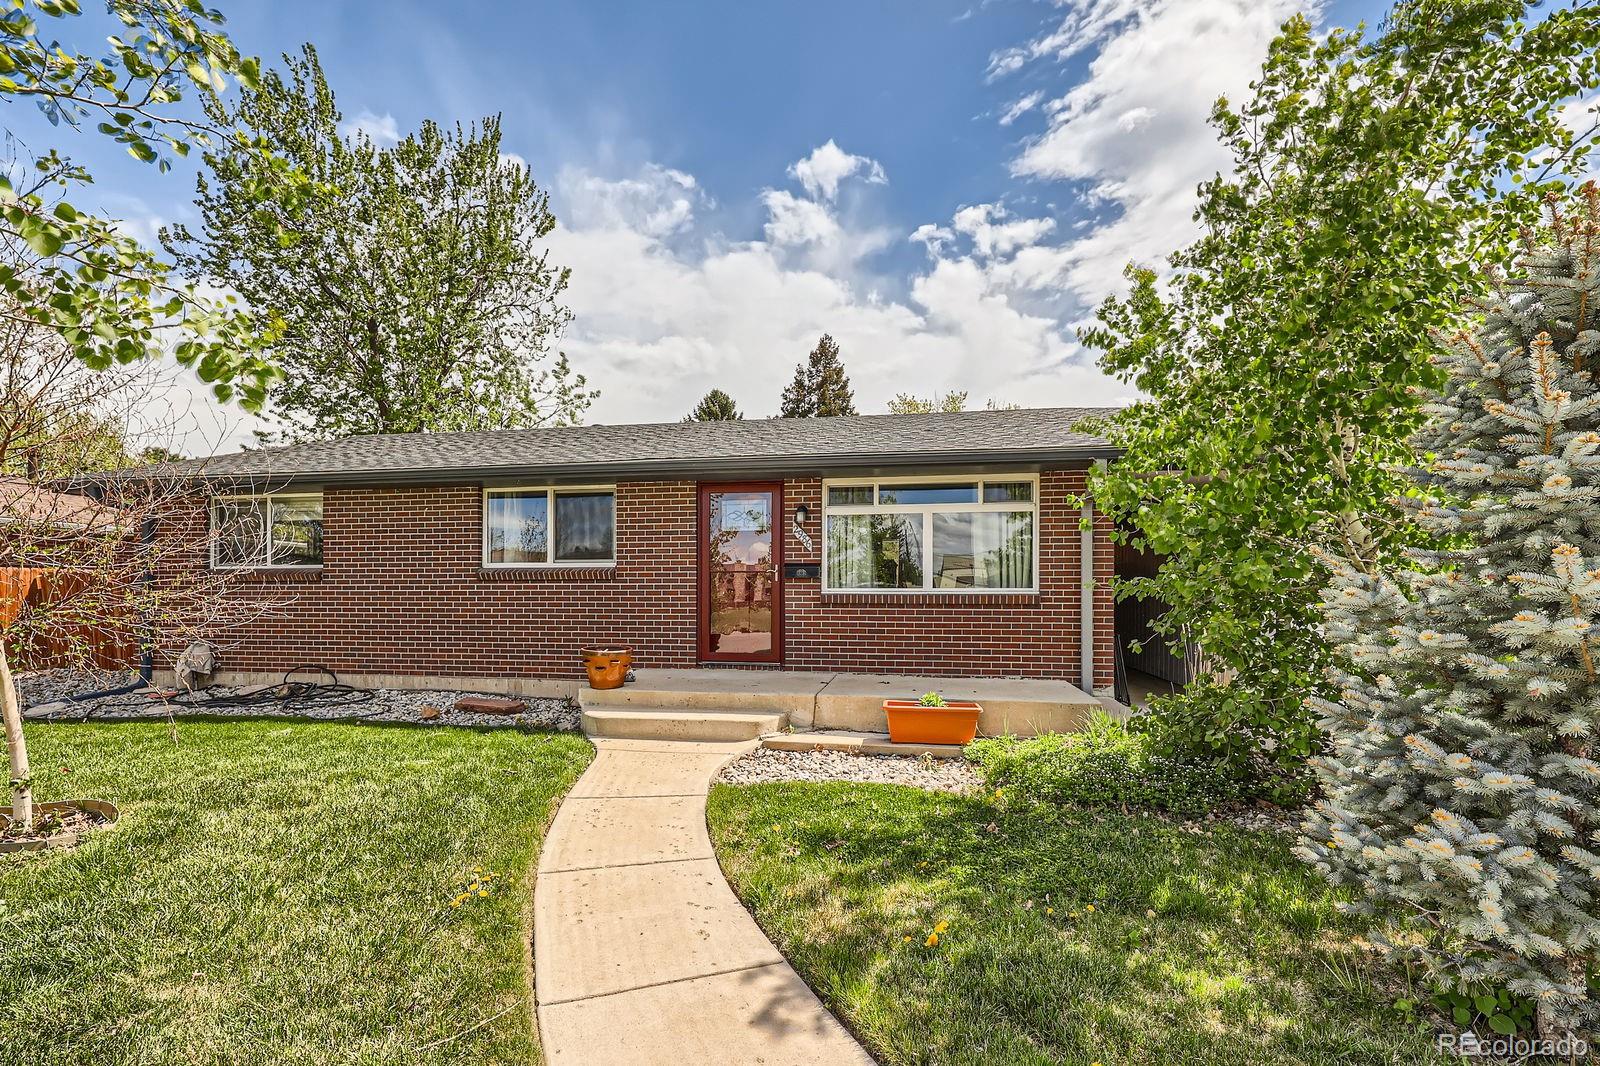
Active
$635,000
4
bds
|
2
ba
|
1,488
sqft
|
built
1955
3179 S University Blvd, Englewood, CO 80113
$-1,275
Cash flow
-10.5%
Cash-on-Cash Return
3.3%
Cap rate
0.5%
Rent to Value Ratio

Active
$937,500
3
bds
|
2
ba
|
1,740
sqft
|
built
1964
1420 E Bates Ave, Englewood, CO 80113
$-2,624
Cash flow
-14.6%
Cash-on-Cash Return
2.3%
Cap rate
0.3%
Rent to Value Ratio
Active
$3,950,000
7
bds
|
11
ba
|
10,400
sqft
|
built
1999
4 Redhawk Run, Englewood, CO 80113
$-16,579
Cash flow
-21.9%
Cash-on-Cash Return
0.6%
Cap rate
0.2%
Rent to Value Ratio
Active
$599,000
4
bds
|
2
ba
|
1,948
sqft
|
built
1961
4585 S Elati St, Englewood, CO 80110
$-849
Cash flow
-7.4%
Cash-on-Cash Return
4.0%
Cap rate
0.5%
Rent to Value Ratio
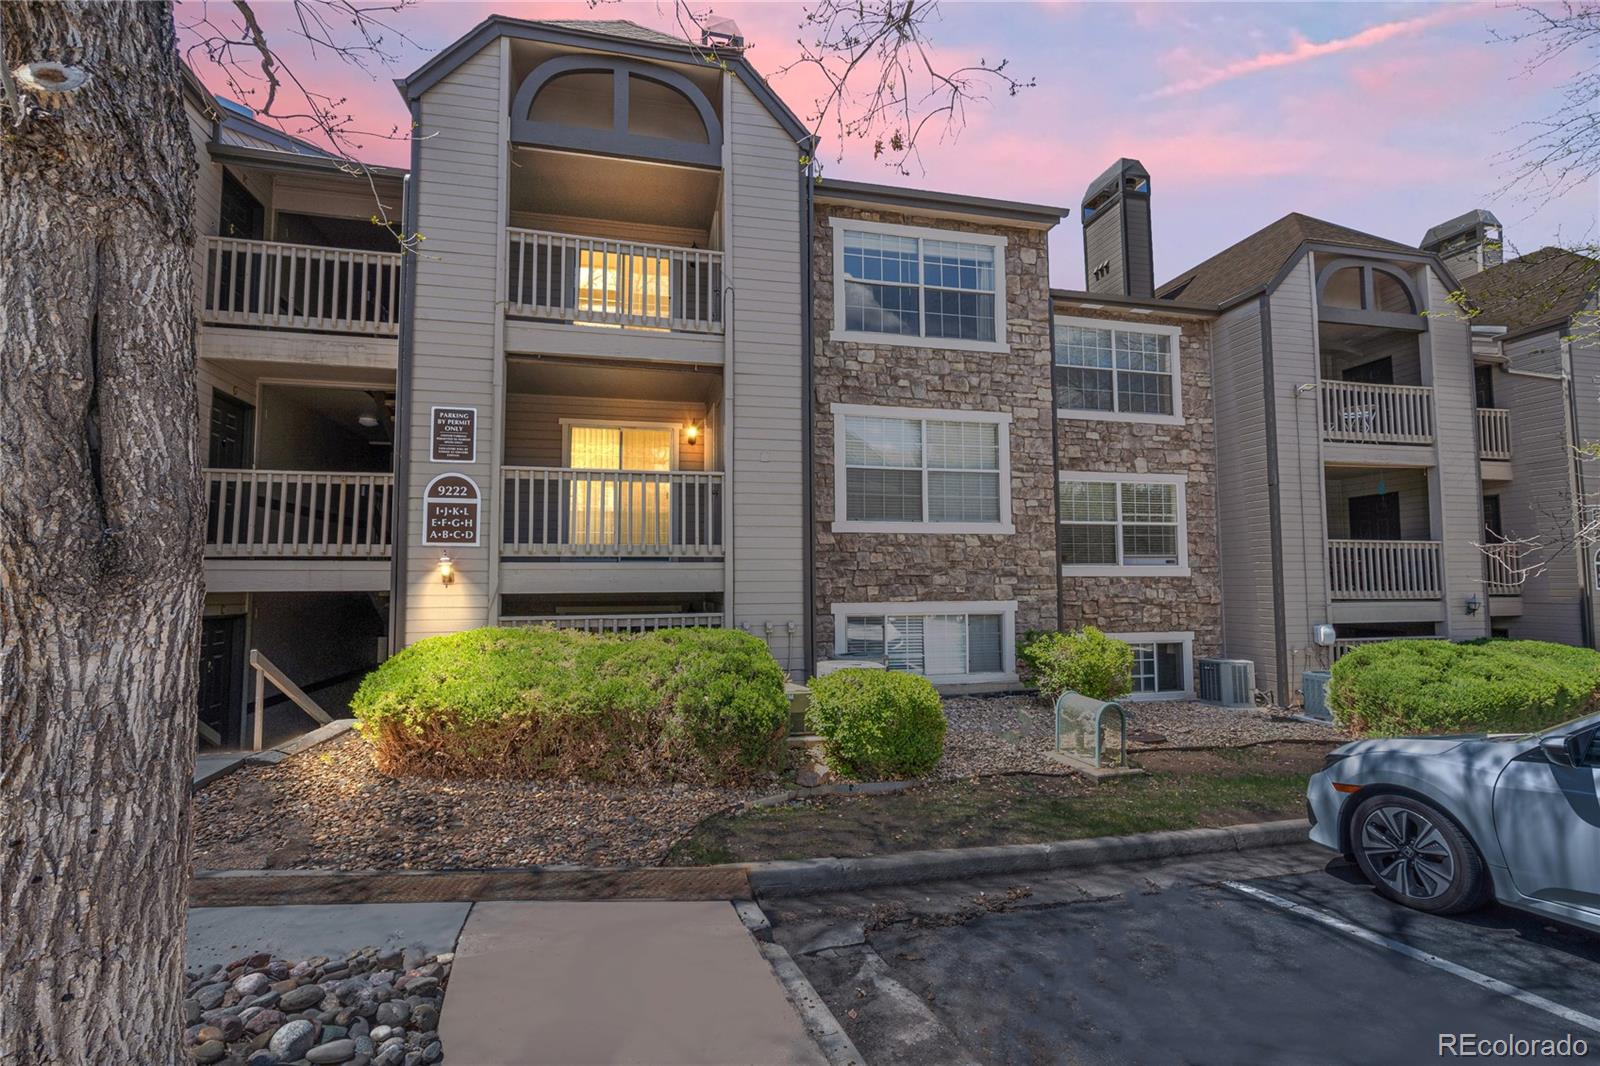
Active
$260,000
1
bds
|
1
ba
|
697
sqft
|
built
1987
9222 E Arbor Cir, Englewood, CO 80111
$-486
Cash flow
-9.8%
Cash-on-Cash Return
3.4%
Cap rate
0.7%
Rent to Value Ratio
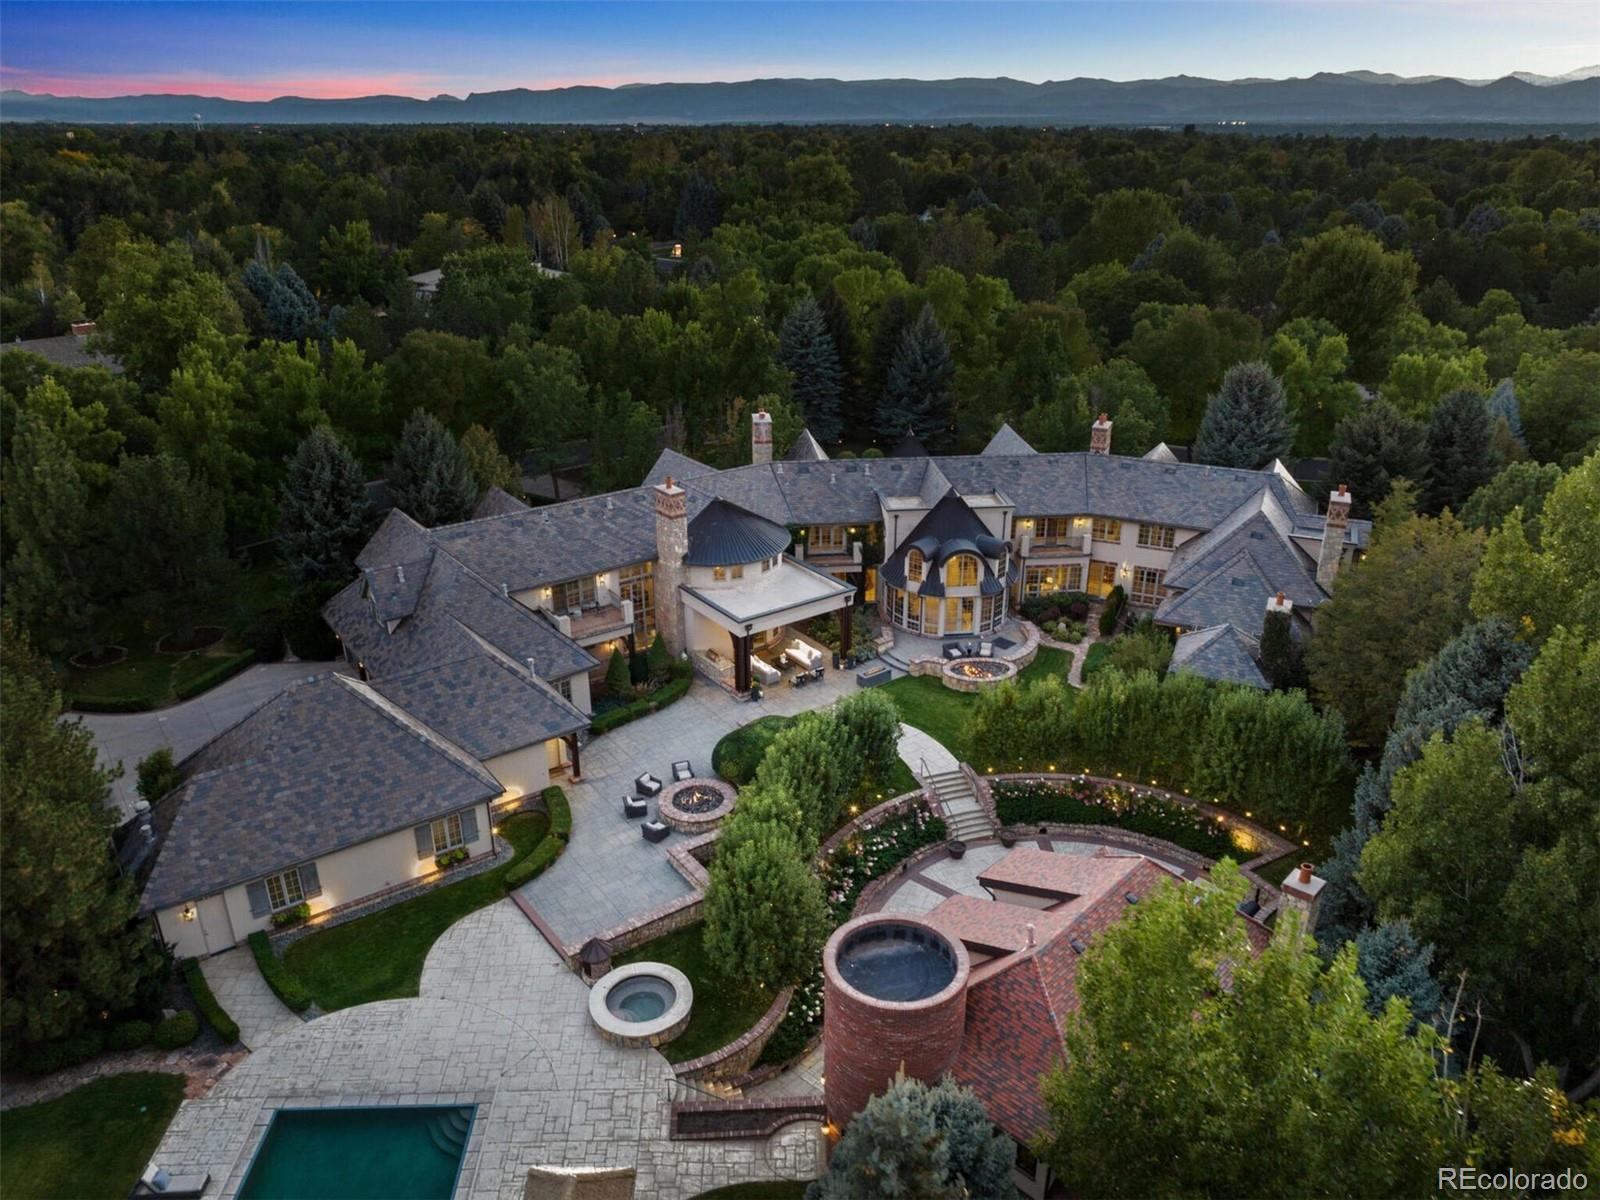
Pending
$7,475,000
7
bds
|
10
ba
|
14,575
sqft
|
built
2002
5 Mockingbird Ln, Englewood, CO 80113
$-33,646
Cash flow
-23.5%
Cash-on-Cash Return
0.3%
Cap rate
0.1%
Rent to Value Ratio
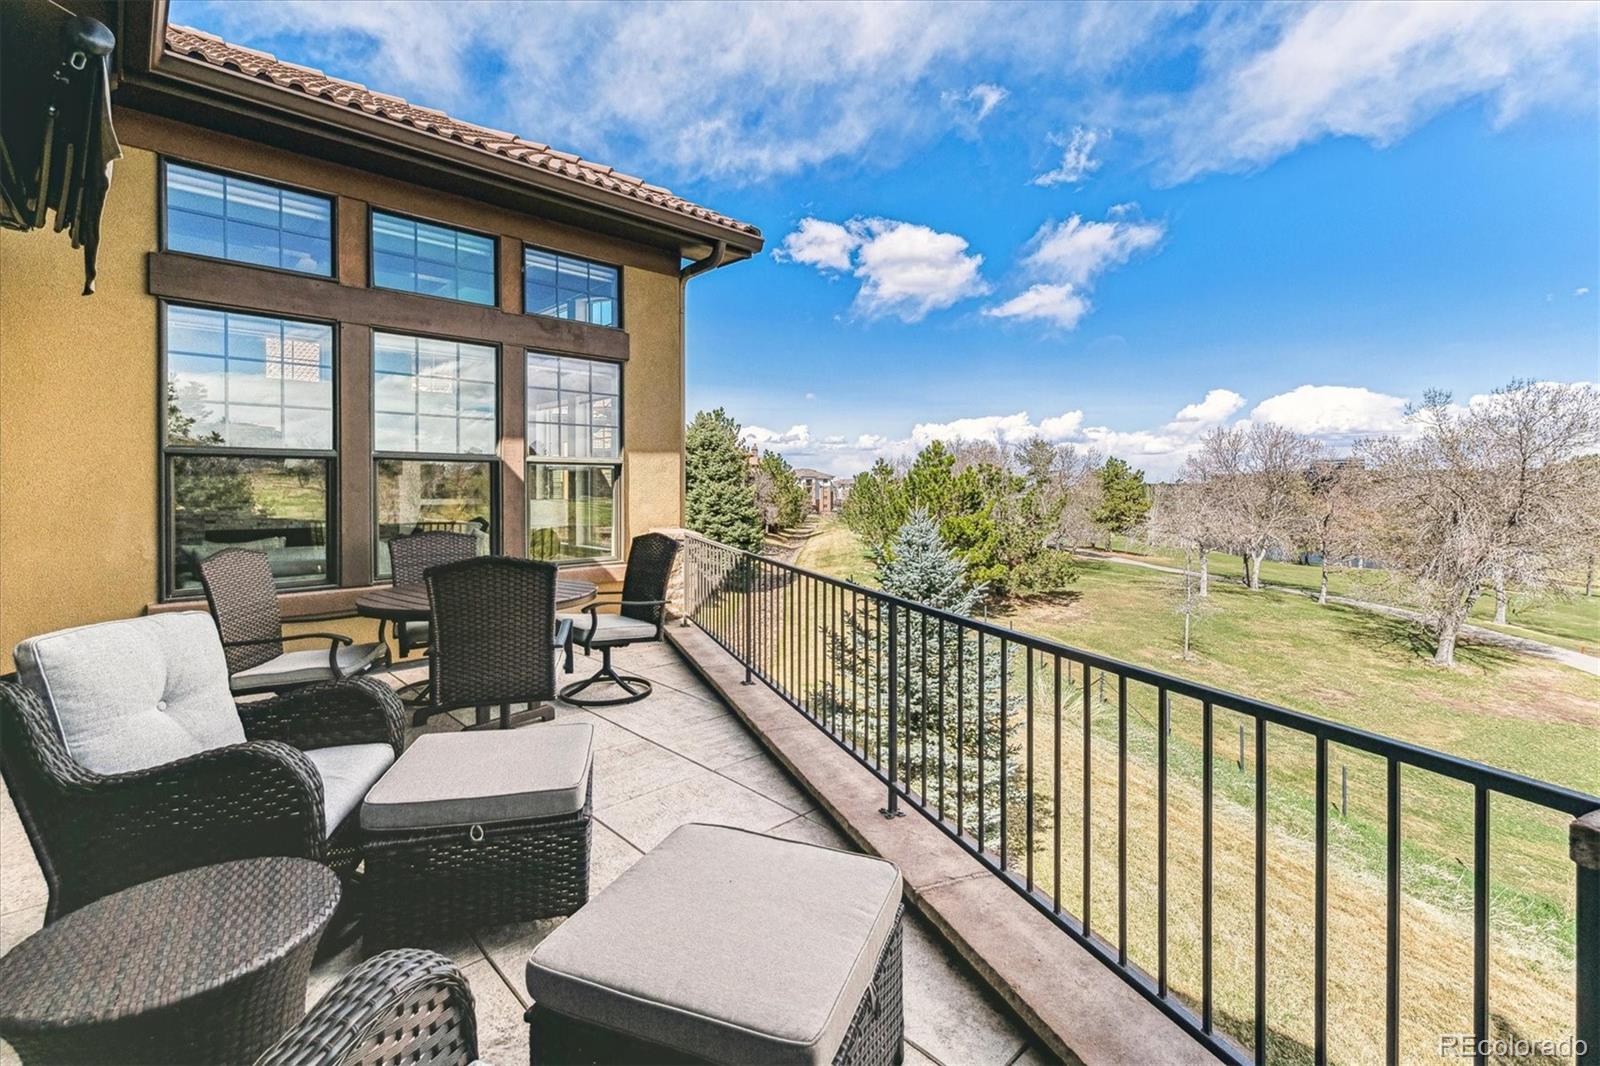
Active under contract
$1,450,000
3
bds
|
4
ba
|
3,255
sqft
|
built
2008
7850 Vallagio Ln, Englewood, CO 80112
$-5,050
Cash flow
-18.2%
Cash-on-Cash Return
1.5%
Cap rate
0.3%
Rent to Value Ratio
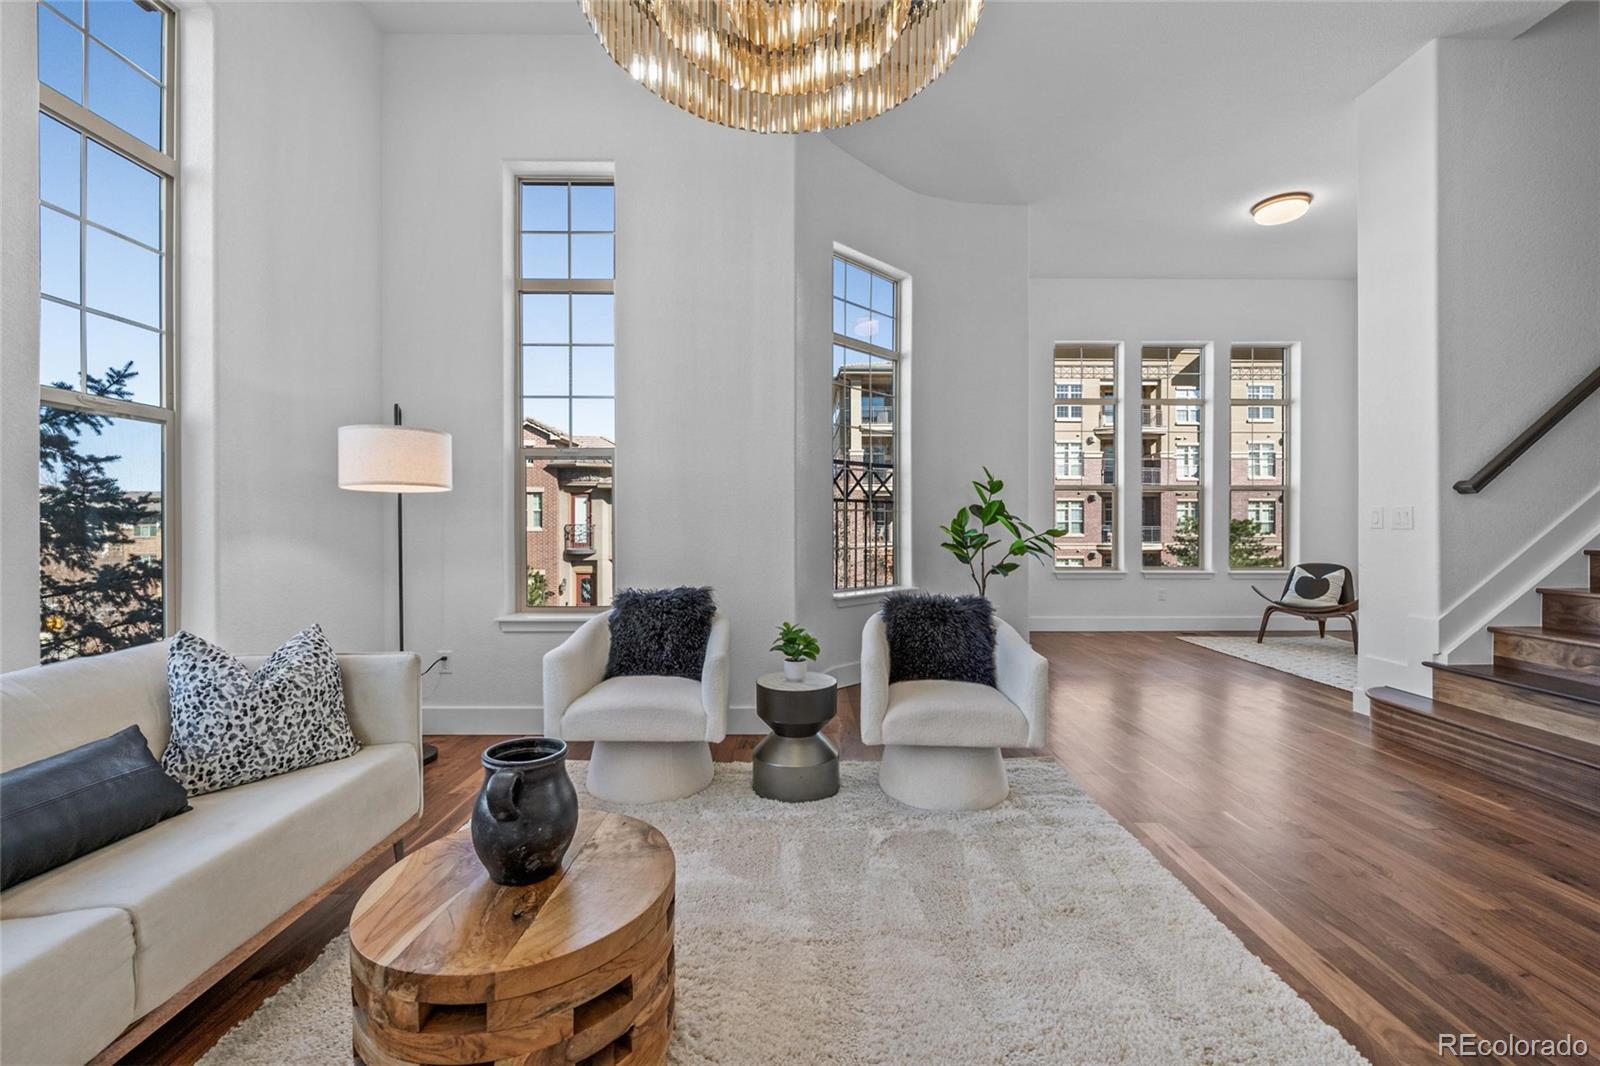
Active under contract
$880,000
3
bds
|
4
ba
|
2,820
sqft
|
built
2008
7821 Inverness Blvd, Englewood, CO 80112
$-1,406
Cash flow
-8.3%
Cash-on-Cash Return
3.8%
Cap rate
0.6%
Rent to Value Ratio
Active
$495,000
2
bds
|
2
ba
|
1,634
sqft
|
built
1982
1900 E Girard Pl, Englewood, CO 80113
$-1,883
Cash flow
-19.8%
Cash-on-Cash Return
1.1%
Cap rate
0.6%
Rent to Value Ratio
Active
$590,000
4
bds
|
2
ba
|
2,068
sqft
|
built
1958
3200 W Chenango Ave, Englewood, CO 80110
$-1,074
Cash flow
-9.5%
Cash-on-Cash Return
3.5%
Cap rate
0.5%
Rent to Value Ratio
Active
$639,000
3
bds
|
2
ba
|
1,906
sqft
|
built
1958
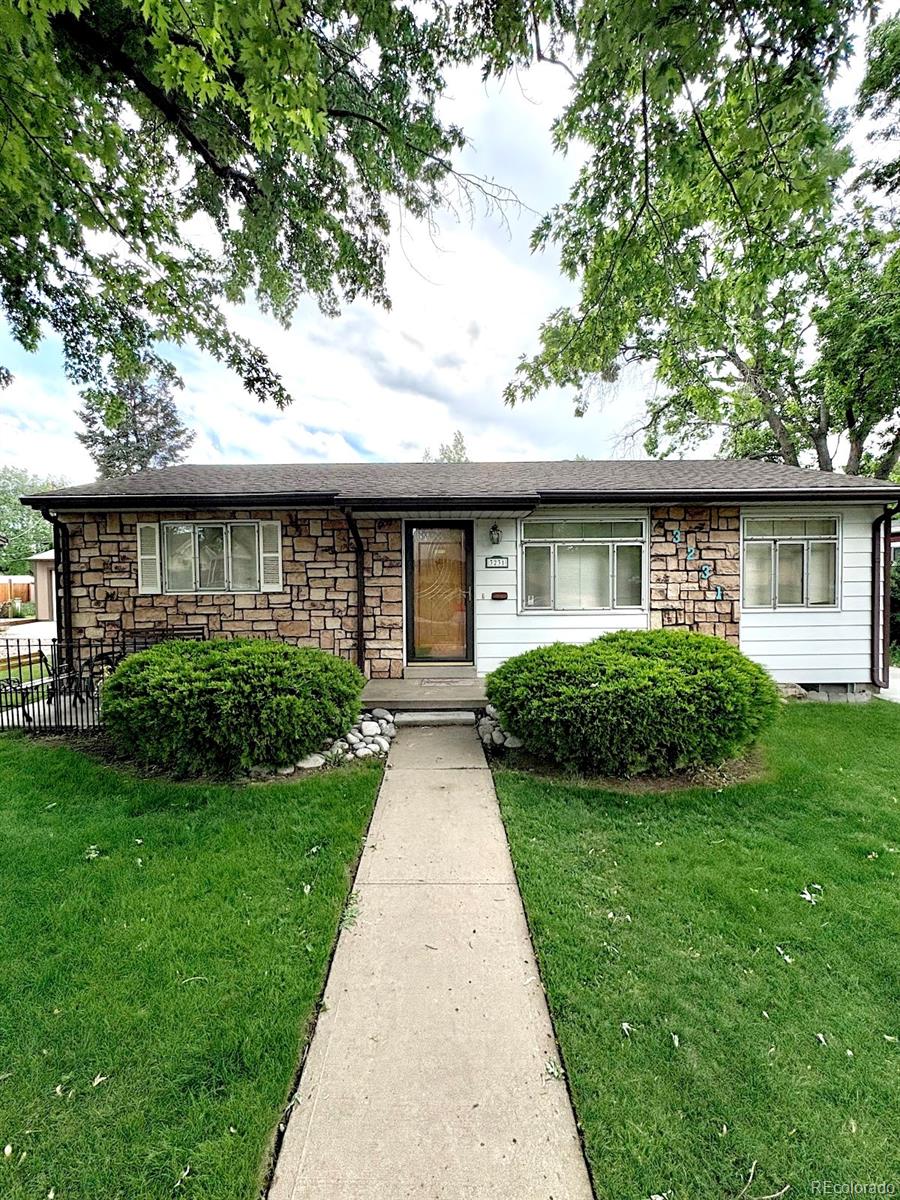
3231 S Galapago St, Englewood, CO 80110
$-990
Cash flow
-8.1%
Cash-on-Cash Return
3.8%
Cap rate
0.5%
Rent to Value Ratio
Active
$350,000
2
bds
|
2
ba
|
1,065
sqft
|
built
2006
15460 Canyon Gulch Ln, Englewood, CO 80112
$-814
Cash flow
-12.1%
Cash-on-Cash Return
2.9%
Cap rate
0.6%
Rent to Value Ratio
Active
$255,000
1
bds
|
1
ba
|
709
sqft
|
built
1979
9797 E Peakview Ave, Englewood, CO 80111
$-197
Cash flow
-4.0%
Cash-on-Cash Return
4.8%
Cap rate
0.9%
Rent to Value Ratio
Active under contract
$995,000
5
bds
|
4
ba
|
3,185
sqft
|
built
1980
9837 E Aberdeen Ave, Englewood, CO 80111
$-2,231
Cash flow
-11.7%
Cash-on-Cash Return
3.0%
Cap rate
0.5%
Rent to Value Ratio
Active
$875,000
4
bds
|
2
ba
|
2,176
sqft
|
built
1956
3380 S Ogden St, Englewood, CO 80113
$-1,479
Cash flow
-8.8%
Cash-on-Cash Return
3.7%
Cap rate
0.5%
Rent to Value Ratio
Active
$689,900
2
bds
|
2
ba
|
2,377
sqft
|
built
1982
1900 E Girard Pl, Englewood, CO 80113
$-3,201
Cash flow
-24.2%
Cash-on-Cash Return
0.1%
Cap rate
0.5%
Rent to Value Ratio
Active under contract
$650,000
4
bds
|
2
ba
|
1,488
sqft
|
built
1927
3150 S Pennsylvania St, Englewood, CO 80113
$-1,707
Cash flow
-13.7%
Cash-on-Cash Return
2.5%
Cap rate
0.4%
Rent to Value Ratio
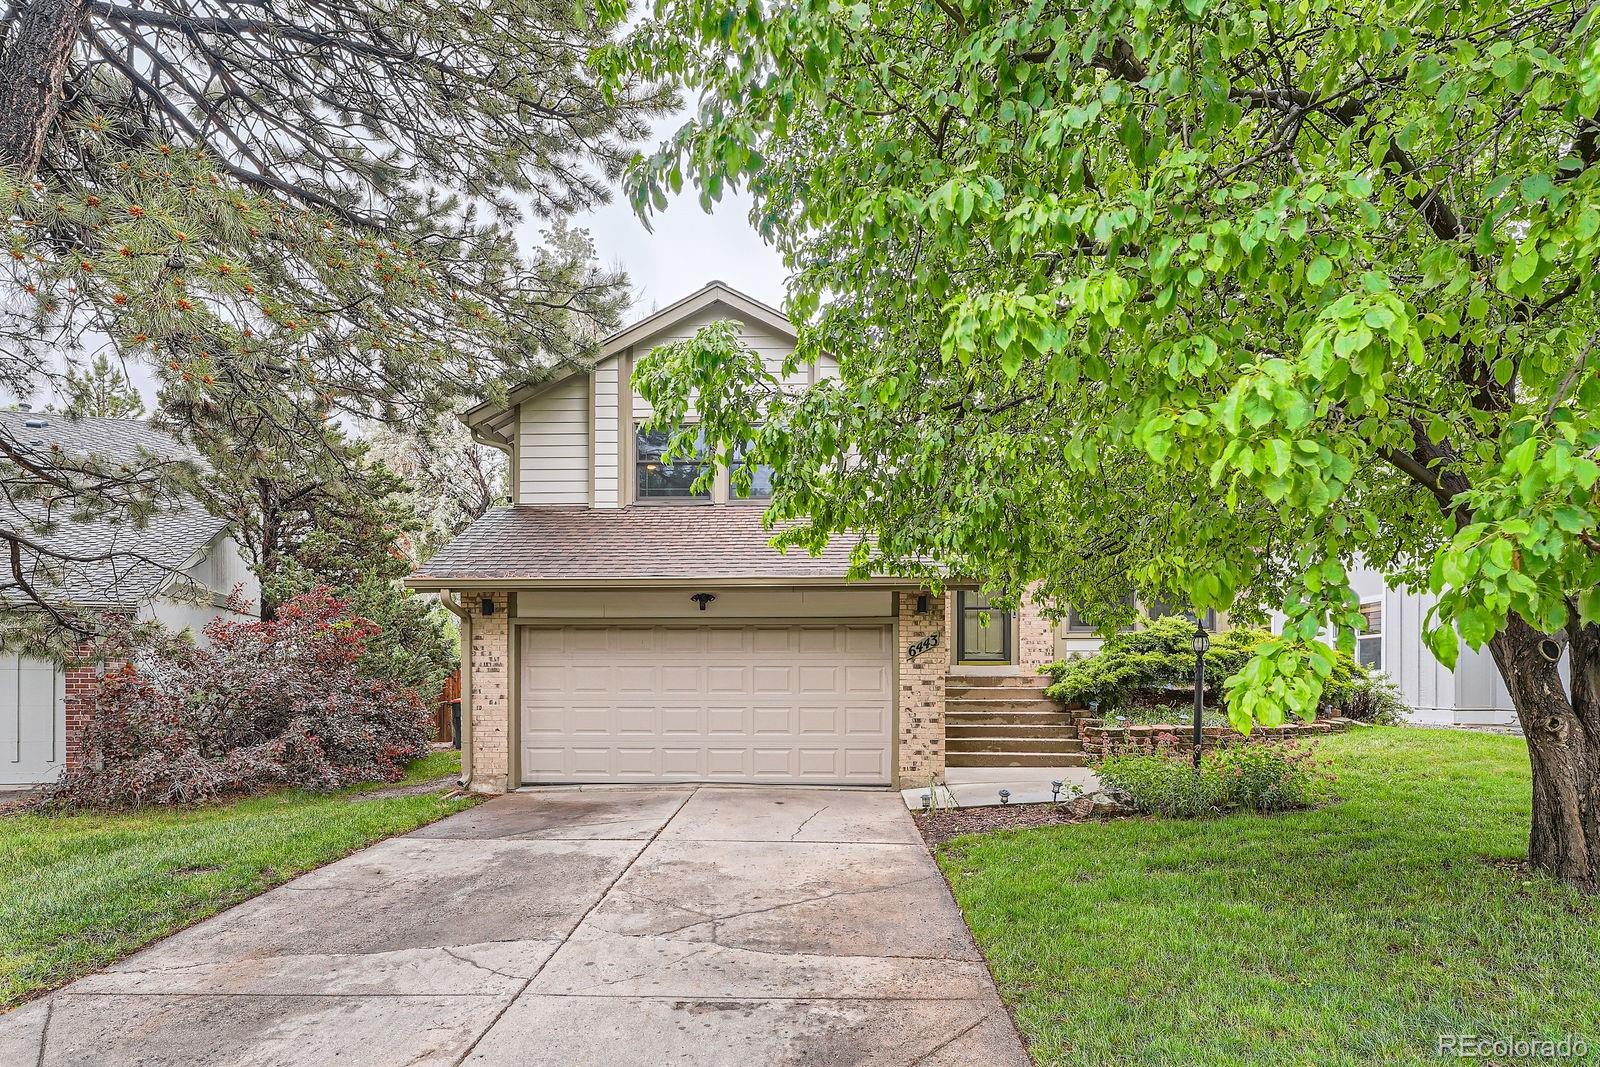
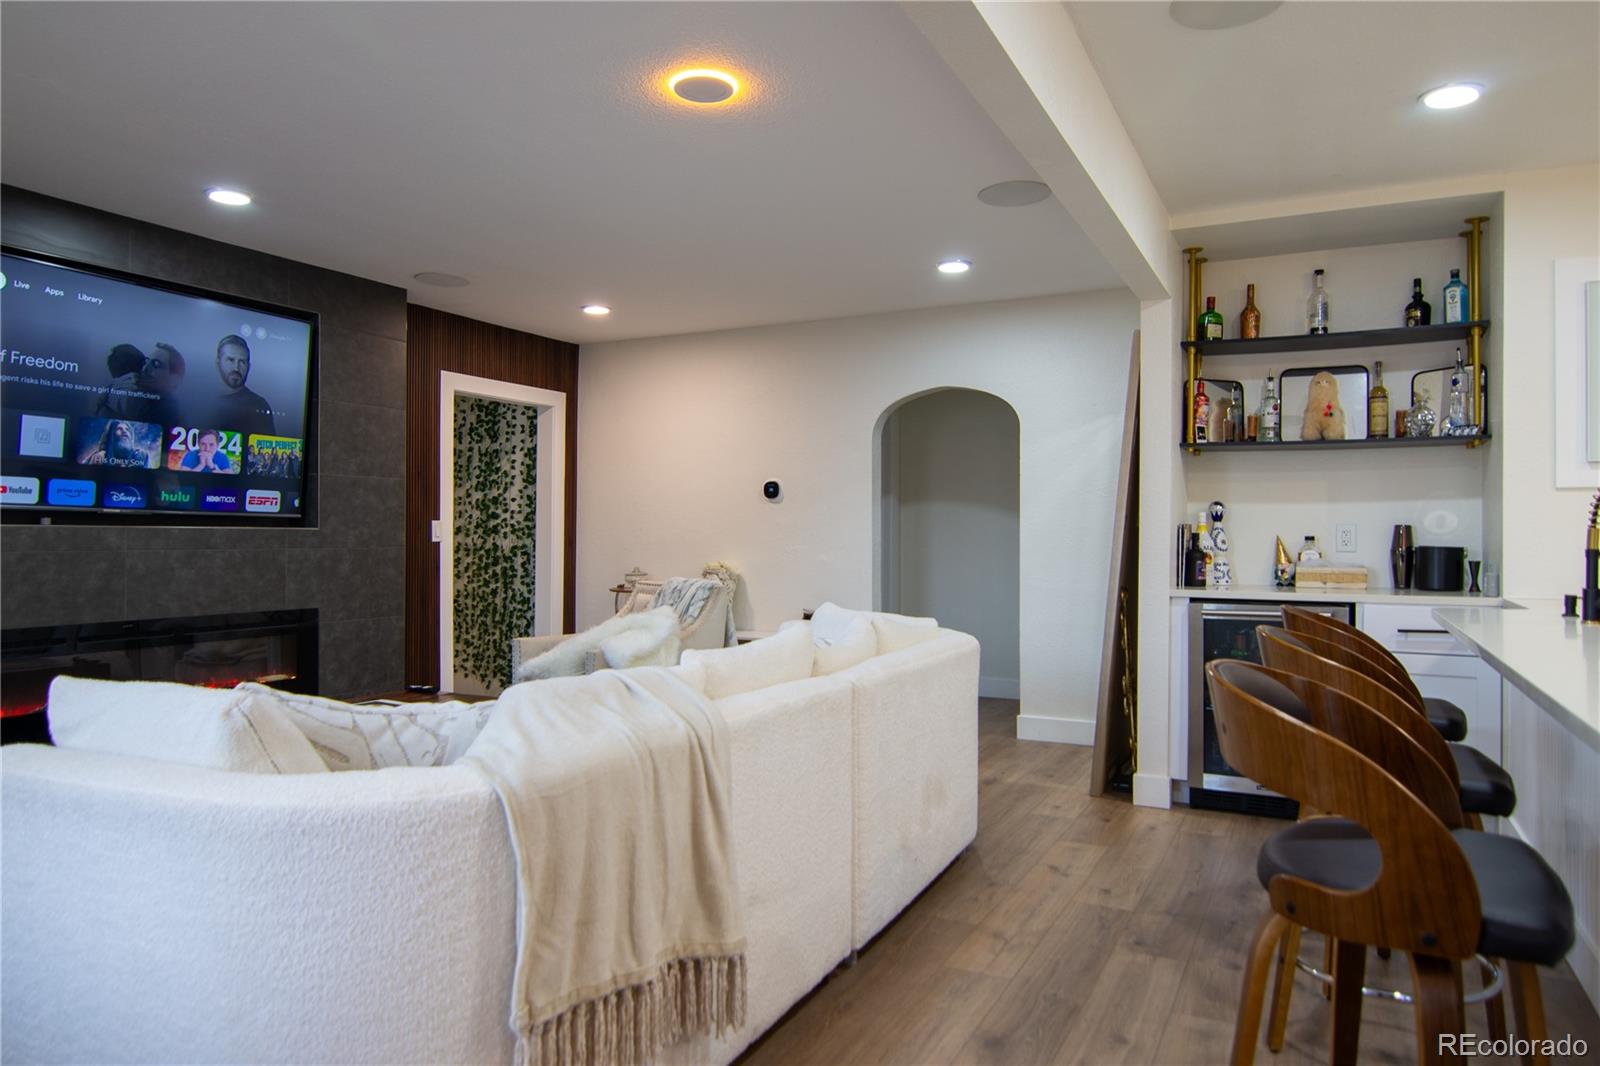
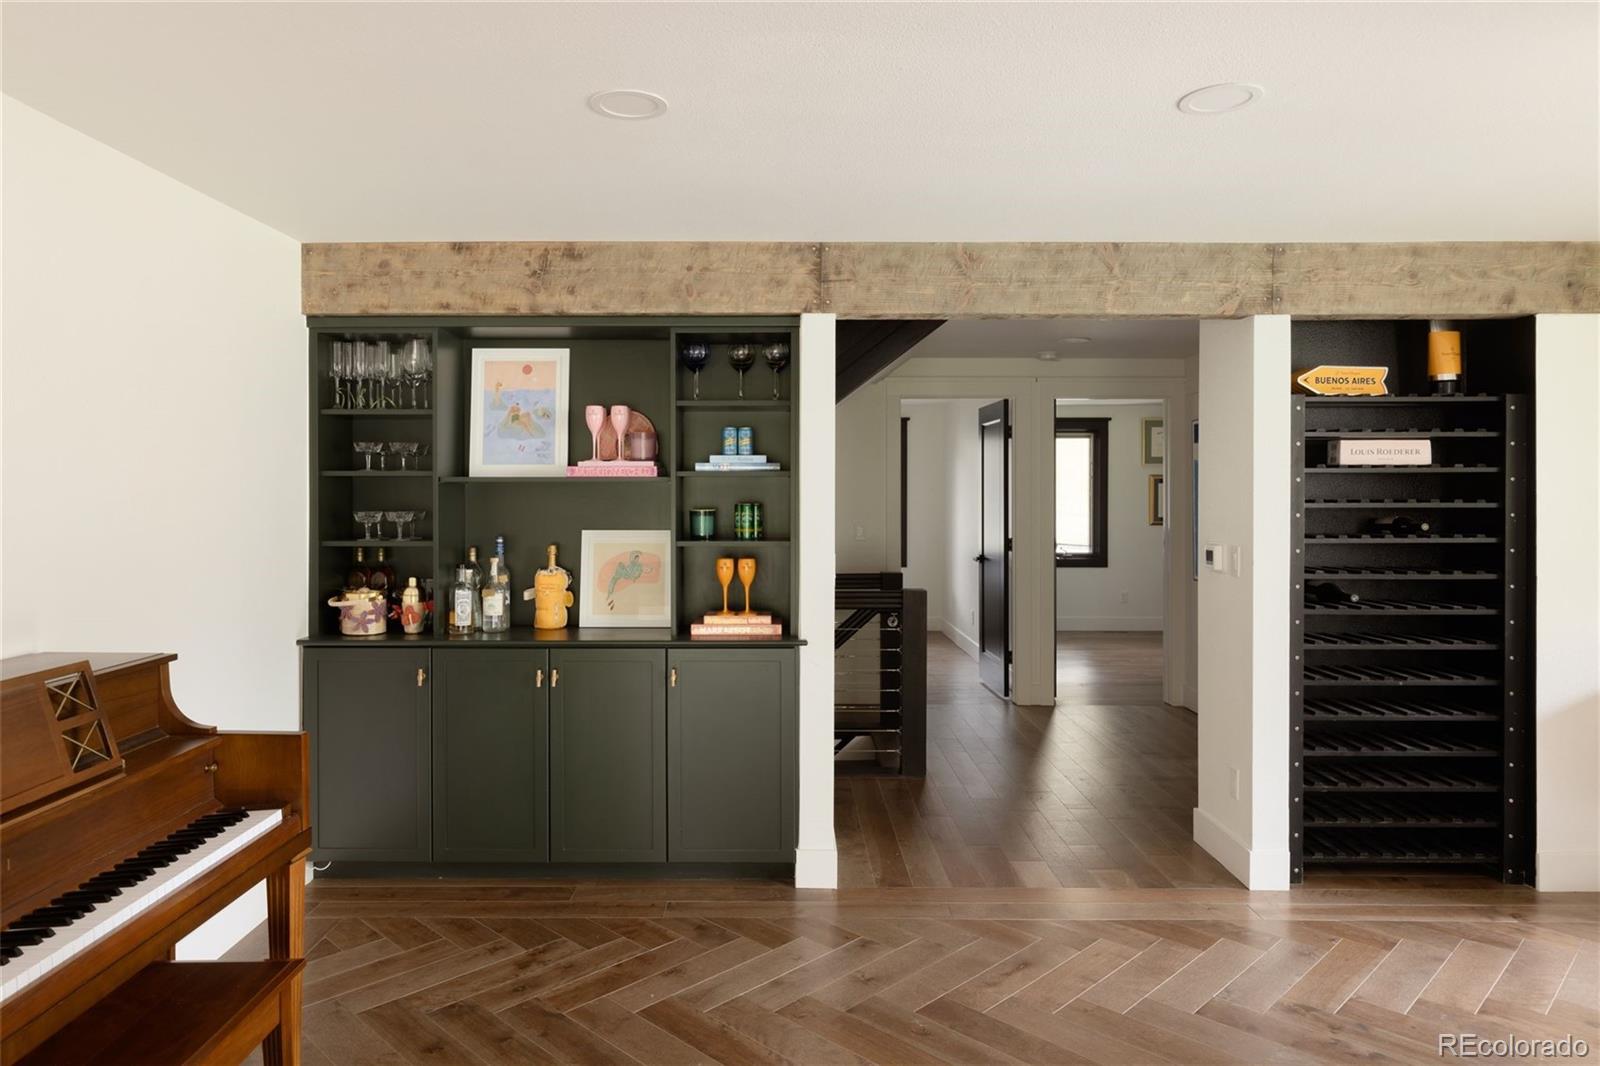
Active
$910,000
3
bds
|
4
ba
|
2,406
sqft
|
built
1978
6443 S Florence Way, Englewood, CO 80111
$-1,445
Cash flow
-8.3%
Cash-on-Cash Return
3.8%
Cap rate
0.5%
Rent to Value Ratio
Active
$695,000
6
bds
|
3
ba
|
2,446
sqft
|
built
1938
3701 S Grant St, Englewood, CO 80113
$-2,150
Cash flow
-16.1%
Cash-on-Cash Return
2.0%
Cap rate
0.3%
Rent to Value Ratio
Active
$2,475,000
6
bds
|
4
ba
|
3,693
sqft
|
built
1971
4121 S Cherry St, Englewood, CO 80113
$-5,832
Cash flow
-12.3%
Cash-on-Cash Return
2.9%
Cap rate
0.4%
Rent to Value Ratio
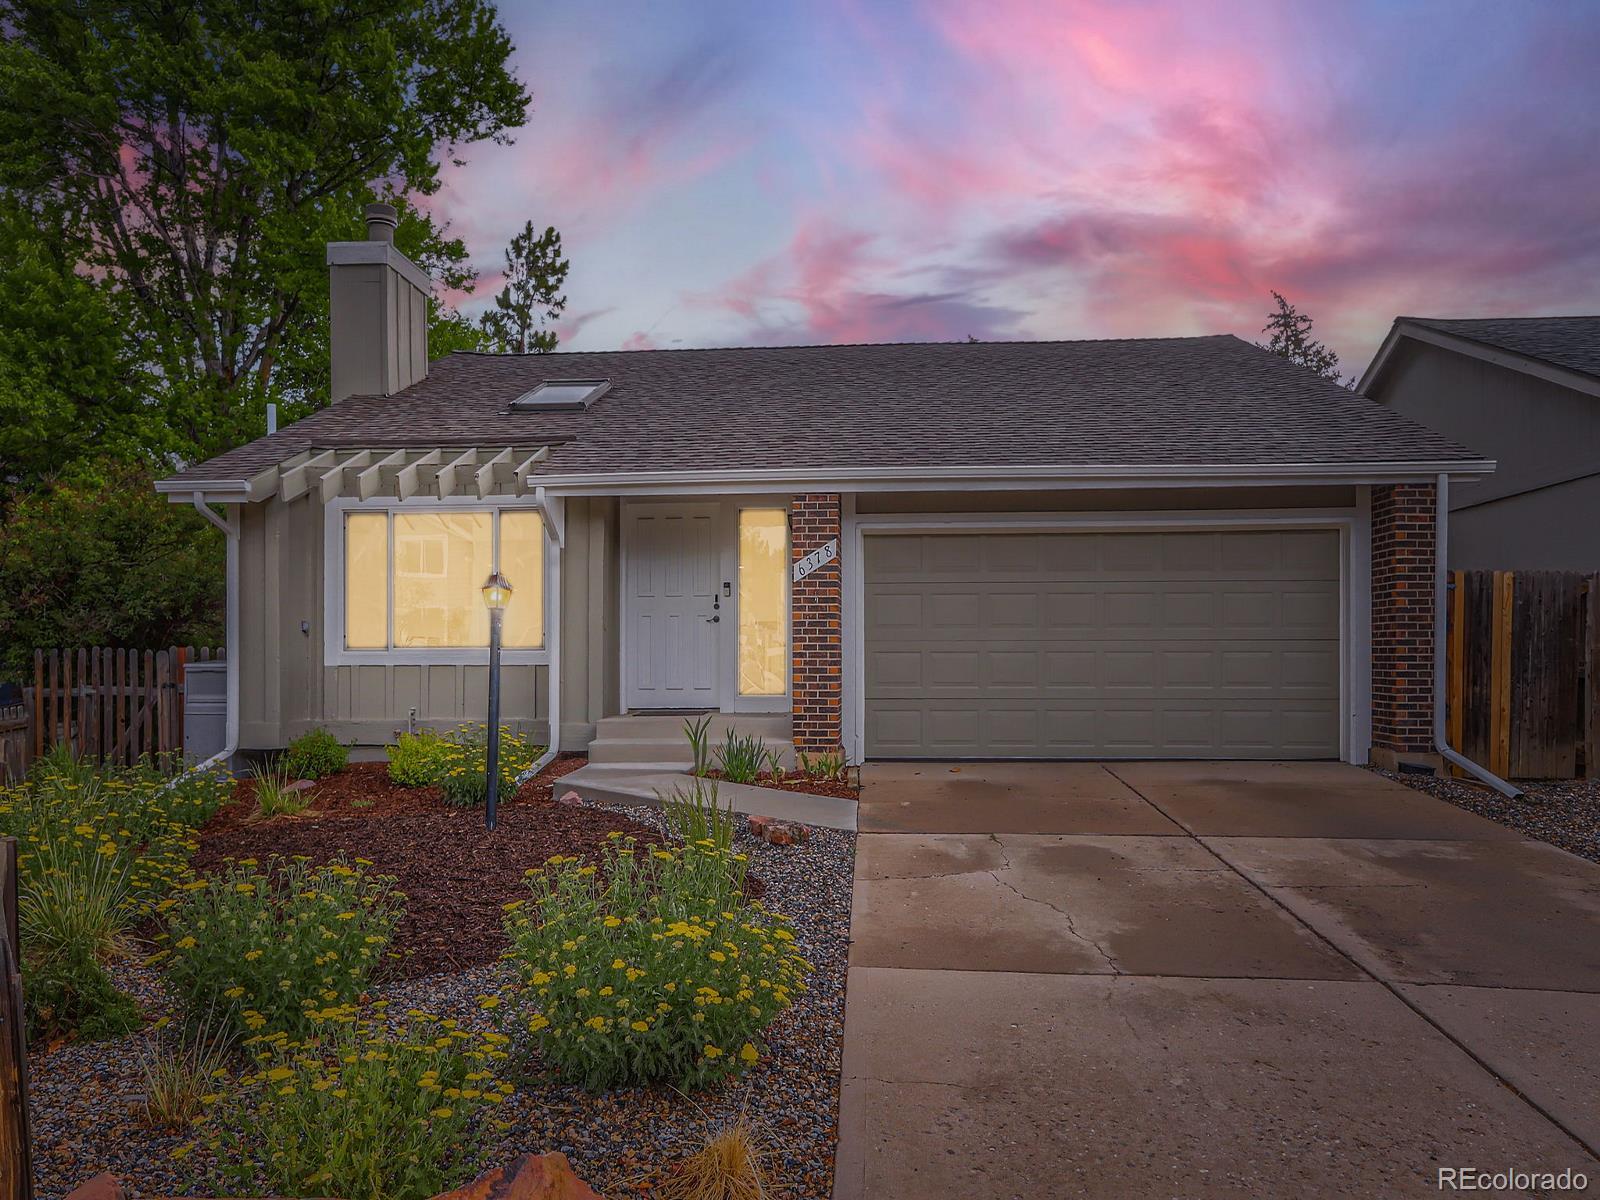
Active
$849,000
5
bds
|
3
ba
|
2,600
sqft
|
built
1978
6378 S Emporia Cir, Englewood, CO 80111
$-1,749
Cash flow
-10.7%
Cash-on-Cash Return
3.2%
Cap rate
0.5%
Rent to Value Ratio
Active
$585,000
3
bds
|
2
ba
|
1,662
sqft
|
built
1961
3306 S Logan St, Englewood, CO 80113
$-994
Cash flow
-8.9%
Cash-on-Cash Return
3.6%
Cap rate
0.5%
Rent to Value Ratio
Active
$529,000
4
bds
|
2
ba
|
1,320
sqft
|
built
1959
2986 W Union Ave, Englewood, CO 80110
$-748
Cash flow
-7.4%
Cash-on-Cash Return
4.0%
Cap rate
0.5%
Rent to Value Ratio
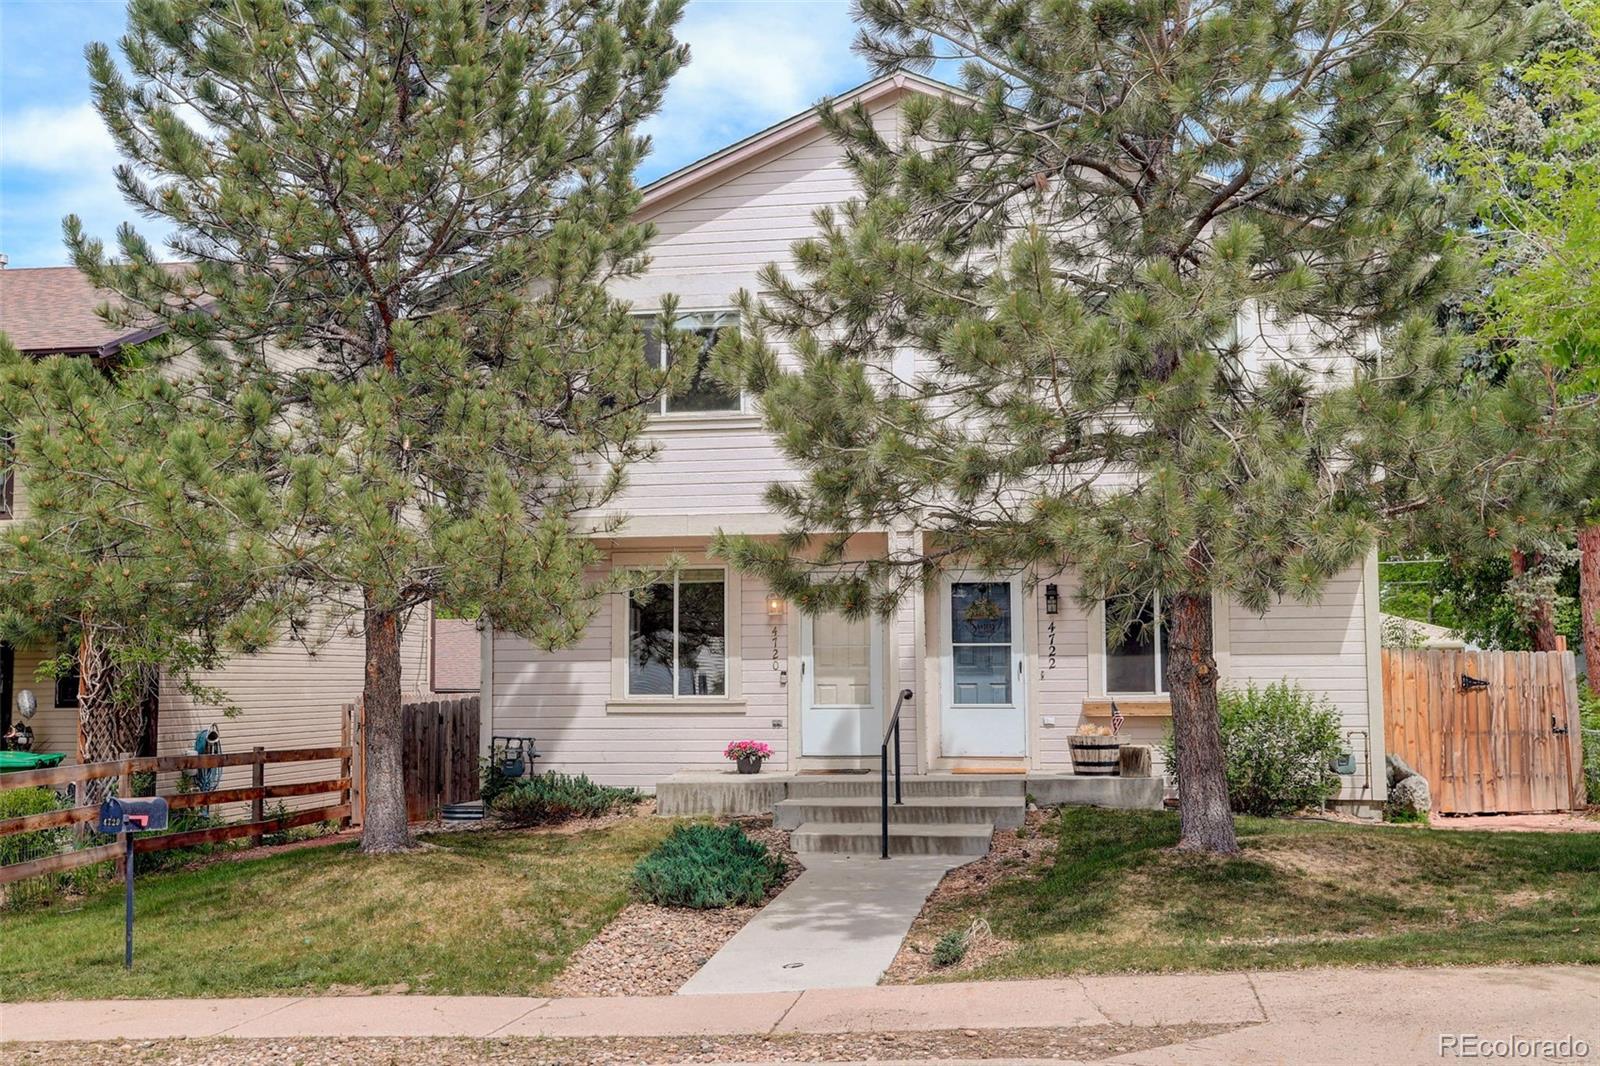
Active
$479,000
3
bds
|
2
ba
|
1,120
sqft
|
built
2000
4720 S Bannock St, Englewood, CO 80110
$-754
Cash flow
-8.2%
Cash-on-Cash Return
3.8%
Cap rate
0.5%
Rent to Value Ratio
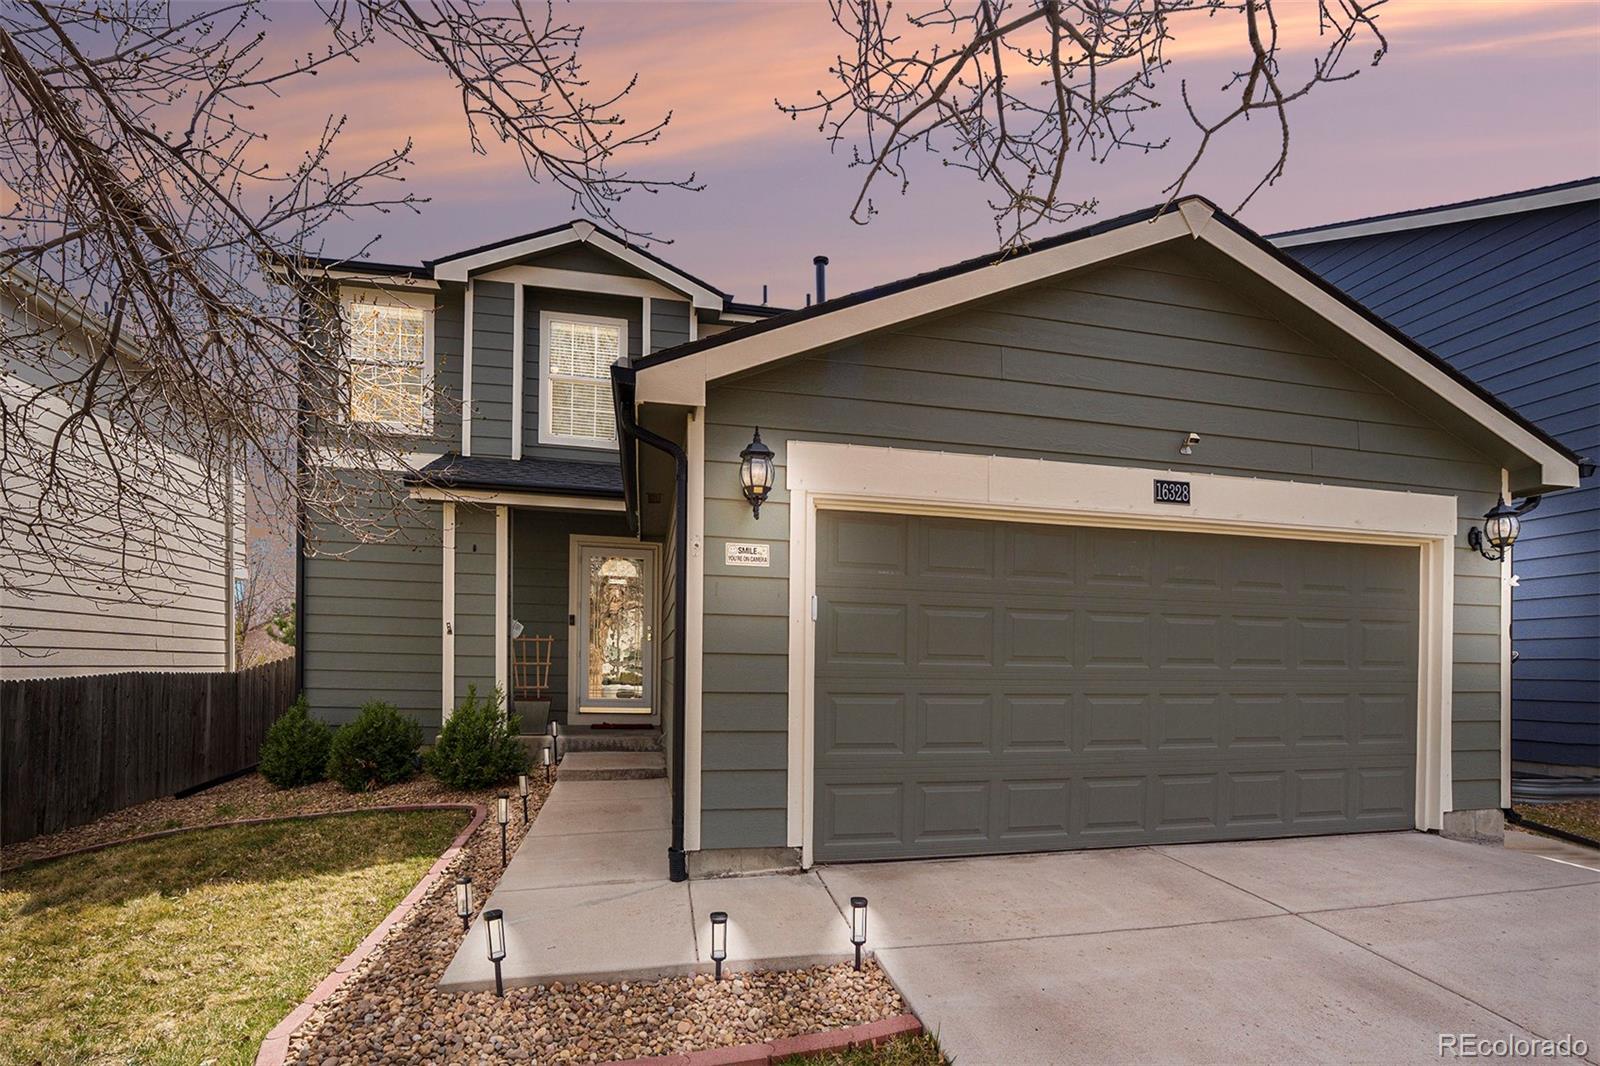
Active
$575,000
3
bds
|
4
ba
|
1,983
sqft
|
built
2000
16328 E Phillips Ln, Englewood, CO 80112
$-1,102
Cash flow
-10.0%
Cash-on-Cash Return
3.4%
Cap rate
0.5%
Rent to Value Ratio
Active
$3,295,000
5
bds
|
8
ba
|
6,920
sqft
|
built
1967
39 Sedgwick Dr, Englewood, CO 80113
$-11,607
Cash flow
-18.4%
Cash-on-Cash Return
1.5%
Cap rate
0.3%
Rent to Value Ratio