Englewood, CO Investment Properties for Sale
Browse homes for sale and investment properties in Englewood, CO. Refine your search by price, property type, or more.
Best cash flowing properties in Englewood, CO
Active
$339,900
1
bds
|
1
ba
|
696
sqft
|
built
1955
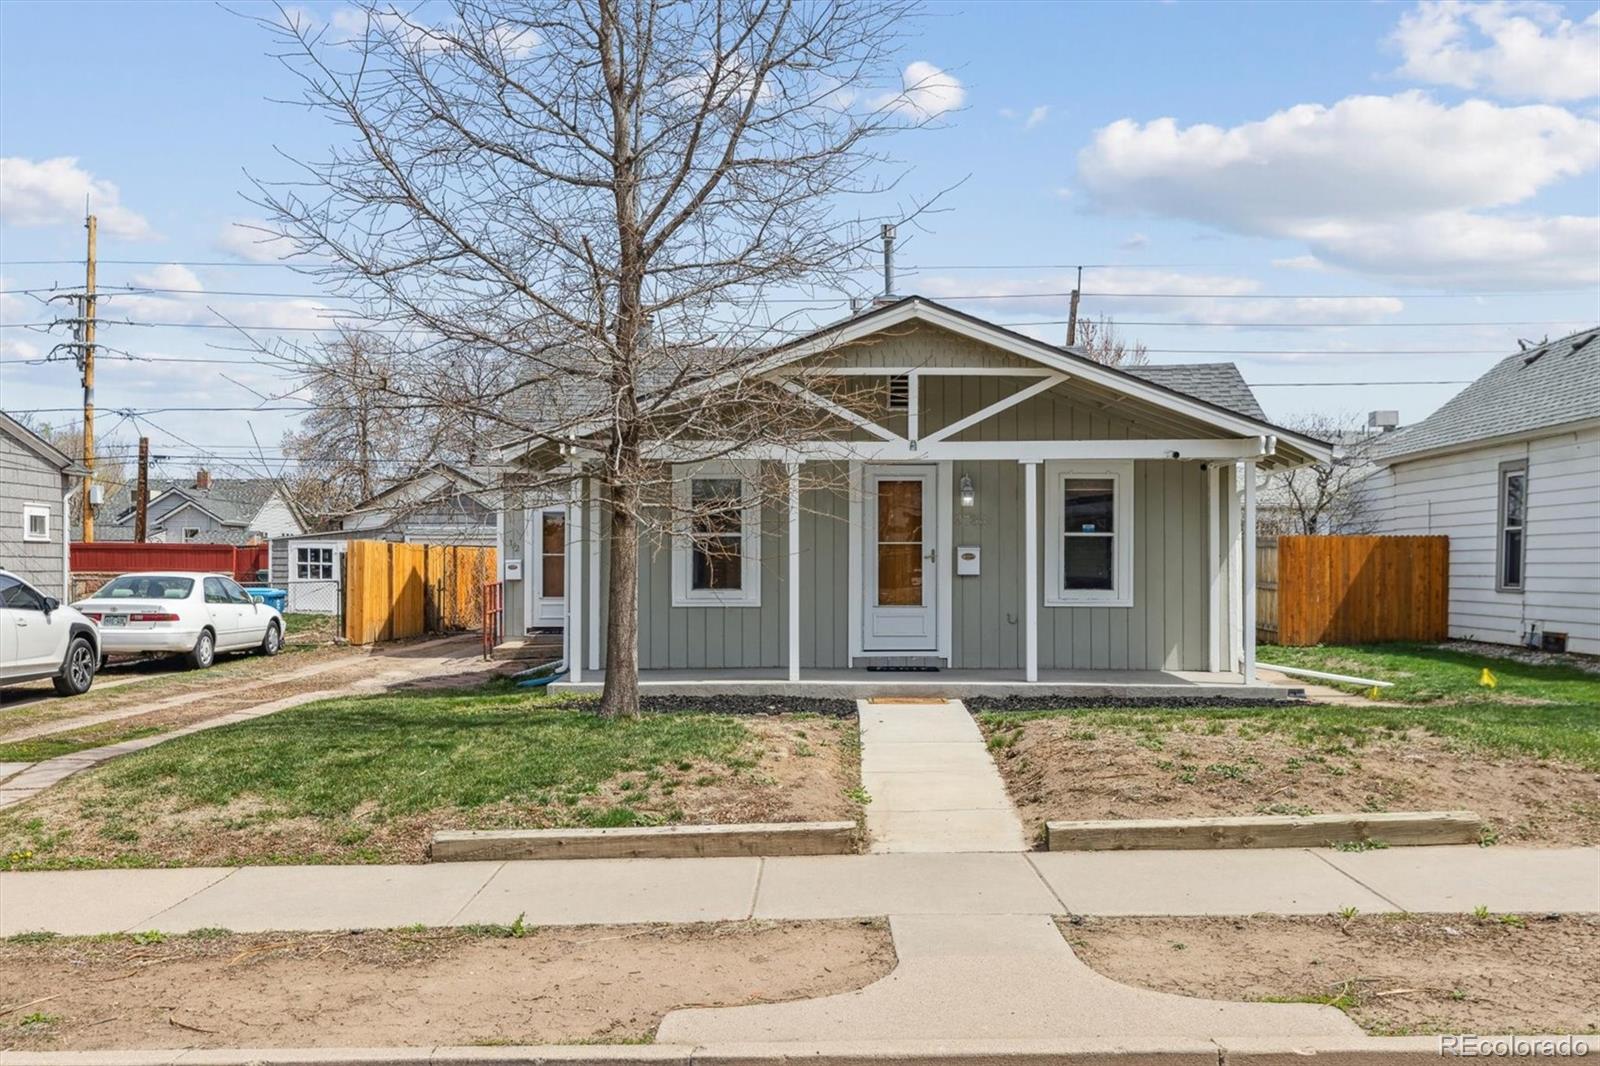
3101 W Jefferson Ave, Englewood, CO 80110
$-382
Cash flow
-5.9%
Cash-on-Cash Return
4.3%
Cap rate
0.6%
Rent to Value Ratio
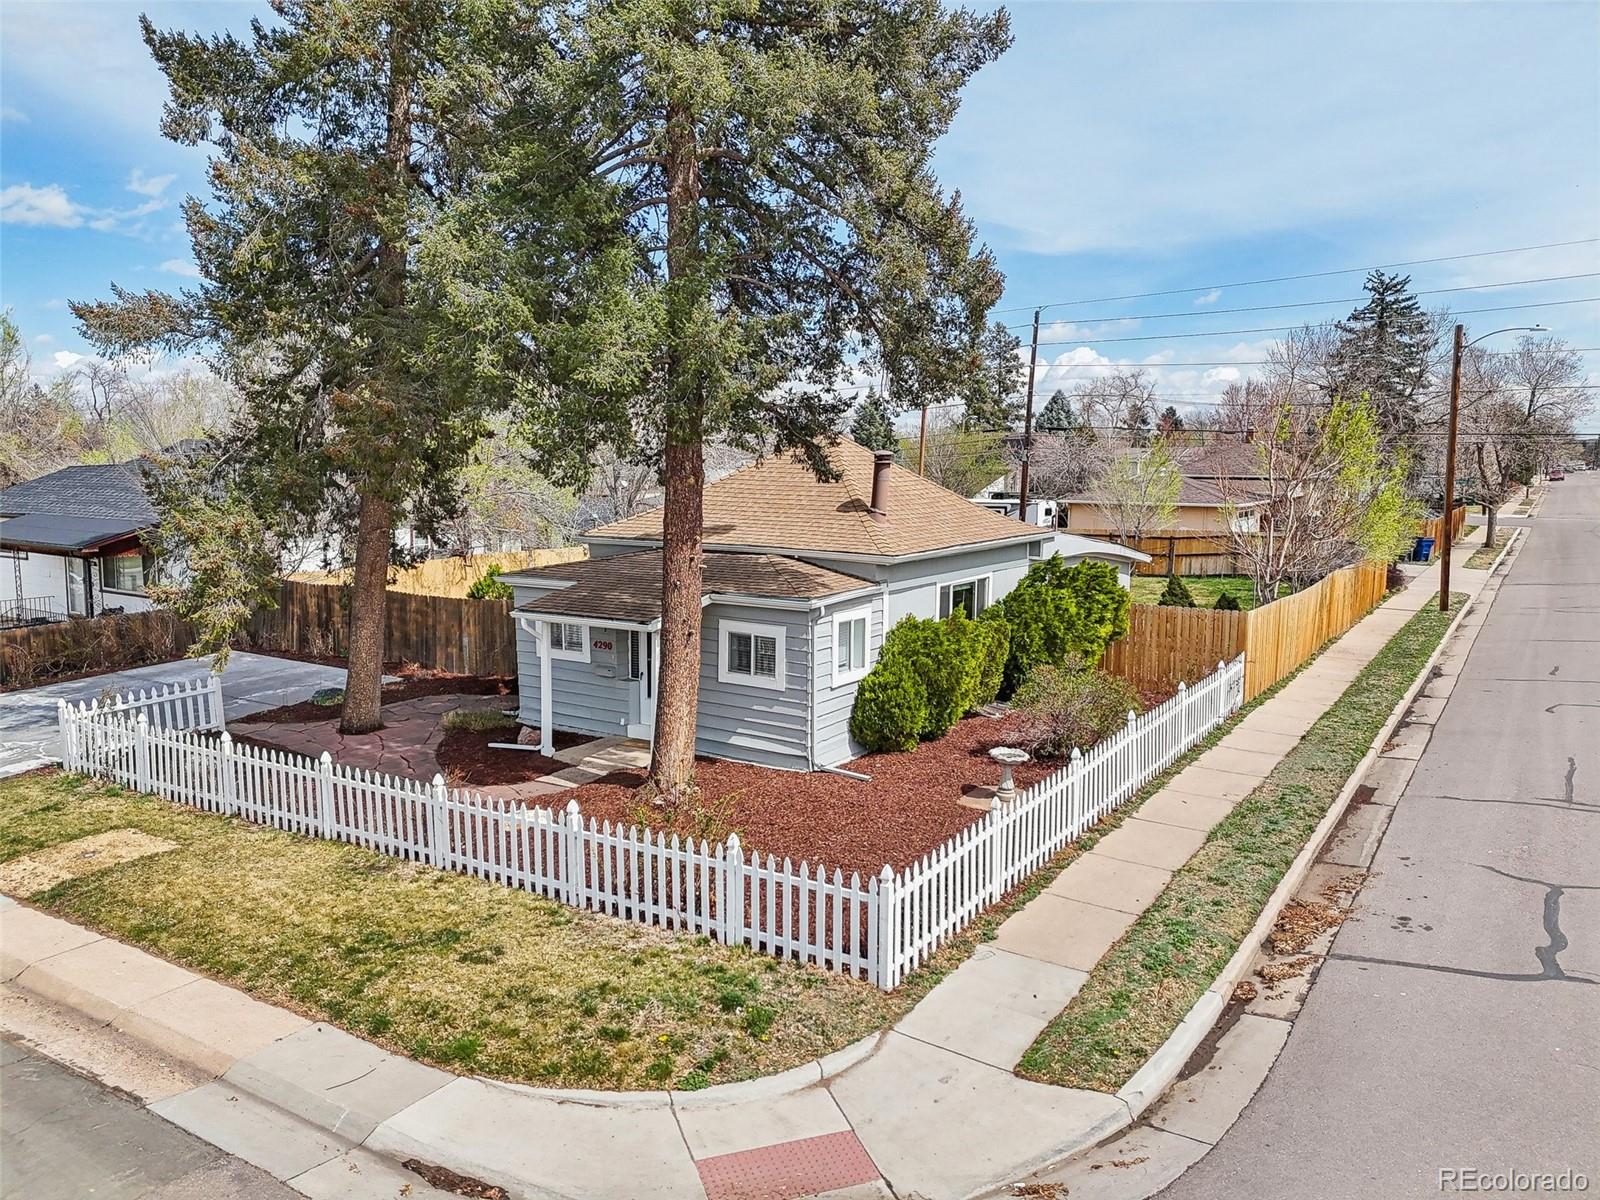
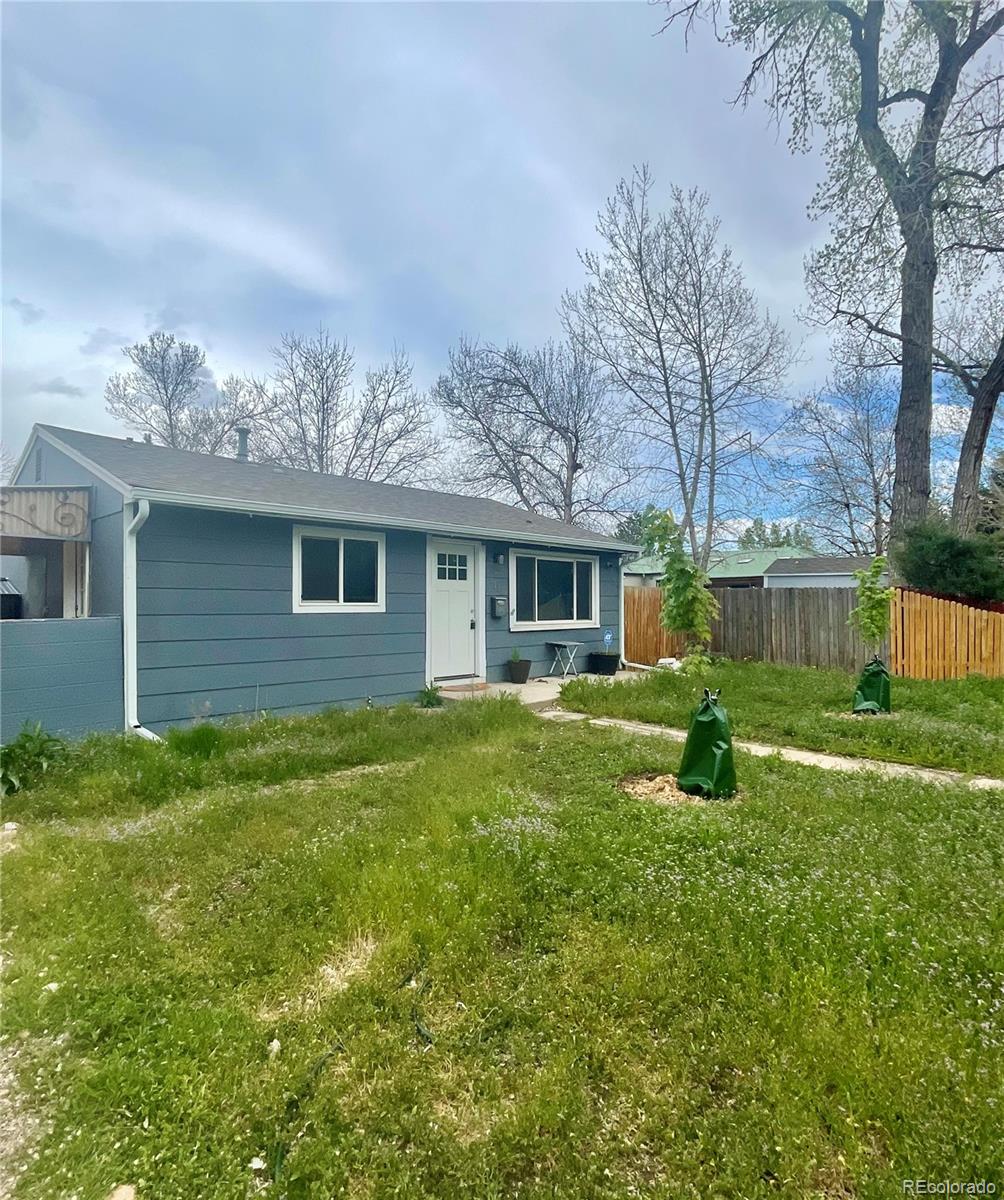
Active
$485,000
3
bds
|
1
ba
|
1,539
sqft
|
built
1910
4290 S Cherokee St, Englewood, CO 80110
$-585
Cash flow
-6.3%
Cash-on-Cash Return
4.2%
Cap rate
0.6%
Rent to Value Ratio
156 out of 158 properties for sale in Englewood, CO
Limited Results Shown
Create a free account, or log in to reveal all property listings and enjoy the complete experience.
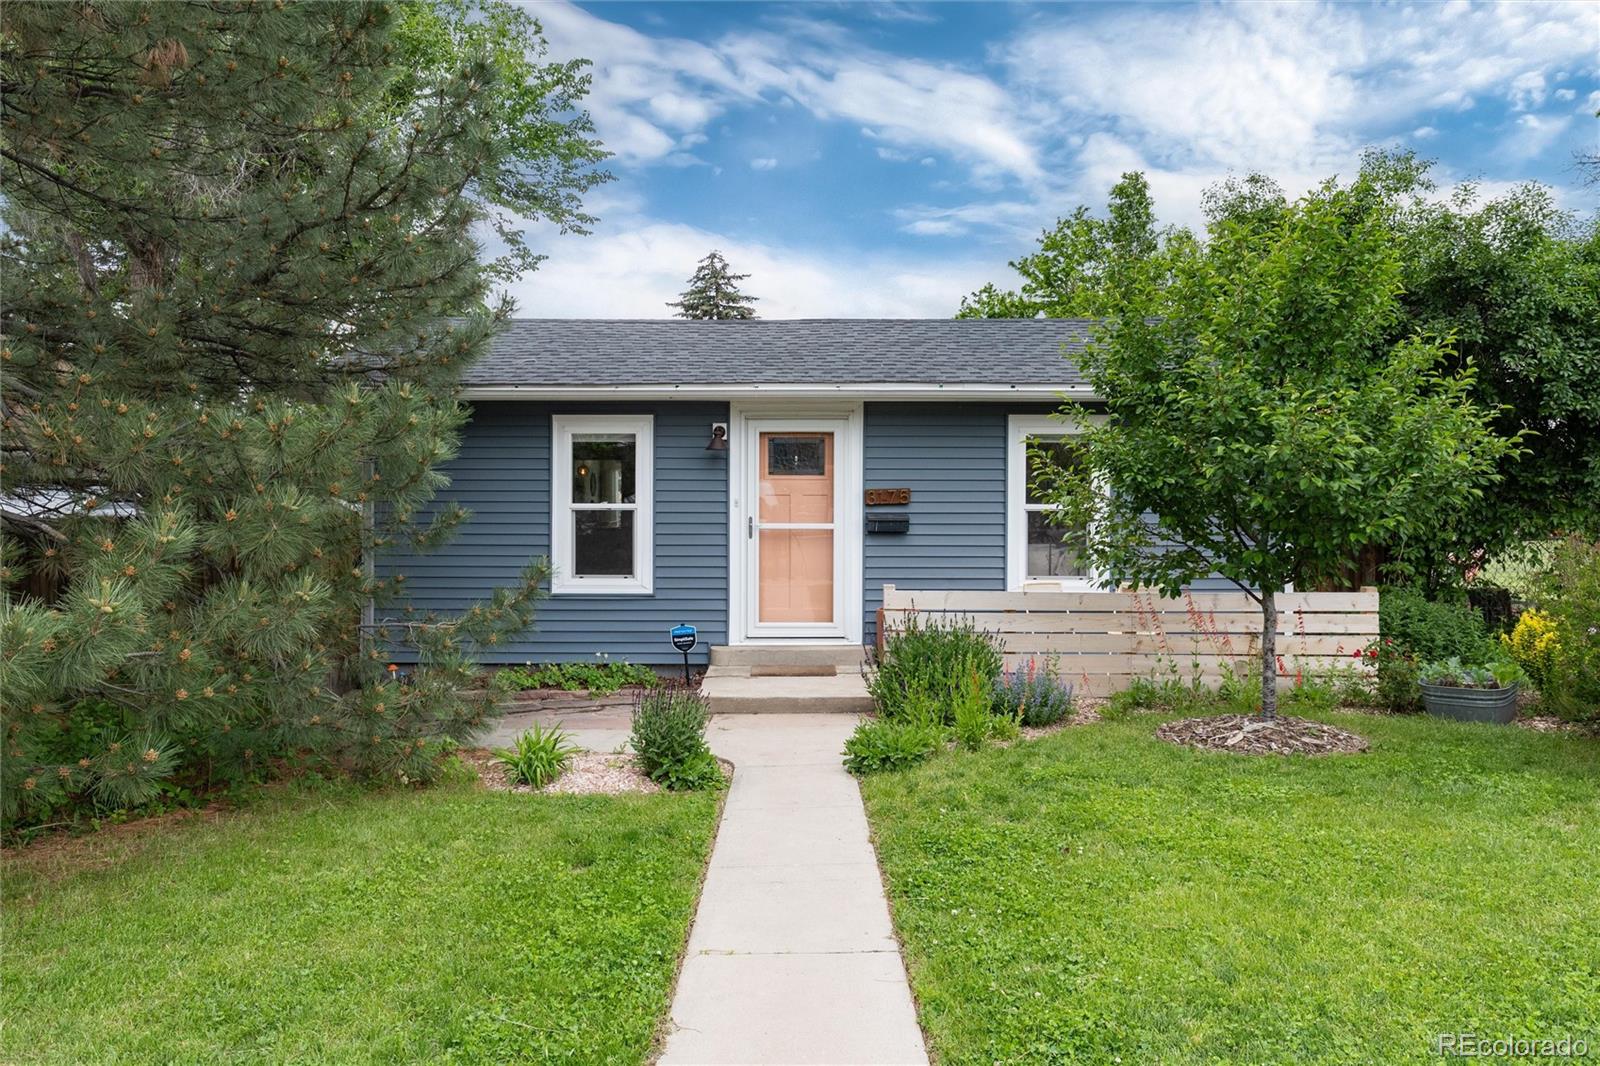
Active
$459,000
3
bds
|
1
ba
|
944
sqft
|
built
1942
4480 S Pennsylvania St, Englewood, CO 80113
$-590
Cash flow
-6.7%
Cash-on-Cash Return
4.1%
Cap rate
0.5%
Rent to Value Ratio

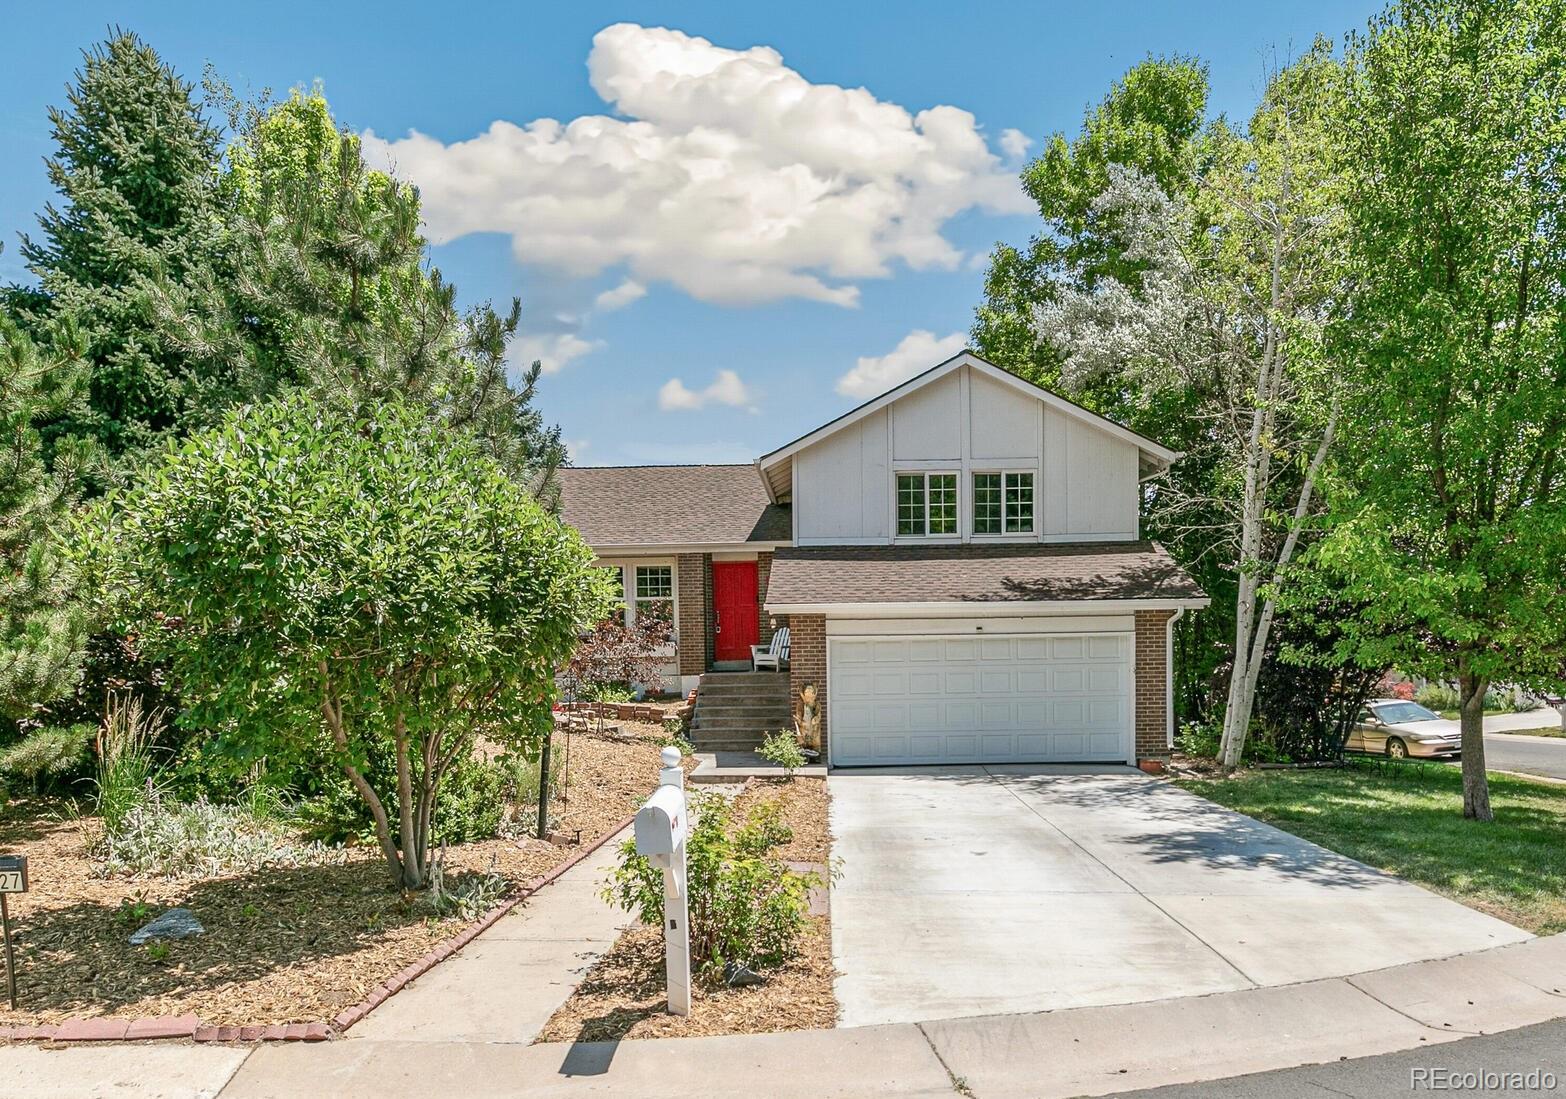
Active
$550,000
3
bds
|
2
ba
|
1,384
sqft
|
built
1934
4779 S Bannock St, Englewood, CO 80110
$-870
Cash flow
-8.3%
Cash-on-Cash Return
3.8%
Cap rate
0.5%
Rent to Value Ratio
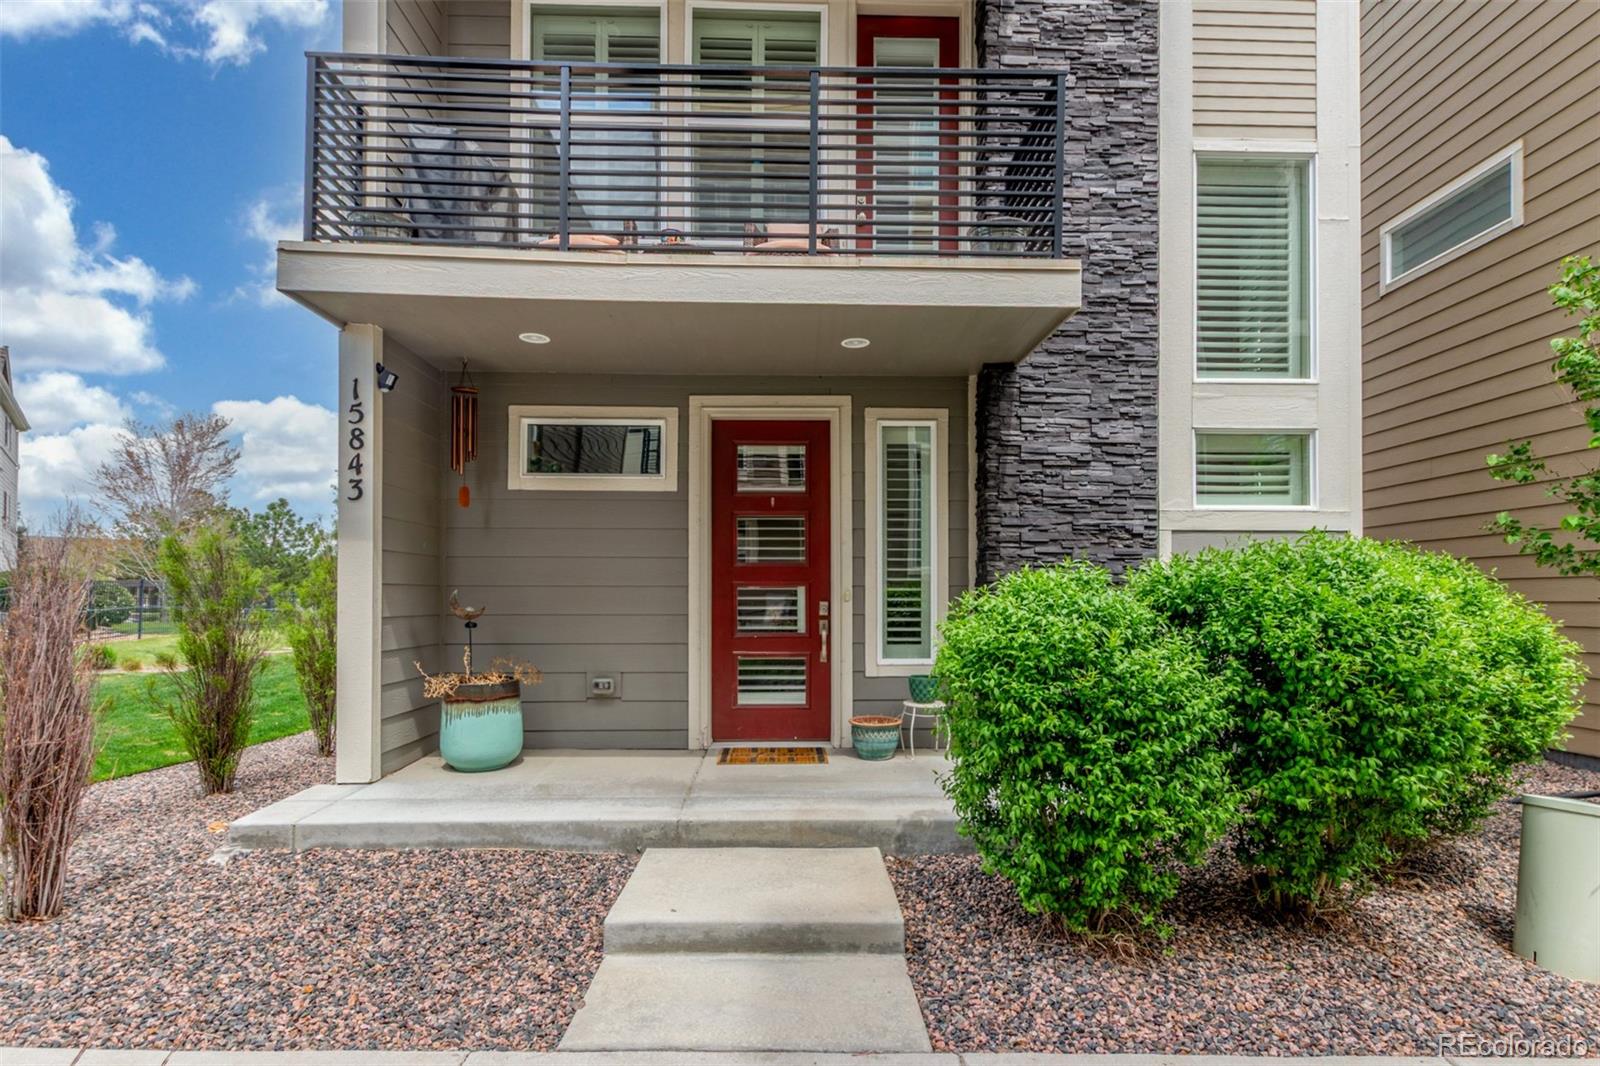
Active under contract
$600,000
2
bds
|
3
ba
|
1,760
sqft
|
built
2018
15843 E Broncos Pl, Englewood, CO 80112
$-853
Cash flow
-7.4%
Cash-on-Cash Return
4.0%
Cap rate
0.6%
Rent to Value Ratio
Active
$5,500,000
6
bds
|
7
ba
|
7,816
sqft
|
built
1989
7 Mockingbird Ln, Englewood, CO 80113
$-23,285
Cash flow
-22.1%
Cash-on-Cash Return
0.6%
Cap rate
0.1%
Rent to Value Ratio
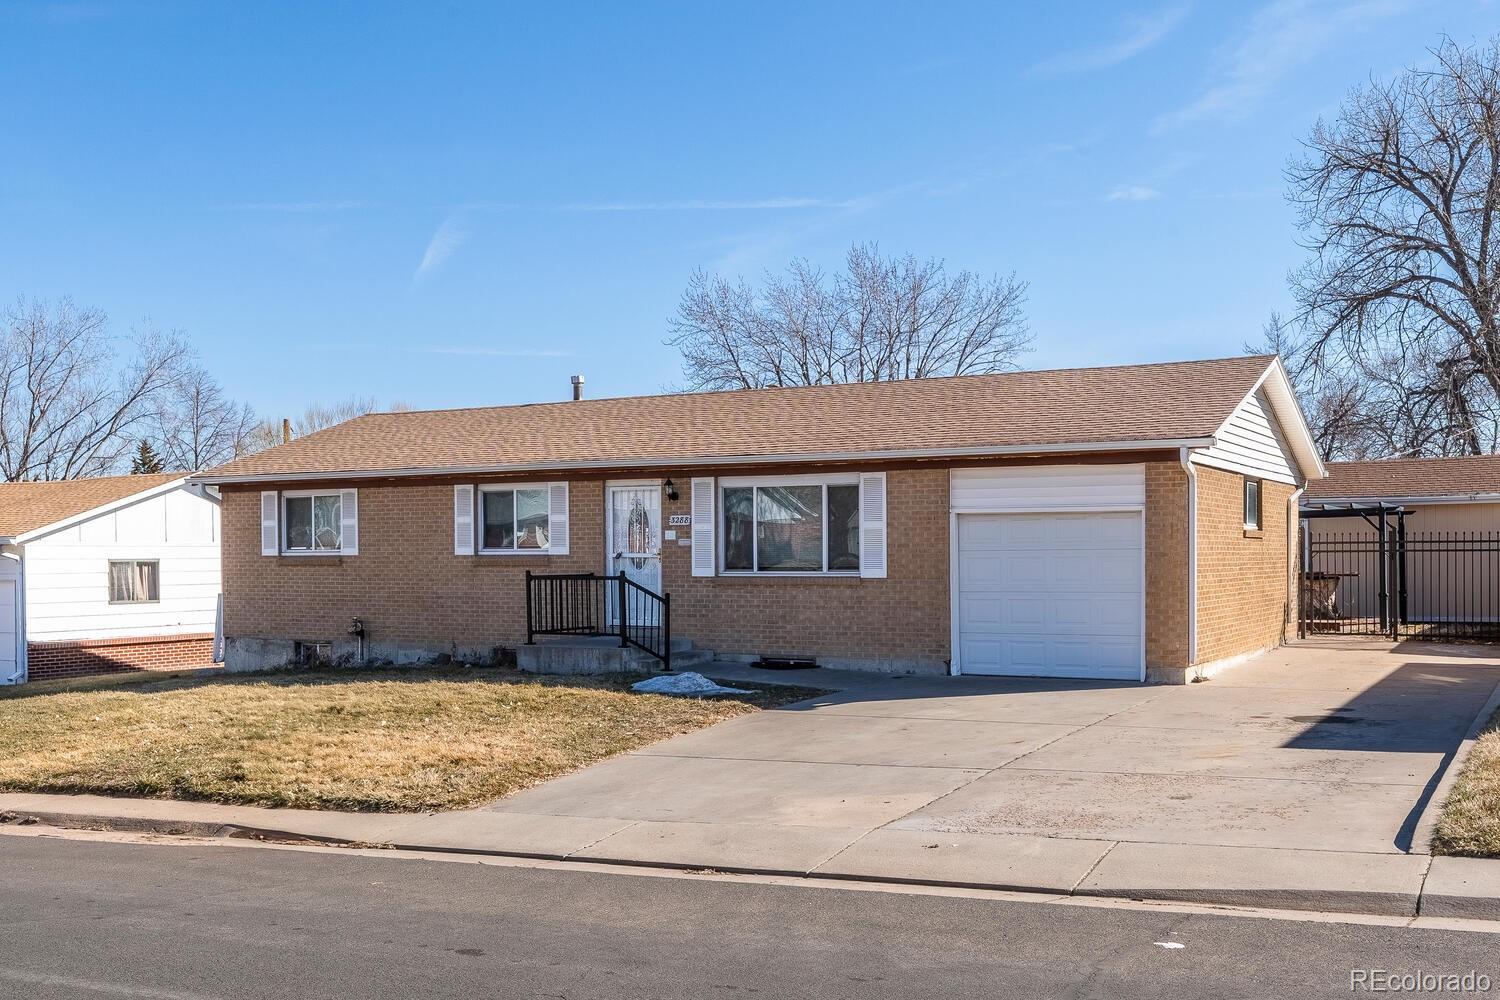
Active
$578,000
4
bds
|
2
ba
|
2,236
sqft
|
built
1959
3288 W Tufts Ave, Englewood, CO 80110
$-808
Cash flow
-7.3%
Cash-on-Cash Return
4.0%
Cap rate
0.5%
Rent to Value Ratio
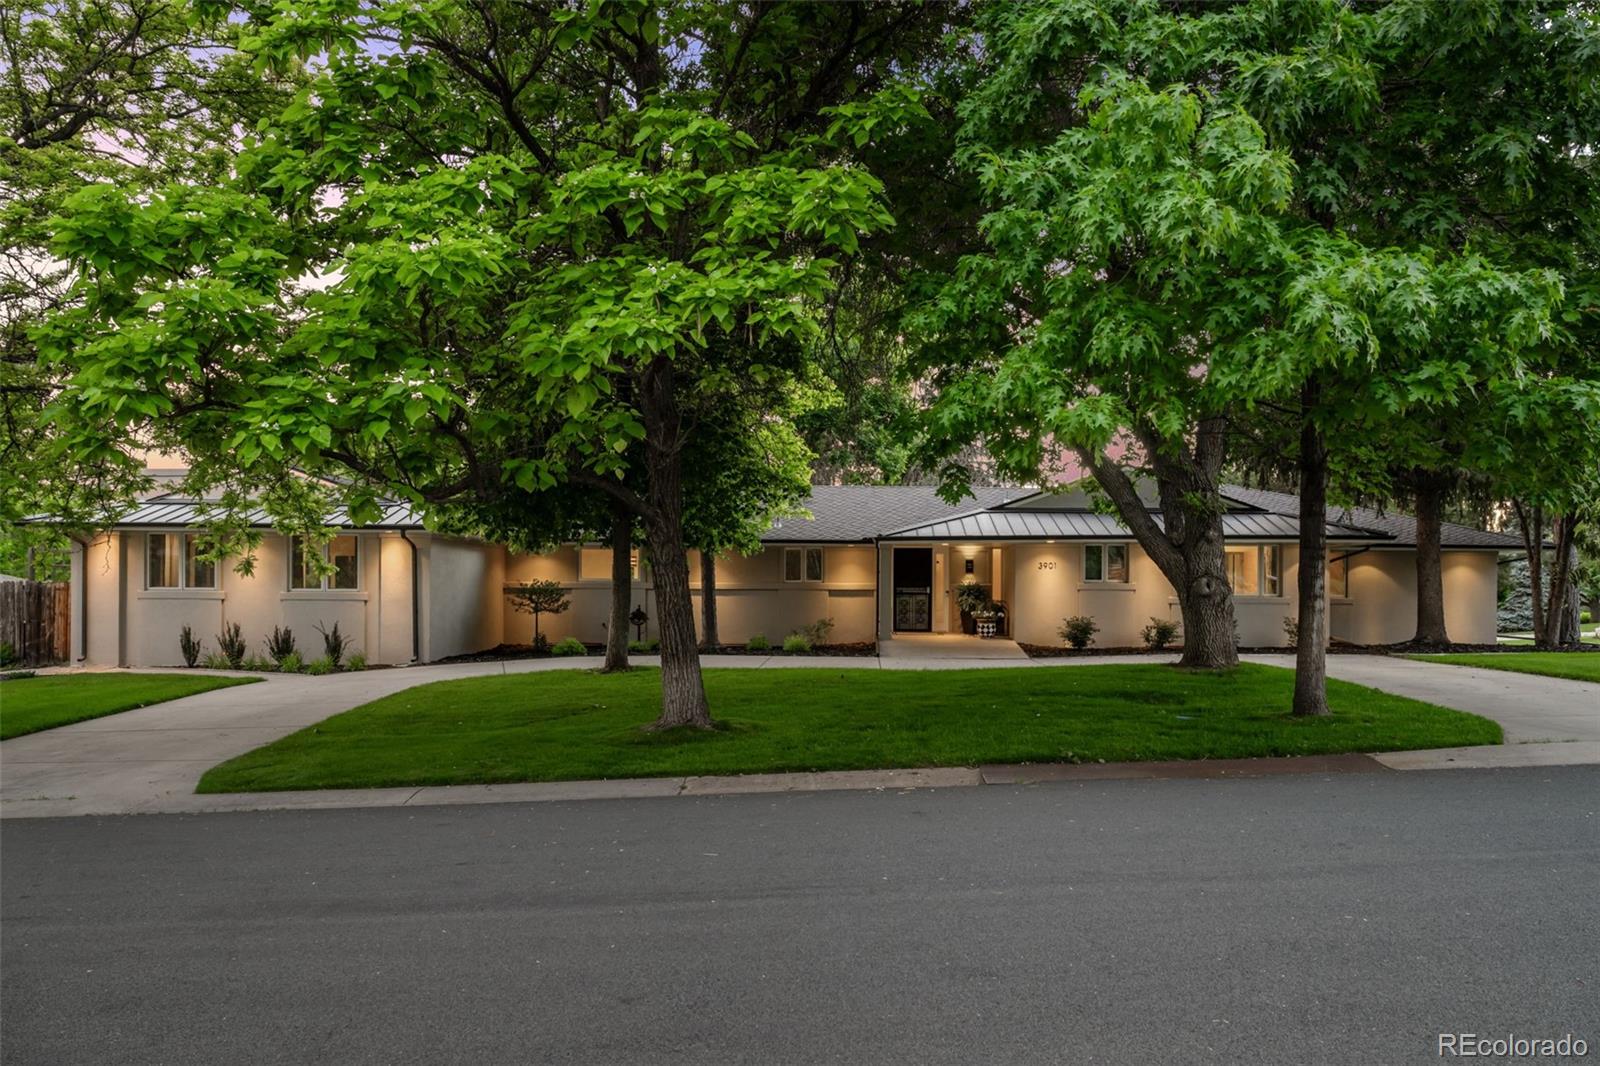
Active
$2,795,000
6
bds
|
7
ba
|
5,957
sqft
|
built
1988
3901 S Dexter St, Englewood, CO 80113
$-10,166
Cash flow
-19.0%
Cash-on-Cash Return
1.3%
Cap rate
0.2%
Rent to Value Ratio
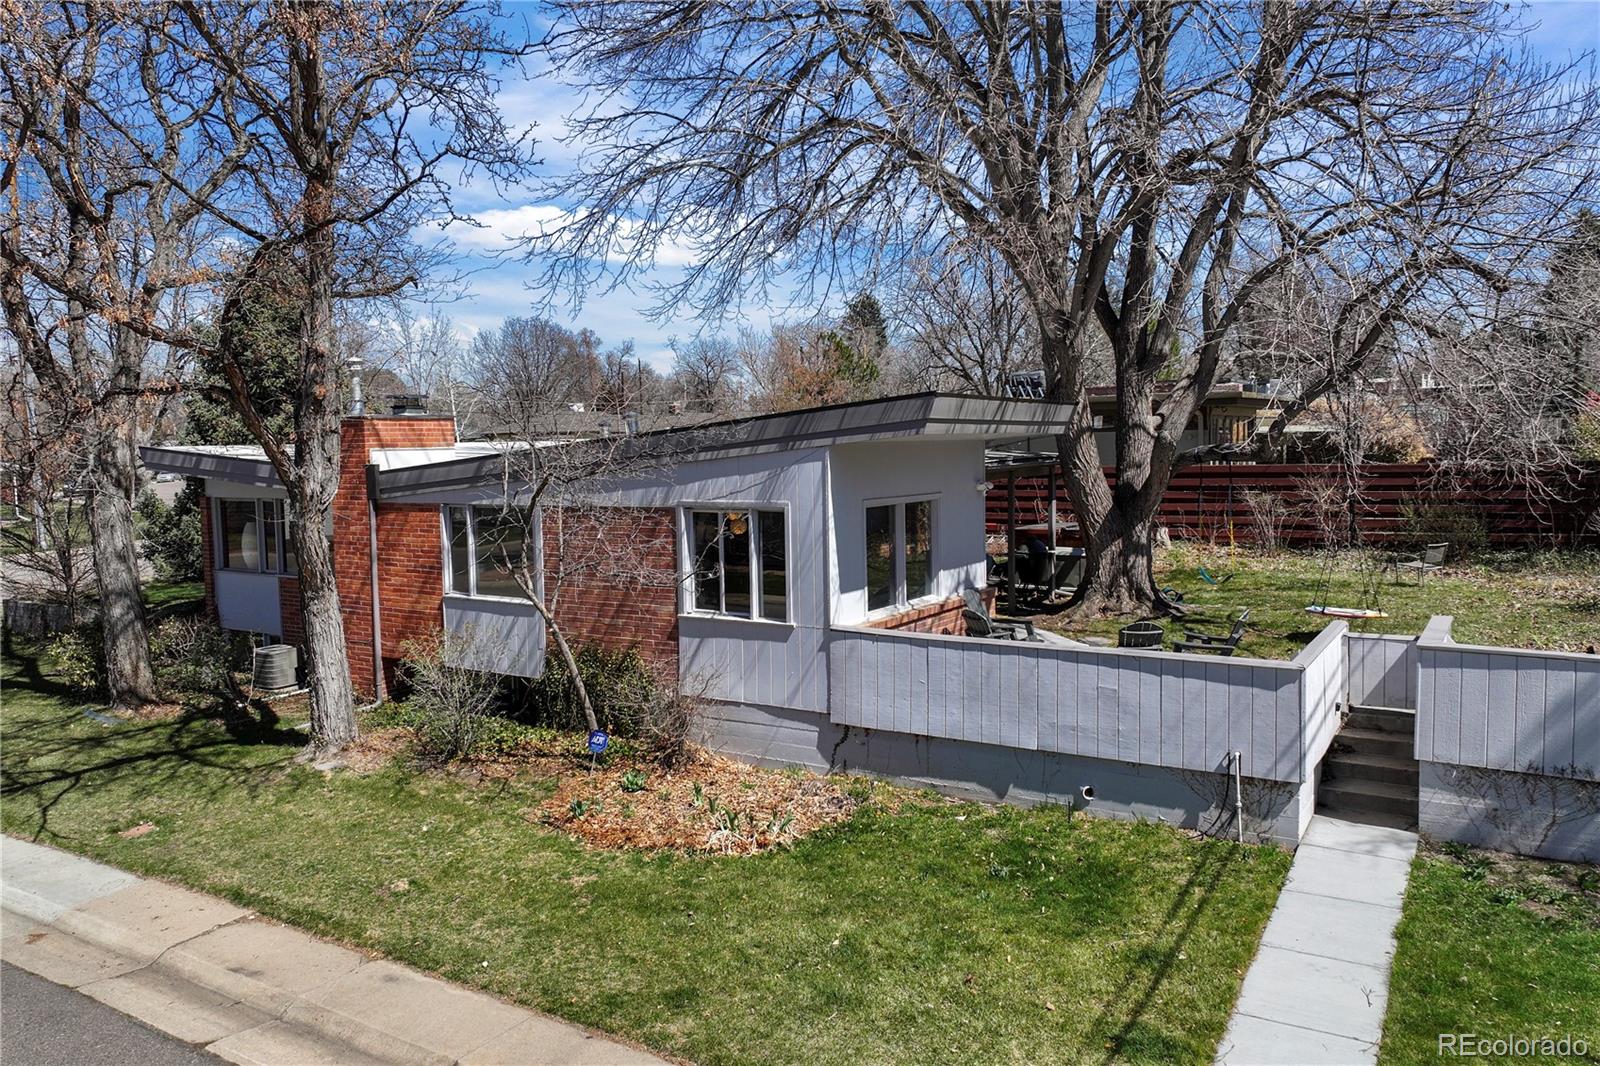
Active
$998,900
4
bds
|
3
ba
|
2,412
sqft
|
built
1951
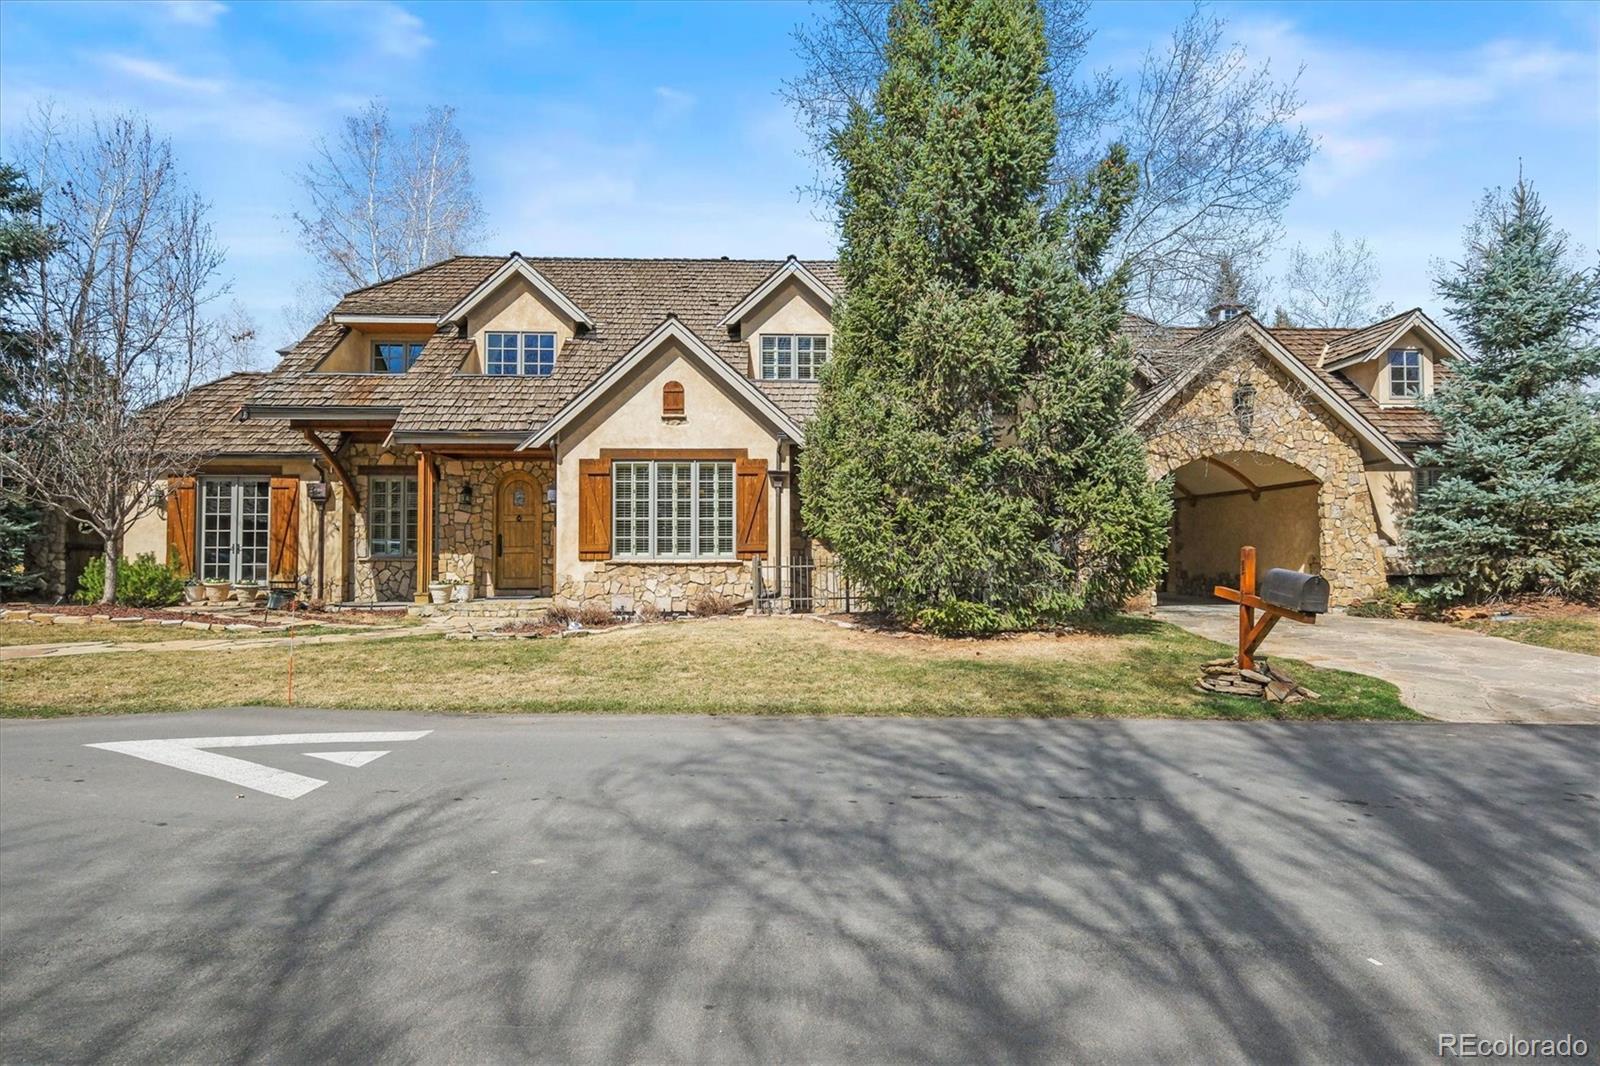
1400 E Bates Ave, Englewood, CO 80113
$-2,407
Cash flow
-12.6%
Cash-on-Cash Return
2.8%
Cap rate
0.4%
Rent to Value Ratio
Active
$339,900
1
bds
|
1
ba
|
696
sqft
|
built
1955
3101 W Jefferson Ave, Englewood, CO 80110
$-382
Cash flow
-5.9%
Cash-on-Cash Return
4.3%
Cap rate
0.6%
Rent to Value Ratio
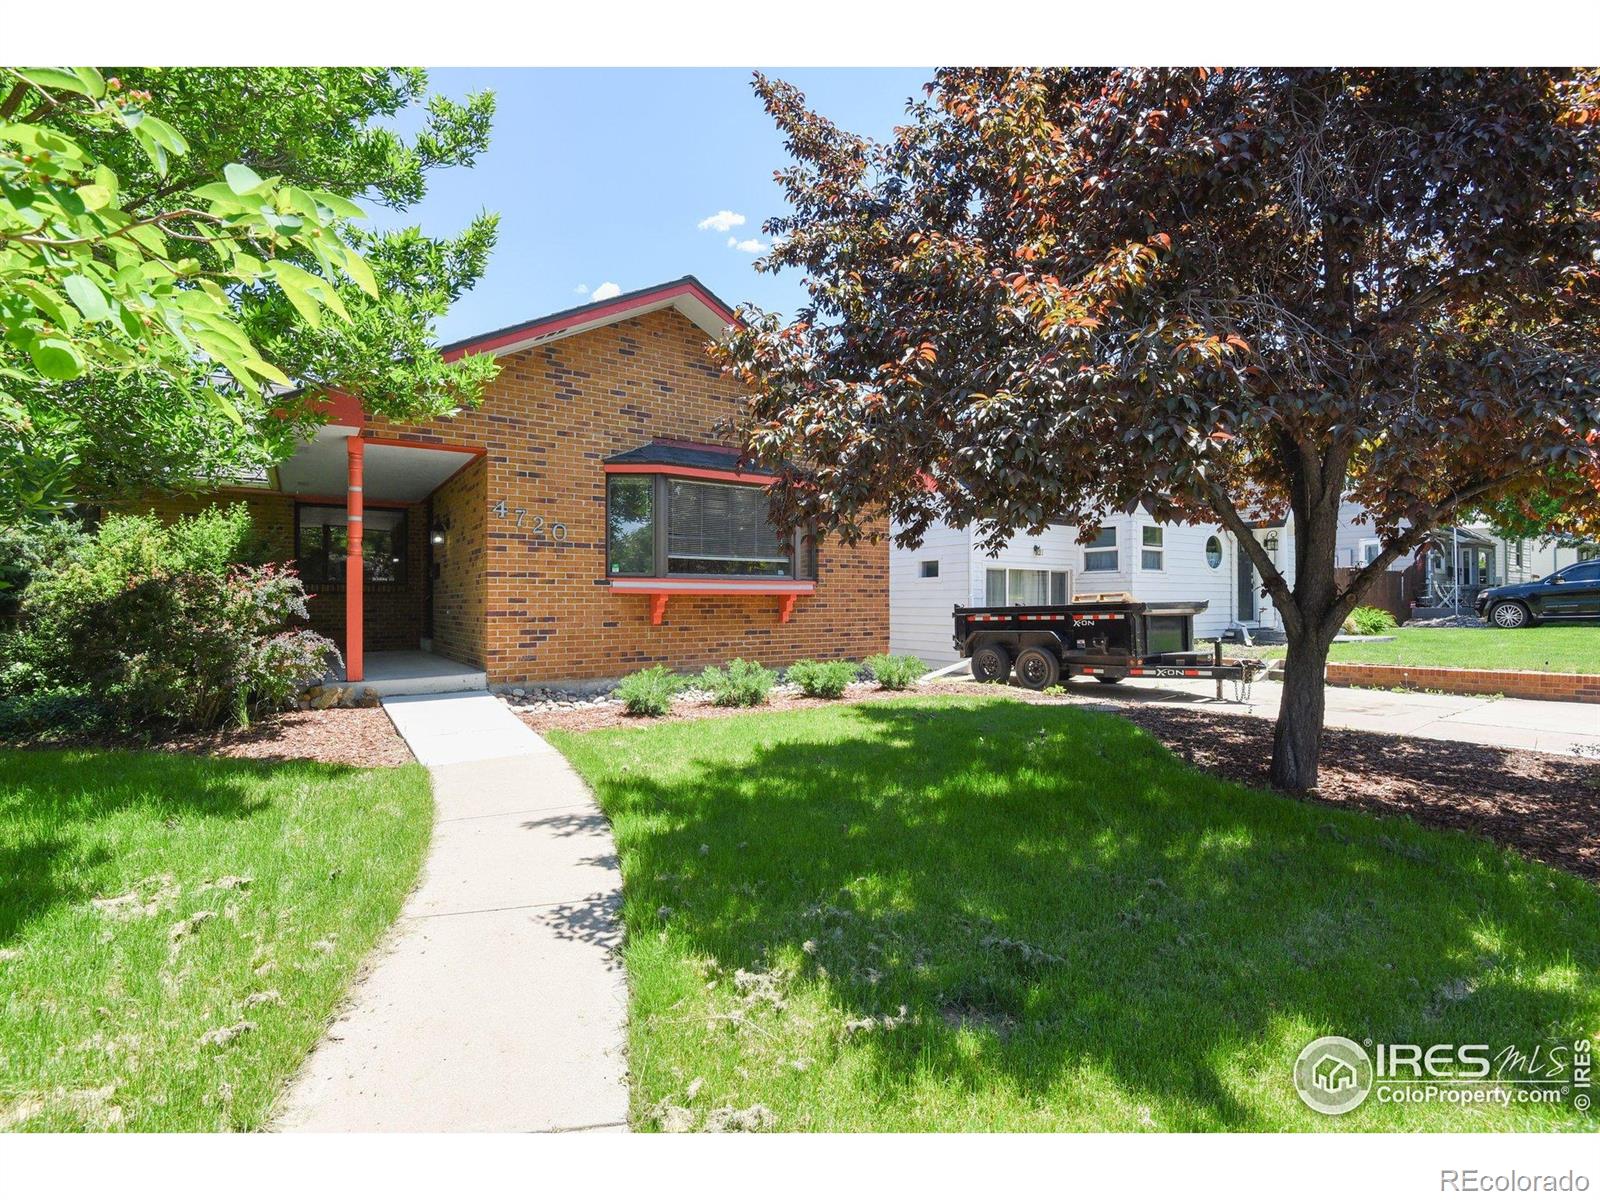
Active
$635,000
4
bds
|
2
ba
|
2,500
sqft
|
built
1984
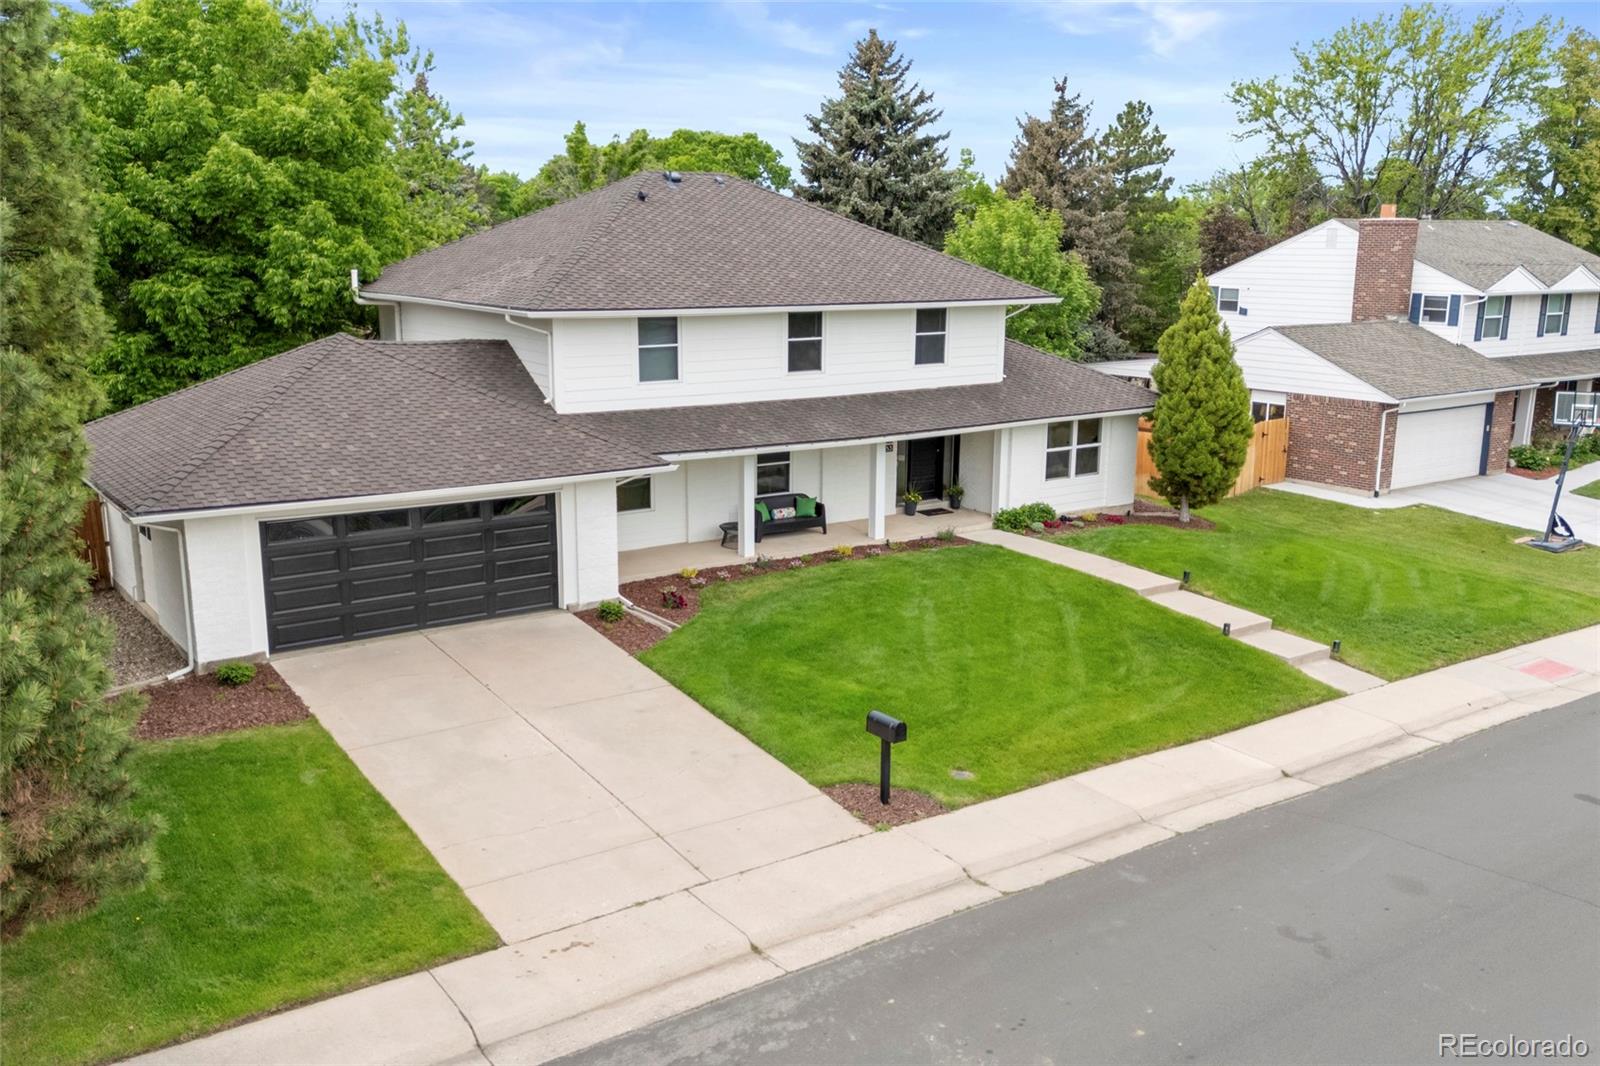
4720 S Grant St, Englewood, CO 80113
$-1,313
Cash flow
-10.8%
Cash-on-Cash Return
3.2%
Cap rate
0.4%
Rent to Value Ratio
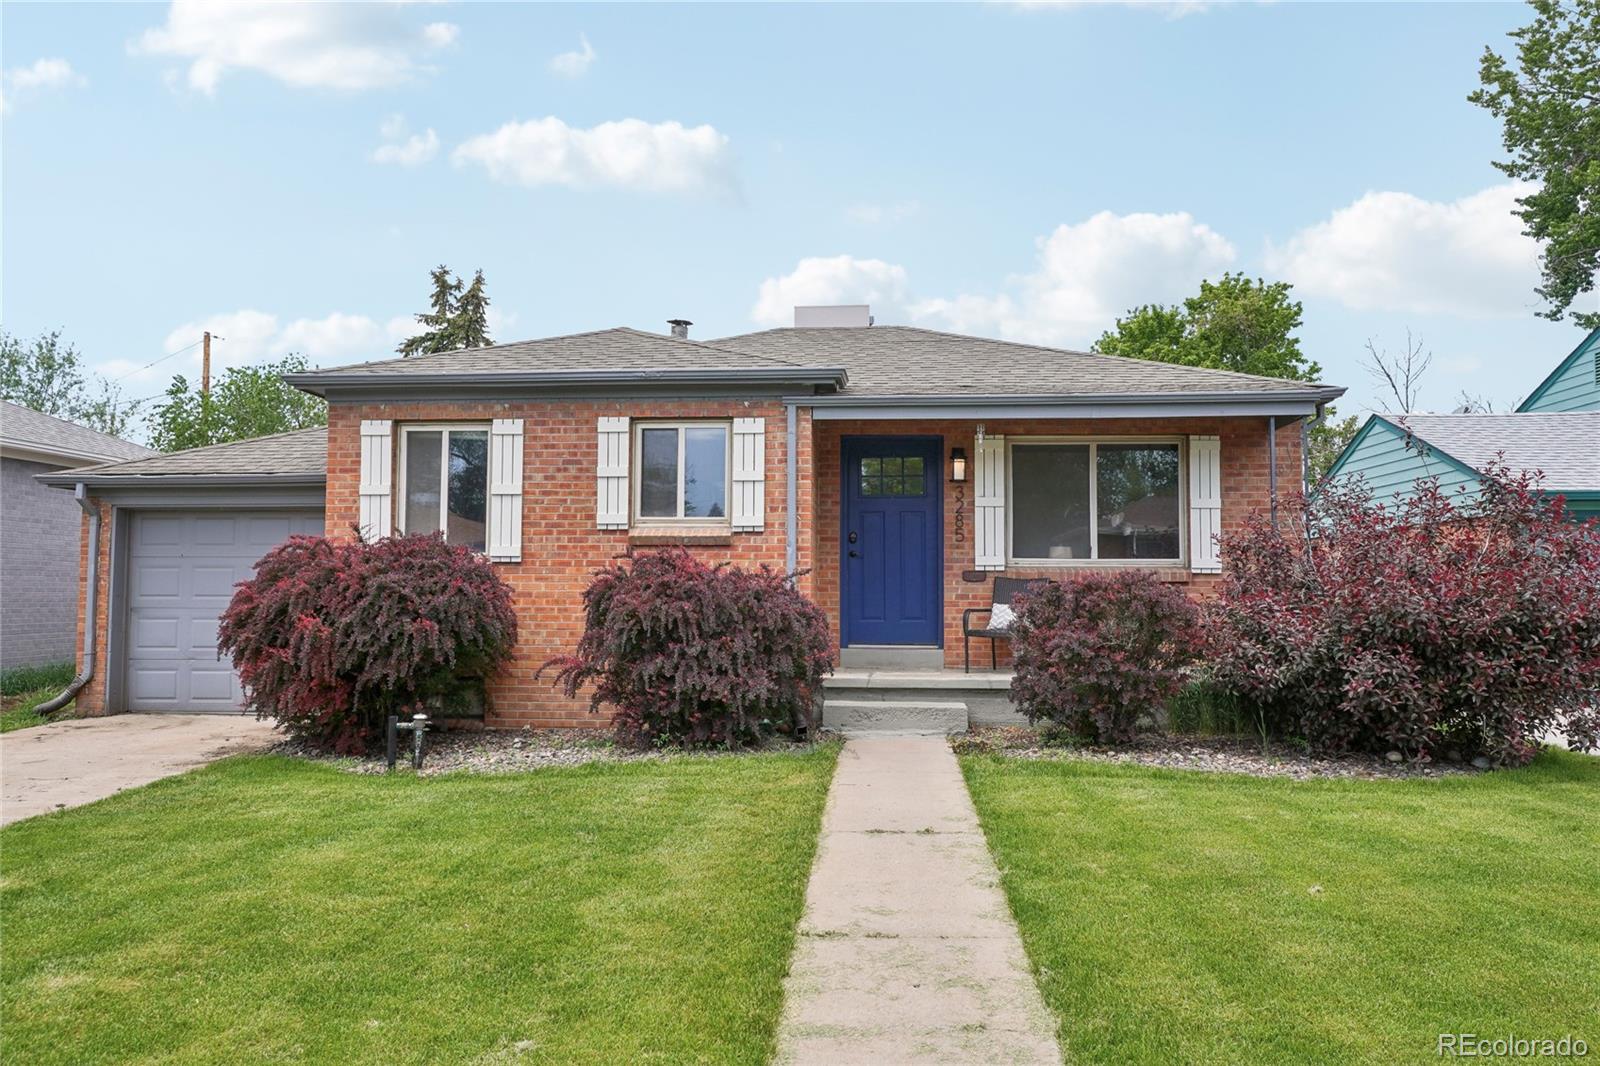
Active
$625,000
3
bds
|
2
ba
|
1,530
sqft
|
built
1951
3285 S Delaware St, Englewood, CO 80110
$-810
Cash flow
-6.8%
Cash-on-Cash Return
4.1%
Cap rate
0.6%
Rent to Value Ratio
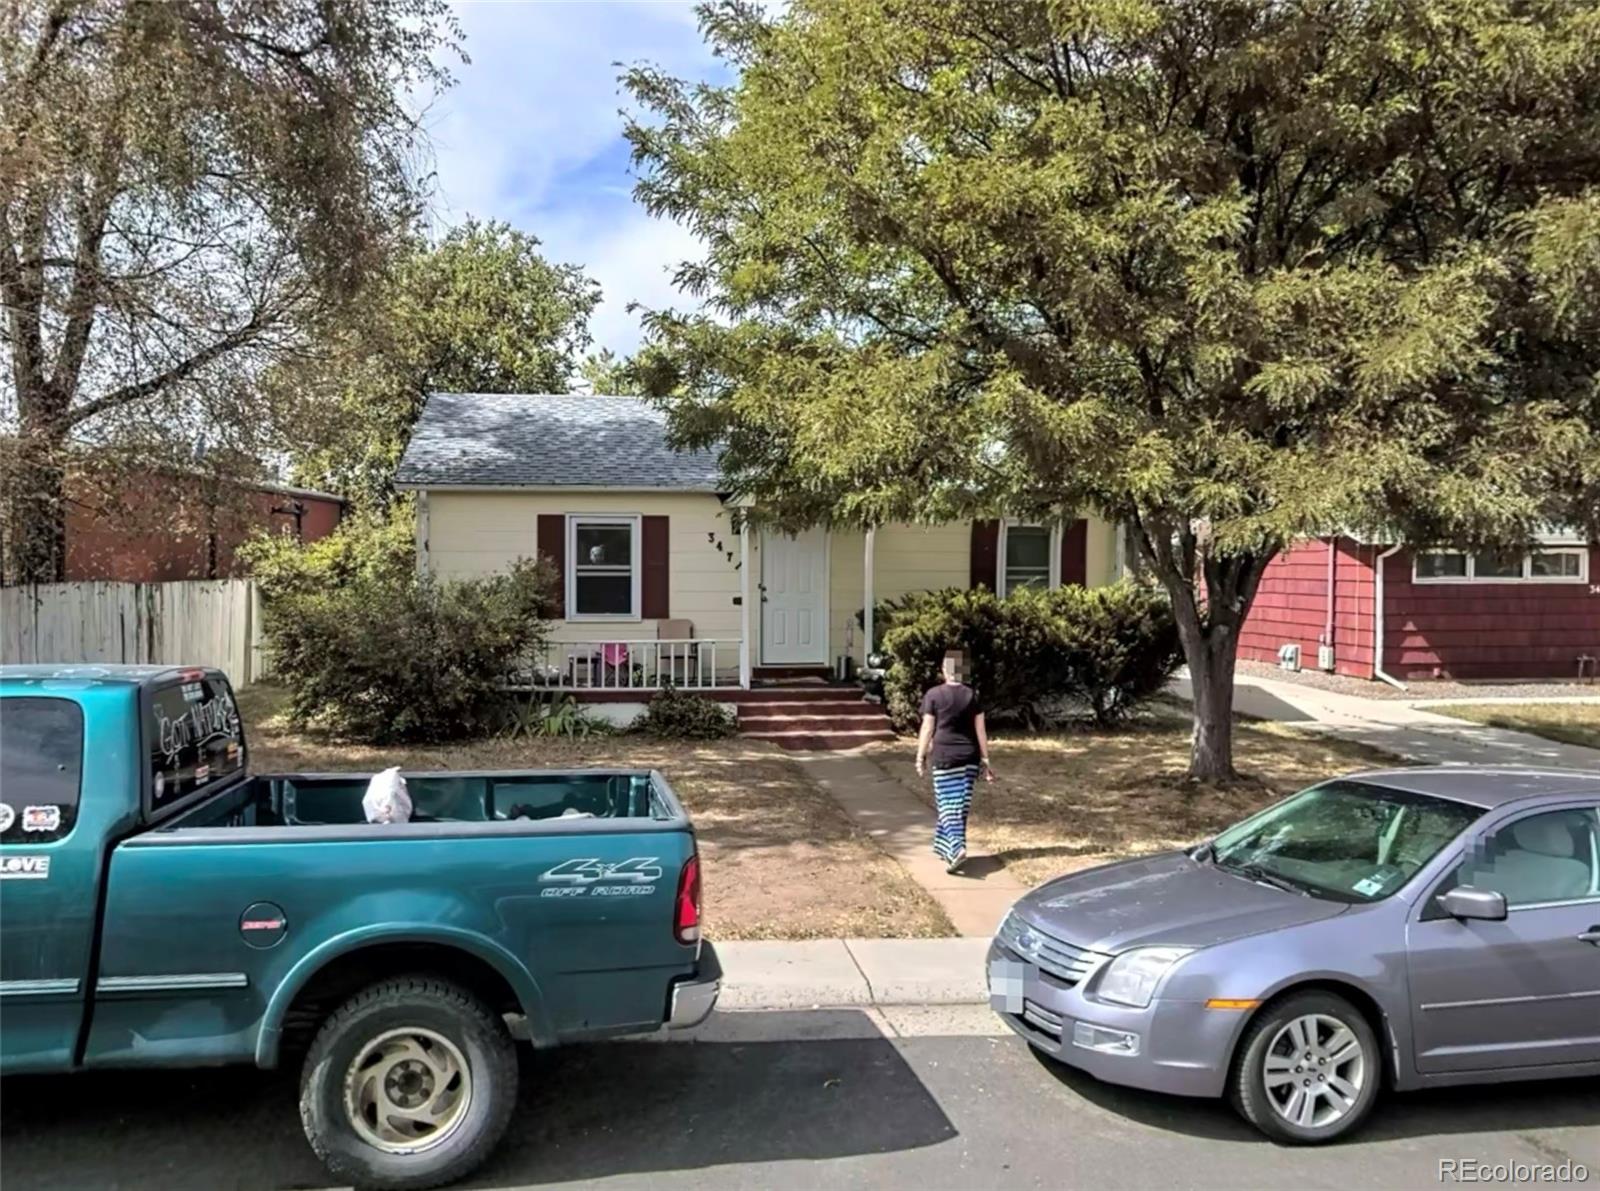
Active
$599,000
4
bds
|
2
ba
|
1,536
sqft
|
built
1950
3477 S Marion St, Englewood, CO 80113
$-1,604
Cash flow
-14.0%
Cash-on-Cash Return
2.5%
Cap rate
0.3%
Rent to Value Ratio

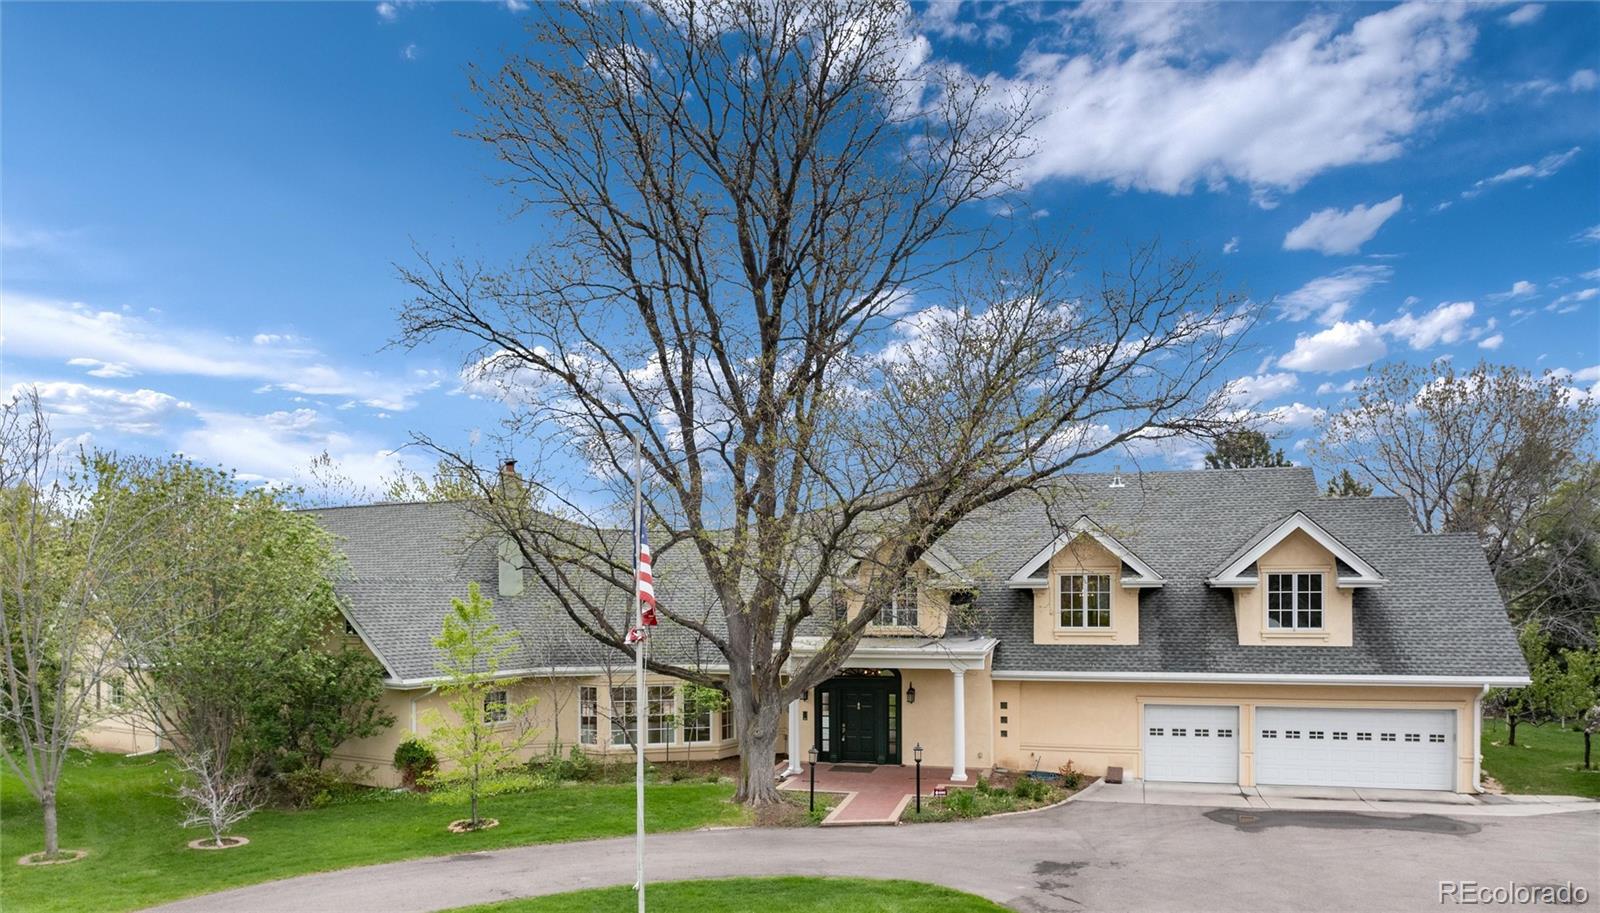
Active
$1,189,900
5
bds
|
4
ba
|
3,411
sqft
|
built
2022
3261 S Sherman St, Englewood, CO 80113
$-2,681
Cash flow
-11.8%
Cash-on-Cash Return
3.0%
Cap rate
0.4%
Rent to Value Ratio
Active
$4,750,000
5
bds
|
5
ba
|
7,229
sqft
|
built
1977
4800 S Franklin St, Englewood, CO 80113
$-19,115
Cash flow
-21.0%
Cash-on-Cash Return
0.8%
Cap rate
0.2%
Rent to Value Ratio
Active
$635,000
3
bds
|
2
ba
|
1,507
sqft
|
built
1947
4197 S Grant St, Englewood, CO 80113
$-1,235
Cash flow
-10.1%
Cash-on-Cash Return
3.3%
Cap rate
0.5%
Rent to Value Ratio
Active
$4,995,000
6
bds
|
8
ba
|
8,874
sqft
|
built
2003
1075 E Oxford Ln, Englewood, CO 80113
$-20,286
Cash flow
-21.2%
Cash-on-Cash Return
0.8%
Cap rate
0.2%
Rent to Value Ratio
Active
$500,000
2
bds
|
1
ba
|
1,116
sqft
|
built
1947
4389 S Sherman St, Englewood, CO 80113
$-829
Cash flow
-8.7%
Cash-on-Cash Return
3.7%
Cap rate
0.5%
Rent to Value Ratio
Active
$1,795,000
6
bds
|
4
ba
|
6,421
sqft
|
built
1979
10601 E Crestline Ave, Englewood, CO 80111
$-6,168
Cash flow
-17.9%
Cash-on-Cash Return
1.6%
Cap rate
0.3%
Rent to Value Ratio
Active
$750,000
4
bds
|
3
ba
|
2,764
sqft
|
built
1980
10365 E Weaver Cir, Englewood, CO 80111
$-1,515
Cash flow
-10.5%
Cash-on-Cash Return
3.3%
Cap rate
0.5%
Rent to Value Ratio
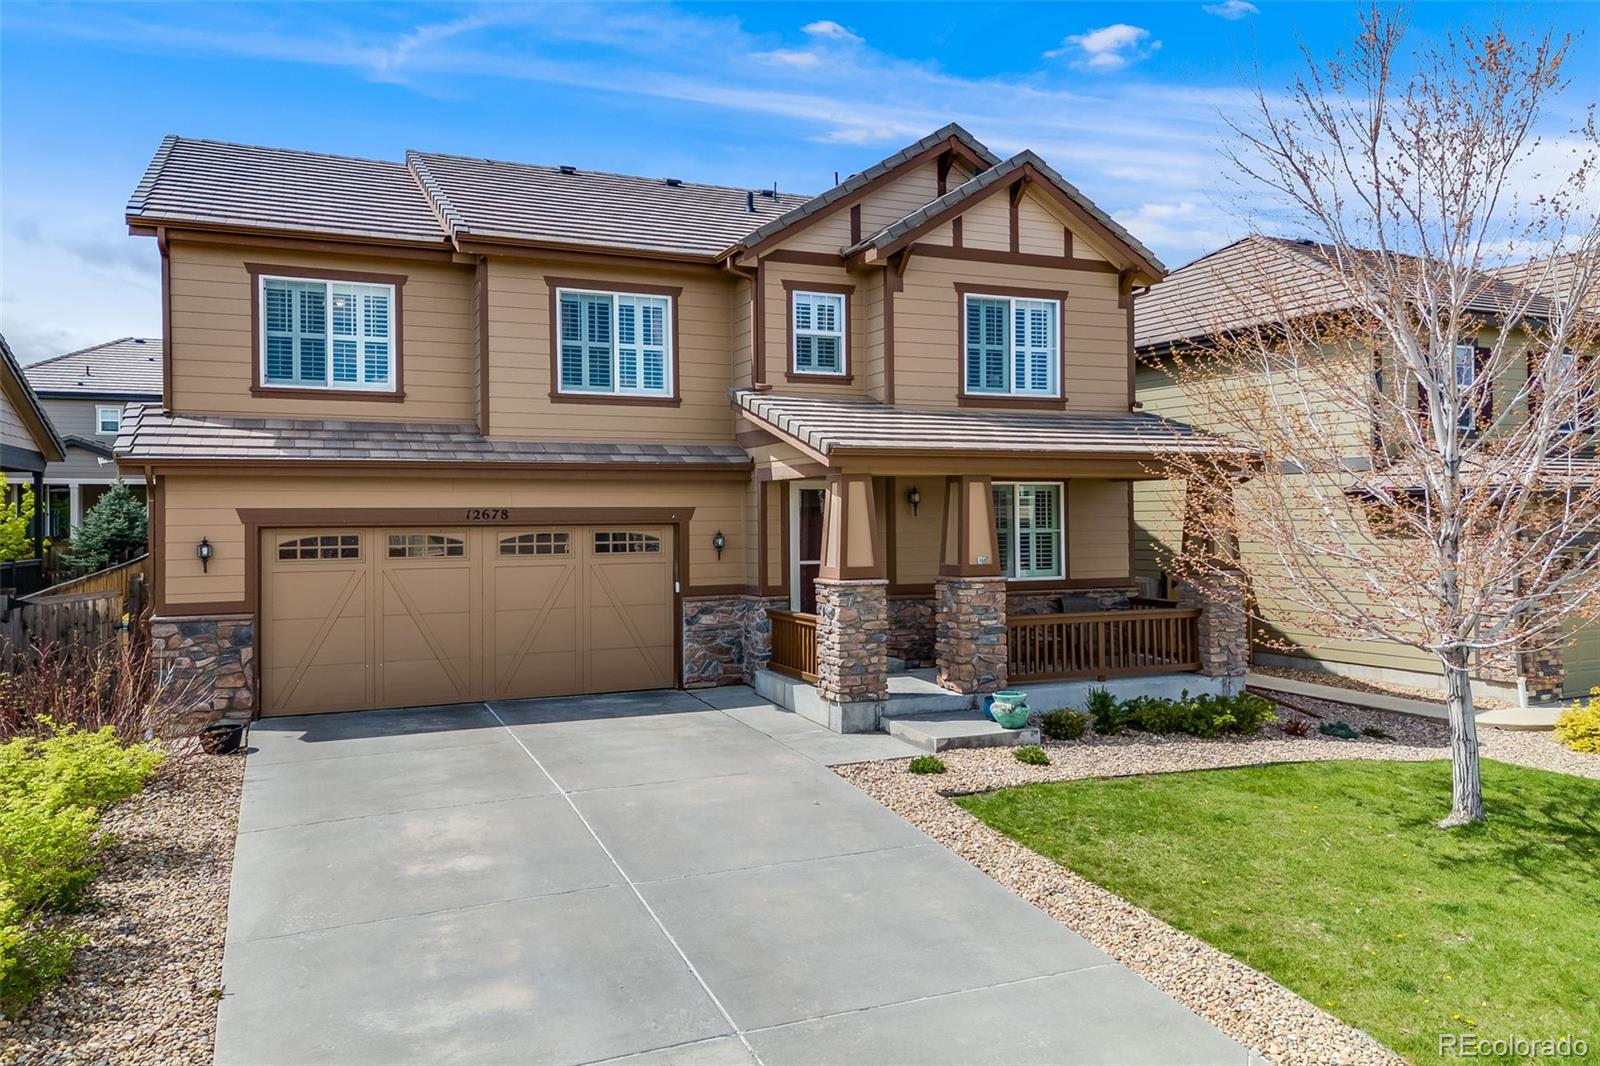
Active
$725,000
4
bds
|
3
ba
|
2,714
sqft
|
built
2015
12678 Fisher Ln, Englewood, CO 80112
$-1,542
Cash flow
-11.1%
Cash-on-Cash Return
3.1%
Cap rate
0.5%
Rent to Value Ratio
Active
$499,000
4
bds
|
2
ba
|
1,506
sqft
|
built
1930
4595 S Lincoln St, Englewood, CO 80113
$-816
Cash flow
-8.5%
Cash-on-Cash Return
3.7%
Cap rate
0.5%
Rent to Value Ratio
Active
$3,495,000
6
bds
|
7
ba
|
8,335
sqft
|
built
1994
101 Glenmoor Ln, Englewood, CO 80113
$-14,437
Cash flow
-21.6%
Cash-on-Cash Return
0.7%
Cap rate
0.2%
Rent to Value Ratio
Active
$3,695,000
6
bds
|
6
ba
|
6,319
sqft
|
built
2003
1 Gooseberry Ln, Englewood, CO 80113
$-15,494
Cash flow
-21.9%
Cash-on-Cash Return
0.6%
Cap rate
0.2%
Rent to Value Ratio
Active
$539,000
3
bds
|
2
ba
|
1,648
sqft
|
built
1920
3780 S Cherokee St, Englewood, CO 80110
$-1,026
Cash flow
-9.9%
Cash-on-Cash Return
3.4%
Cap rate
0.5%
Rent to Value Ratio
Active
$1,325,000
5
bds
|
4
ba
|
3,496
sqft
|
built
1973
5853 S Havana Ct, Englewood, CO 80111
$-2,275
Cash flow
-9.0%
Cash-on-Cash Return
3.6%
Cap rate
0.5%
Rent to Value Ratio
Active
$1,245,000
5
bds
|
4
ba
|
3,655
sqft
|
built
1980
10886 E Crestline Cir, Englewood, CO 80111
$-2,621
Cash flow
-11.0%
Cash-on-Cash Return
3.2%
Cap rate
0.5%
Rent to Value Ratio
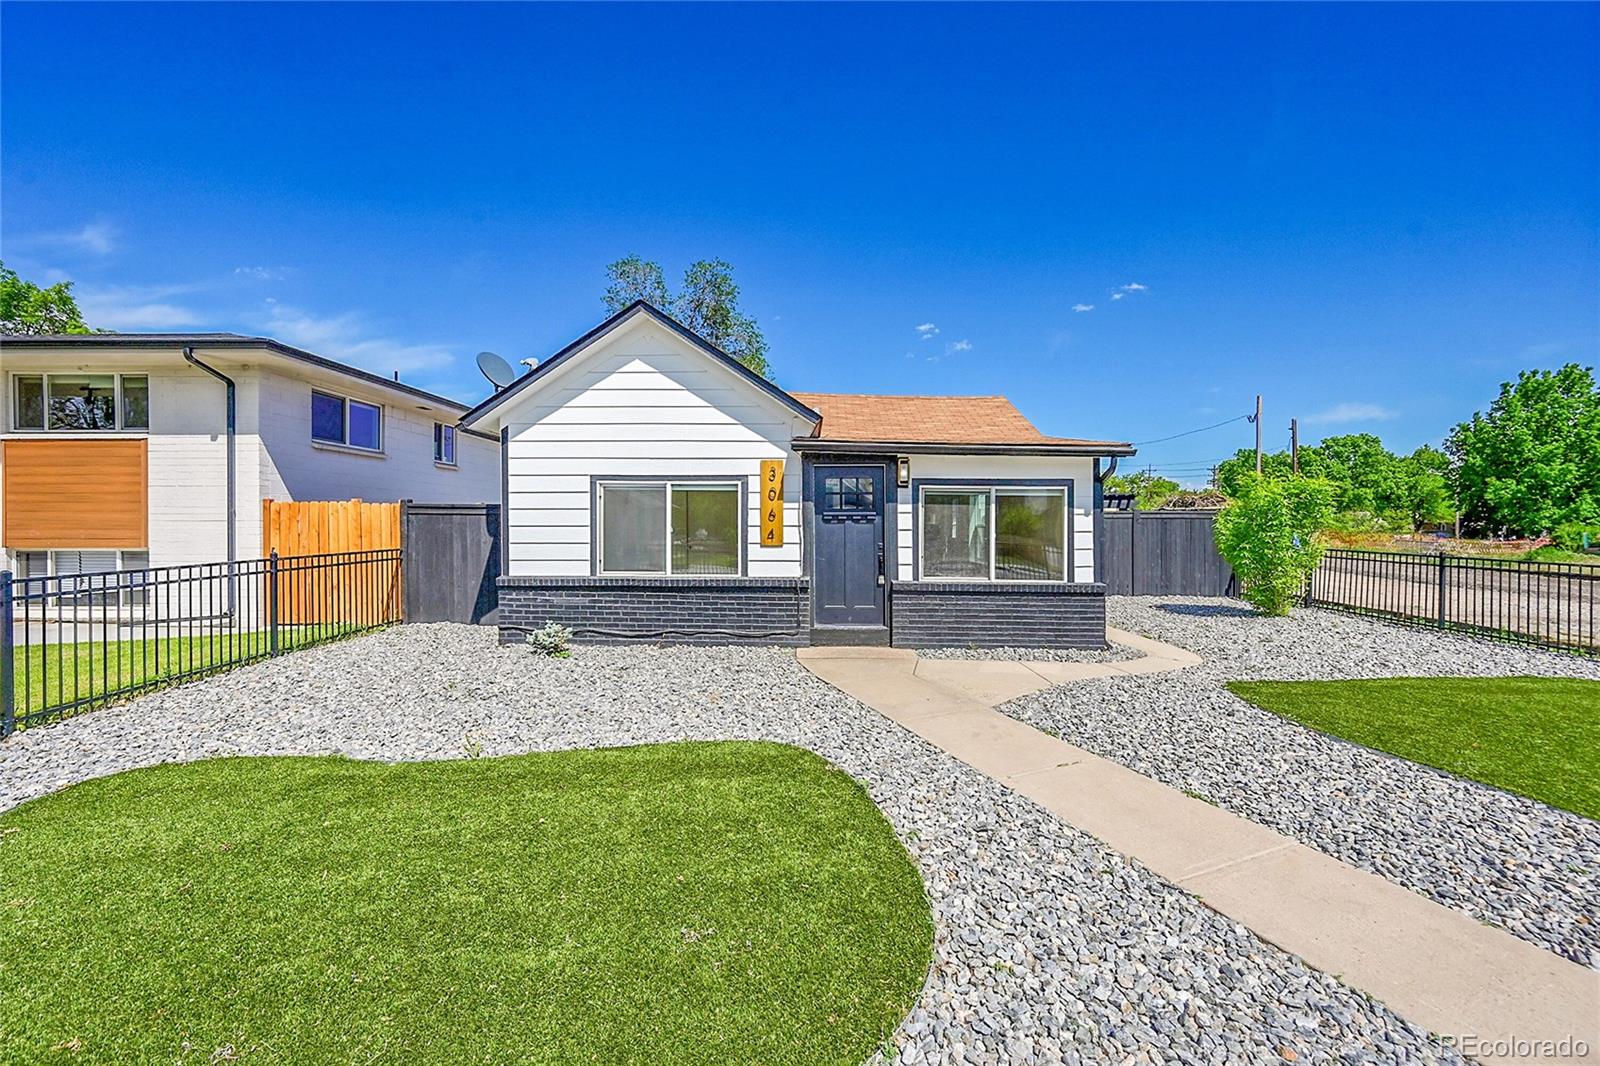
Active
$464,900
3
bds
|
1
ba
|
864
sqft
|
built
1910
3064 S Galapago St, Englewood, CO 80110
$-598
Cash flow
-6.7%
Cash-on-Cash Return
4.1%
Cap rate
0.6%
Rent to Value Ratio
Active
$785,000
5
bds
|
3
ba
|
2,052
sqft
|
built
1954
3177 S Grant St, Englewood, CO 80113
$-1,652
Cash flow
-11.0%
Cash-on-Cash Return
3.2%
Cap rate
0.4%
Rent to Value Ratio
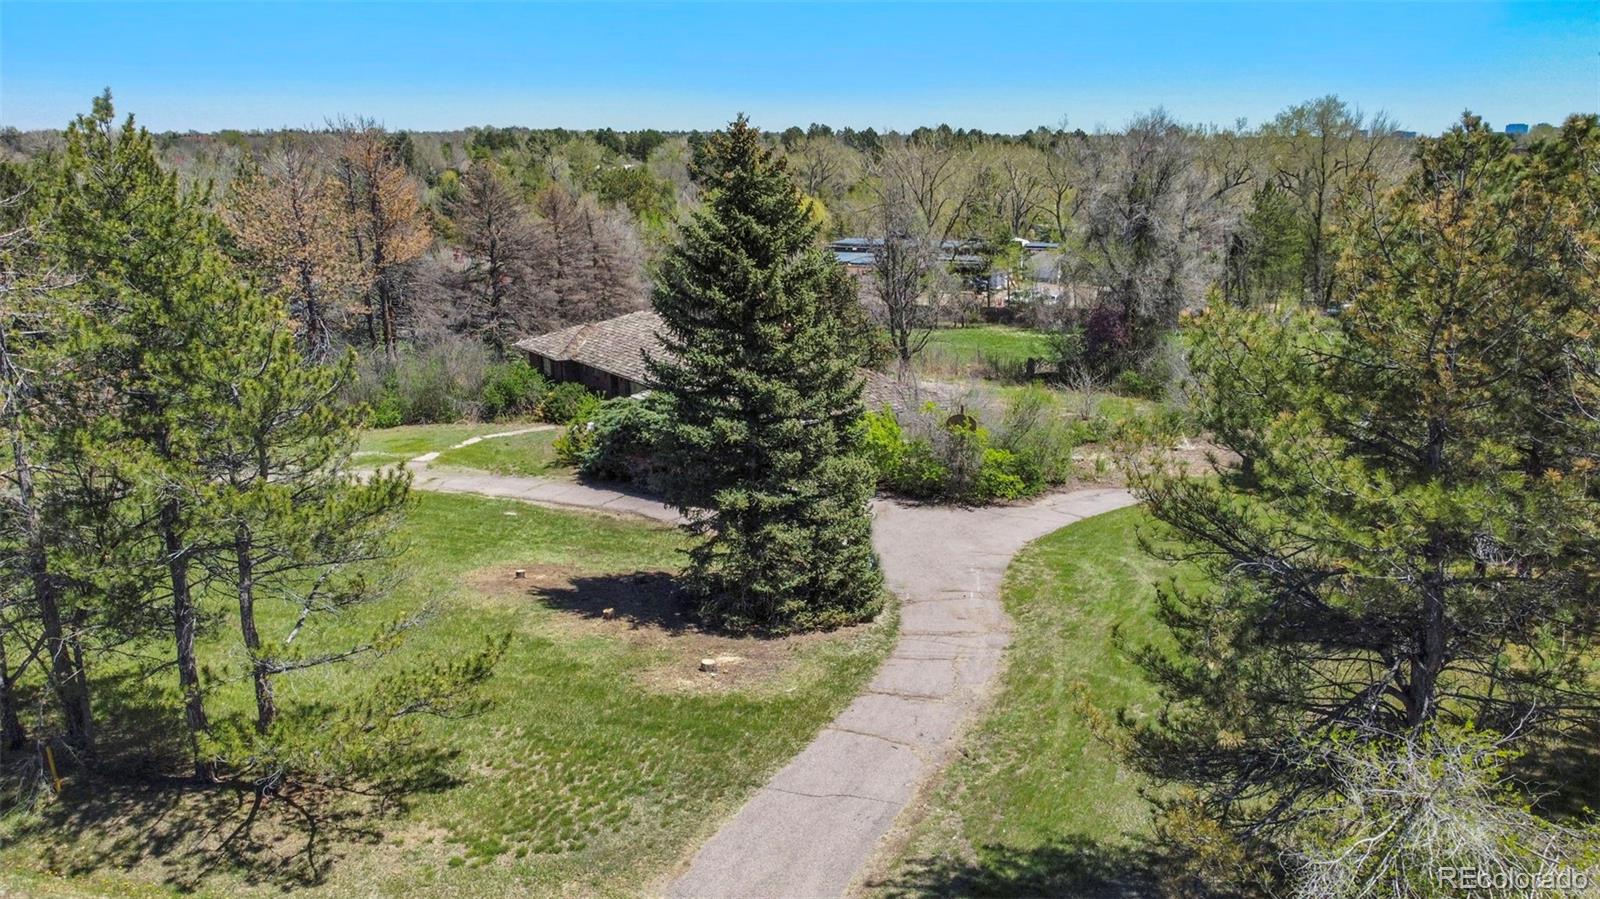
Active
$5,735,000
3
bds
|
3
ba
|
2,373
sqft
|
built
1963
4480 S Franklin St, Englewood, CO 80113
$-25,019
Cash flow
-22.8%
Cash-on-Cash Return
0.4%
Cap rate
0.1%
Rent to Value Ratio
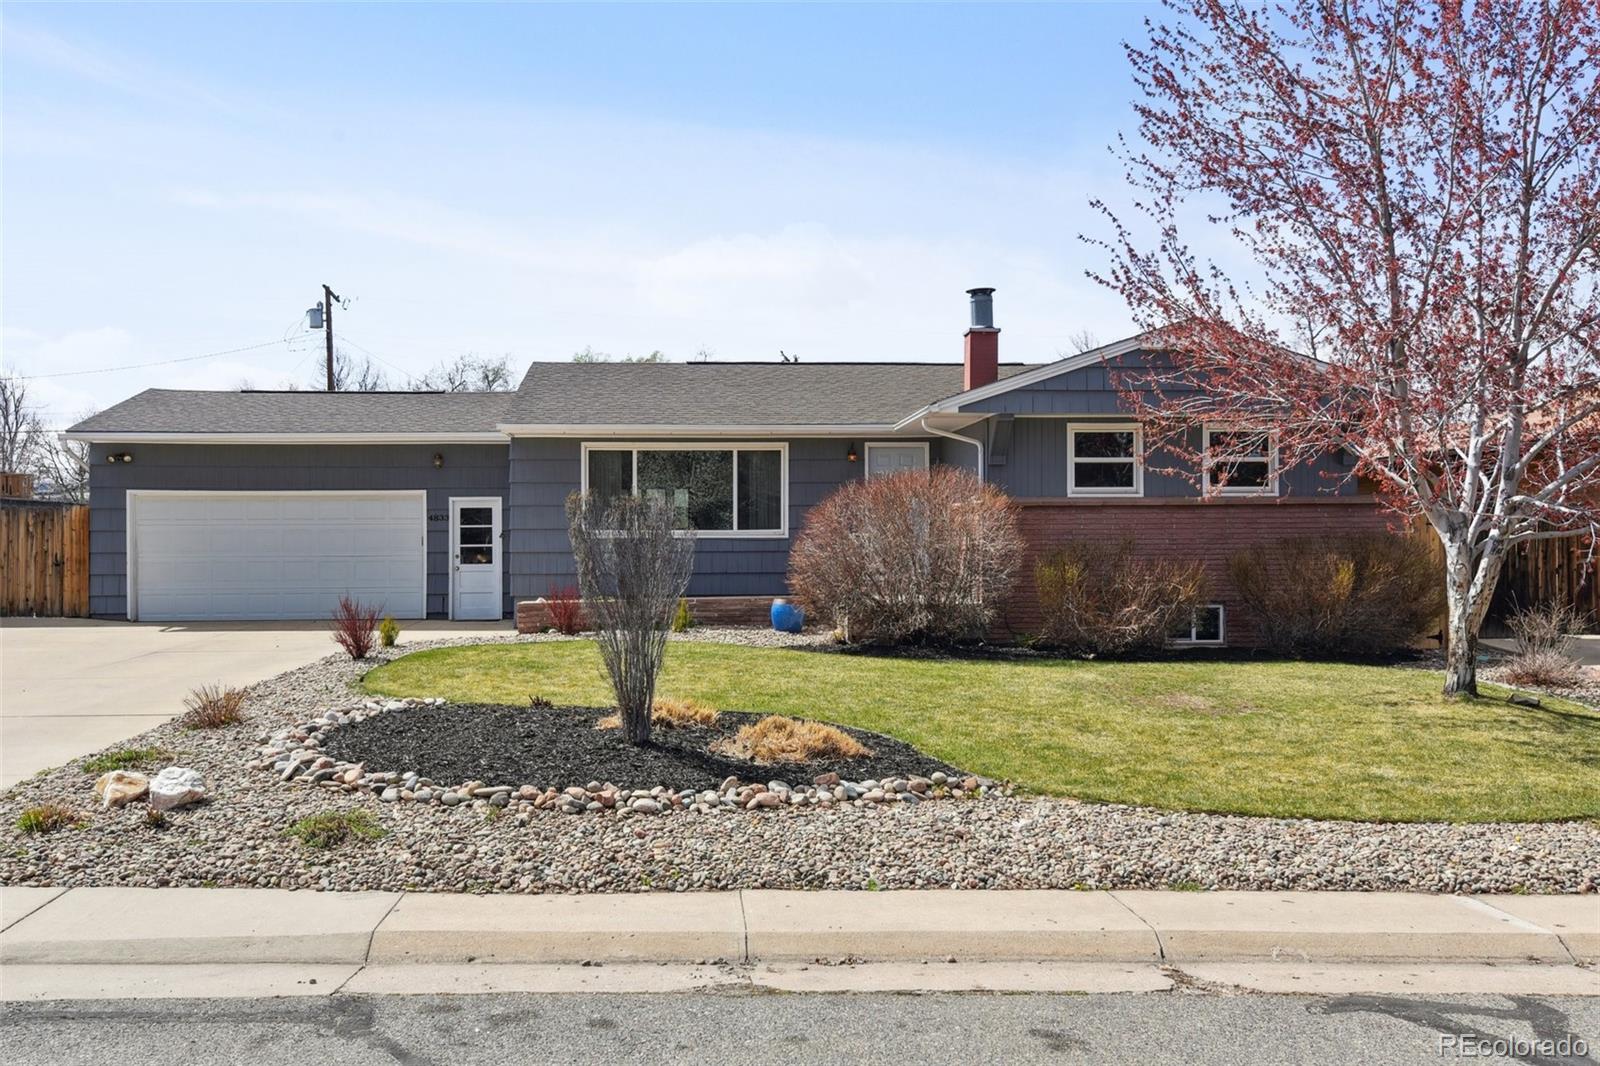
Active
$630,000
4
bds
|
2
ba
|
2,256
sqft
|
built
1956
4833 S Elati St, Englewood, CO 80110
$-1,101
Cash flow
-9.1%
Cash-on-Cash Return
3.6%
Cap rate
0.5%
Rent to Value Ratio
Active
$600,000
3
bds
|
2
ba
|
1,008
sqft
|
built
1936
3175 S Pennsylvania St, Englewood, CO 80113
$-1,171
Cash flow
-10.2%
Cash-on-Cash Return
3.3%
Cap rate
0.5%
Rent to Value Ratio
Pending
$700,000
4
bds
|
4
ba
|
2,386
sqft
|
built
1977
6327 S Emporia Cir, Englewood, CO 80111
$-1,465
Cash flow
-10.9%
Cash-on-Cash Return
3.2%
Cap rate
0.5%
Rent to Value Ratio
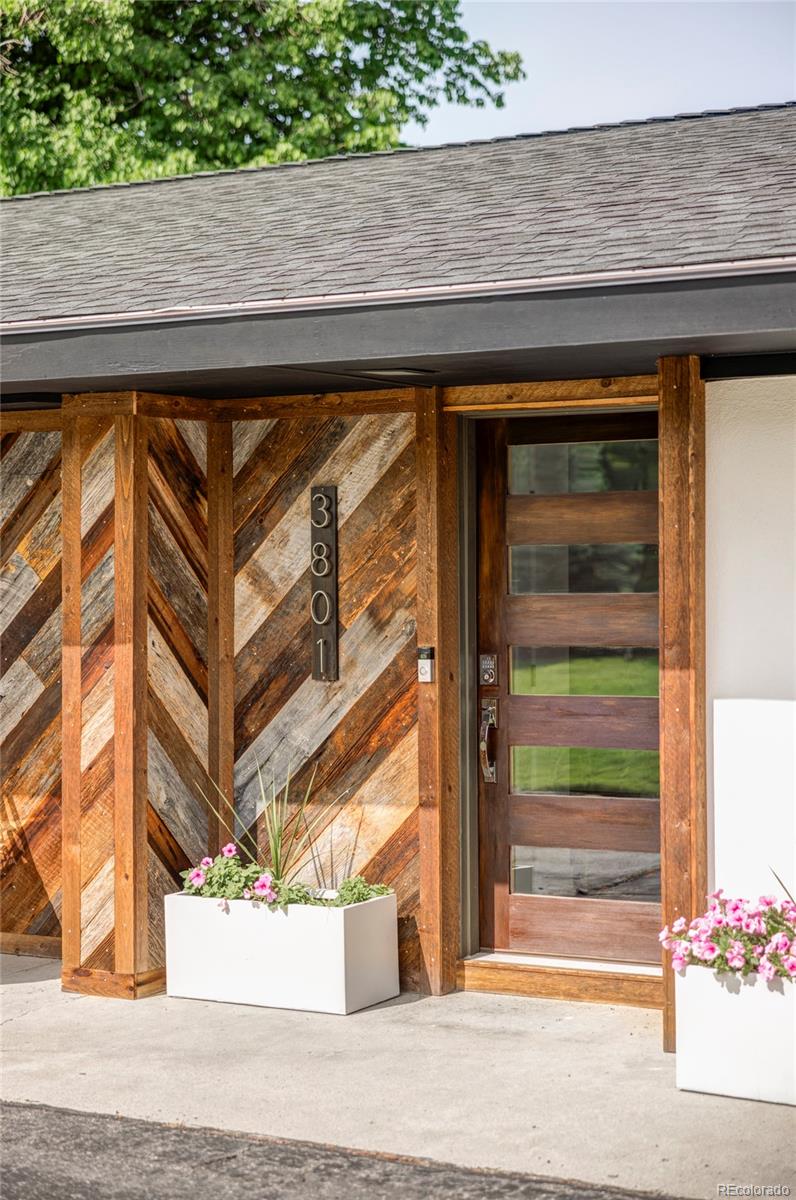
Active under contract
$2,295,000
4
bds
|
3
ba
|
3,256
sqft
|
built
1951
3801 S Albion St, Englewood, CO 80113
$-6,747
Cash flow
-15.3%
Cash-on-Cash Return
2.2%
Cap rate
0.3%
Rent to Value Ratio
Active
$1,575,000
7
bds
|
4
ba
|
4,862
sqft
|
built
1982
11453 E Orchard Pl, Englewood, CO 80111
$-5,105
Cash flow
-16.9%
Cash-on-Cash Return
1.8%
Cap rate
0.3%
Rent to Value Ratio
Active
$485,000
3
bds
|
1
ba
|
1,539
sqft
|
built
1910
4290 S Cherokee St, Englewood, CO 80110
$-585
Cash flow
-6.3%
Cash-on-Cash Return
4.2%
Cap rate
0.6%
Rent to Value Ratio
Active under contract
$725,000
4
bds
|
4
ba
|
2,172
sqft
|
built
1978
5612 S Lansing Ct, Englewood, CO 80111
$-1,490
Cash flow
-10.7%
Cash-on-Cash Return
3.2%
Cap rate
0.5%
Rent to Value Ratio
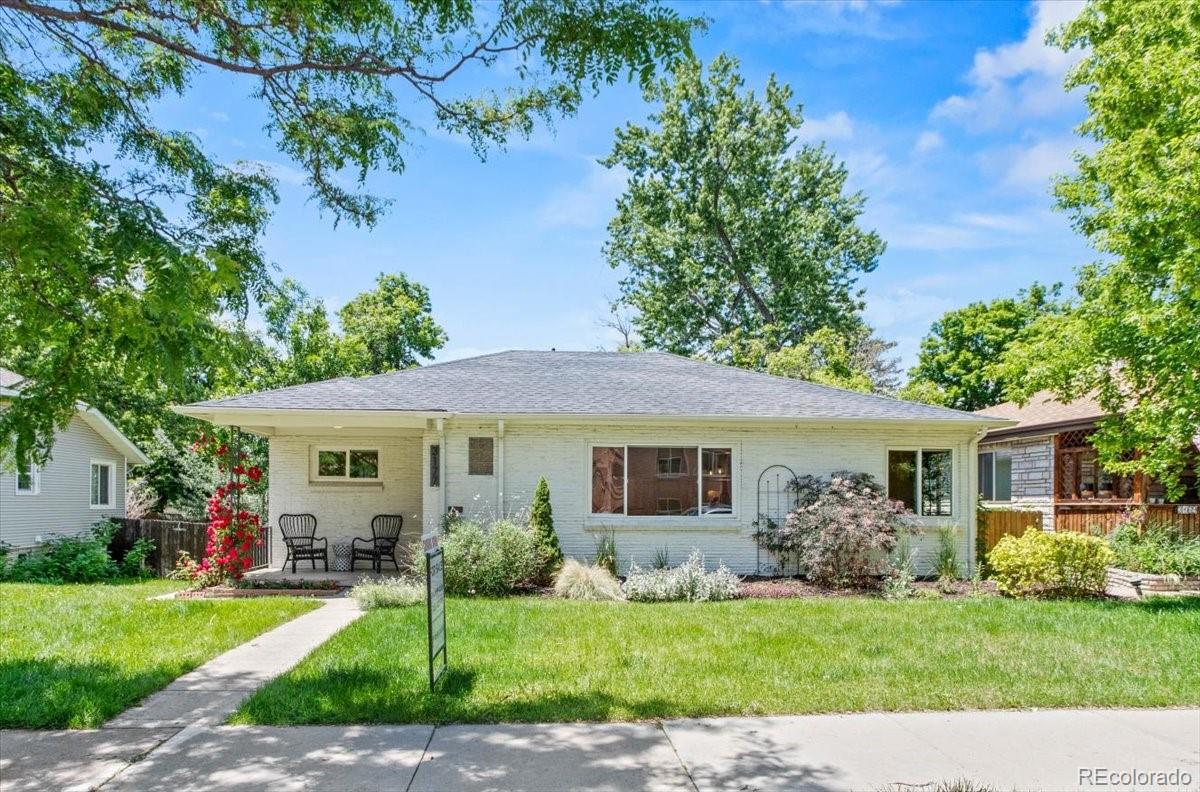
Active under contract
$485,000
4
bds
|
2
ba
|
2,302
sqft
|
built
1959
3334 W Grand Ave, Englewood, CO 80110
$-609
Cash flow
-6.6%
Cash-on-Cash Return
4.2%
Cap rate
0.6%
Rent to Value Ratio