Englewood, CO Investment Properties for Sale
Browse homes for sale and investment properties in Englewood, CO. Refine your search by price, property type, or more.
Best cash flowing properties in Englewood, CO
Active
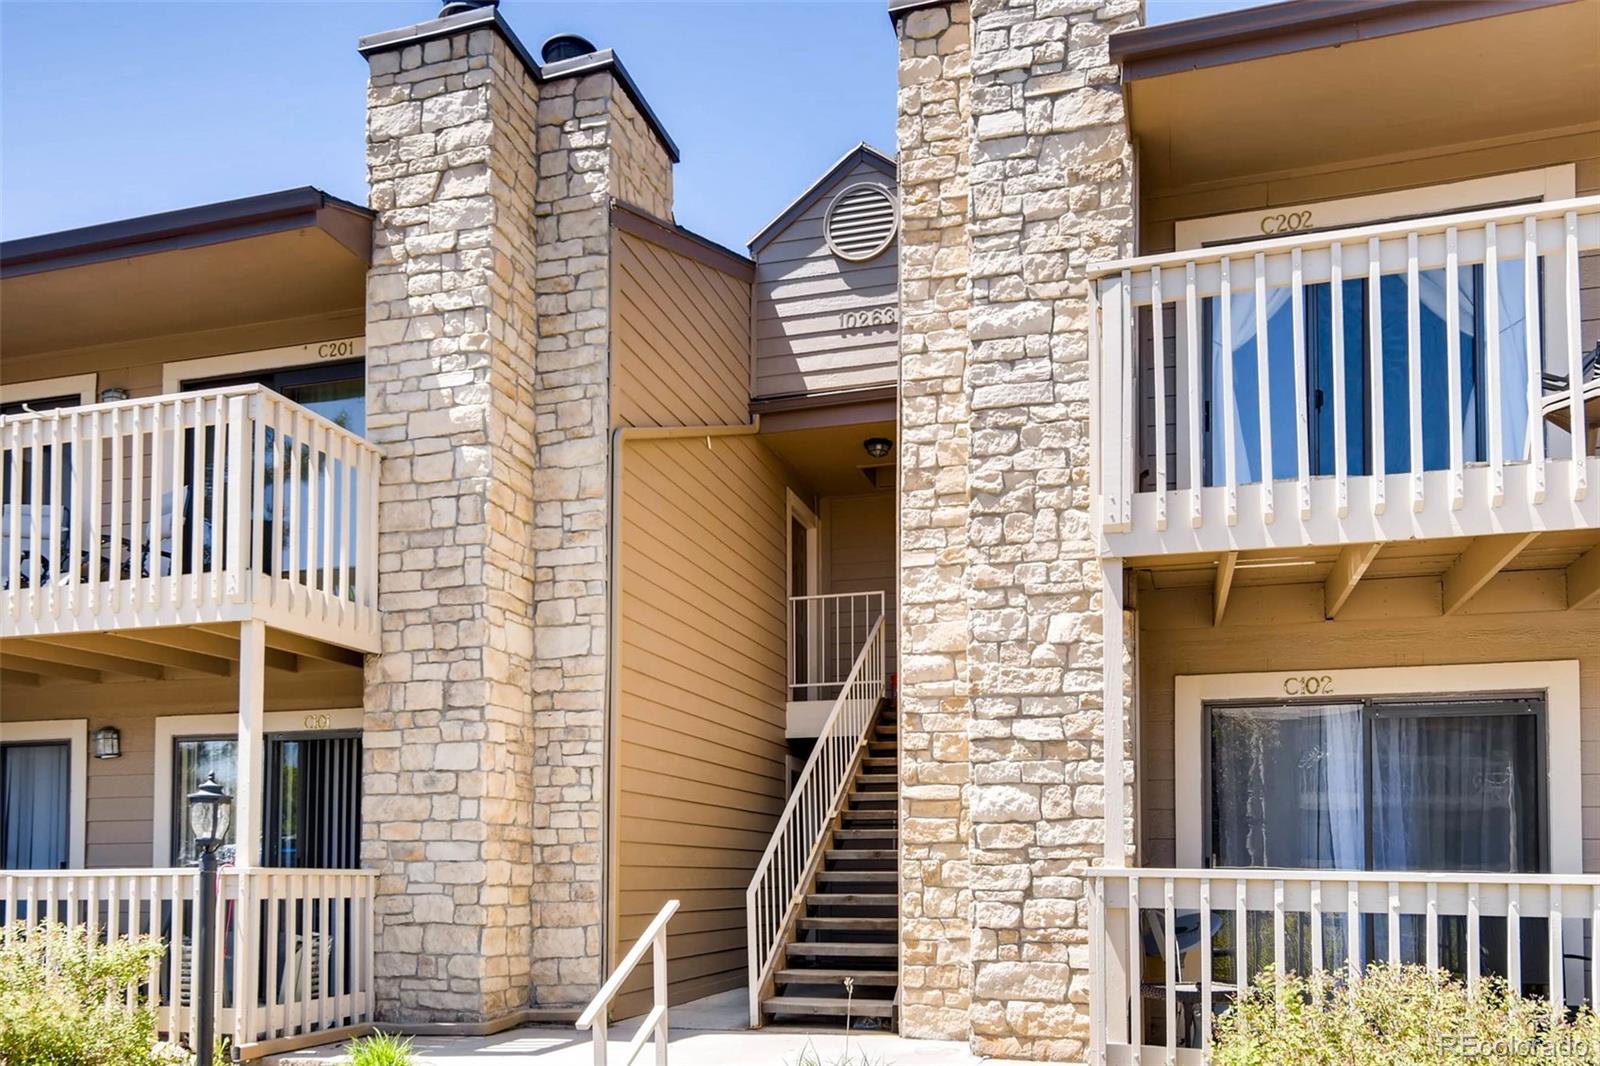
$240,000
1
bds
|
1
ba
|
765
sqft
|
built
1984
10293 E Peakview Ave, Englewood, CO 80111
$-477
Cash flow
-10.4%
Cash-on-Cash Return
3.9%
Cap rate
0.7%
Rent to Value Ratio
Active
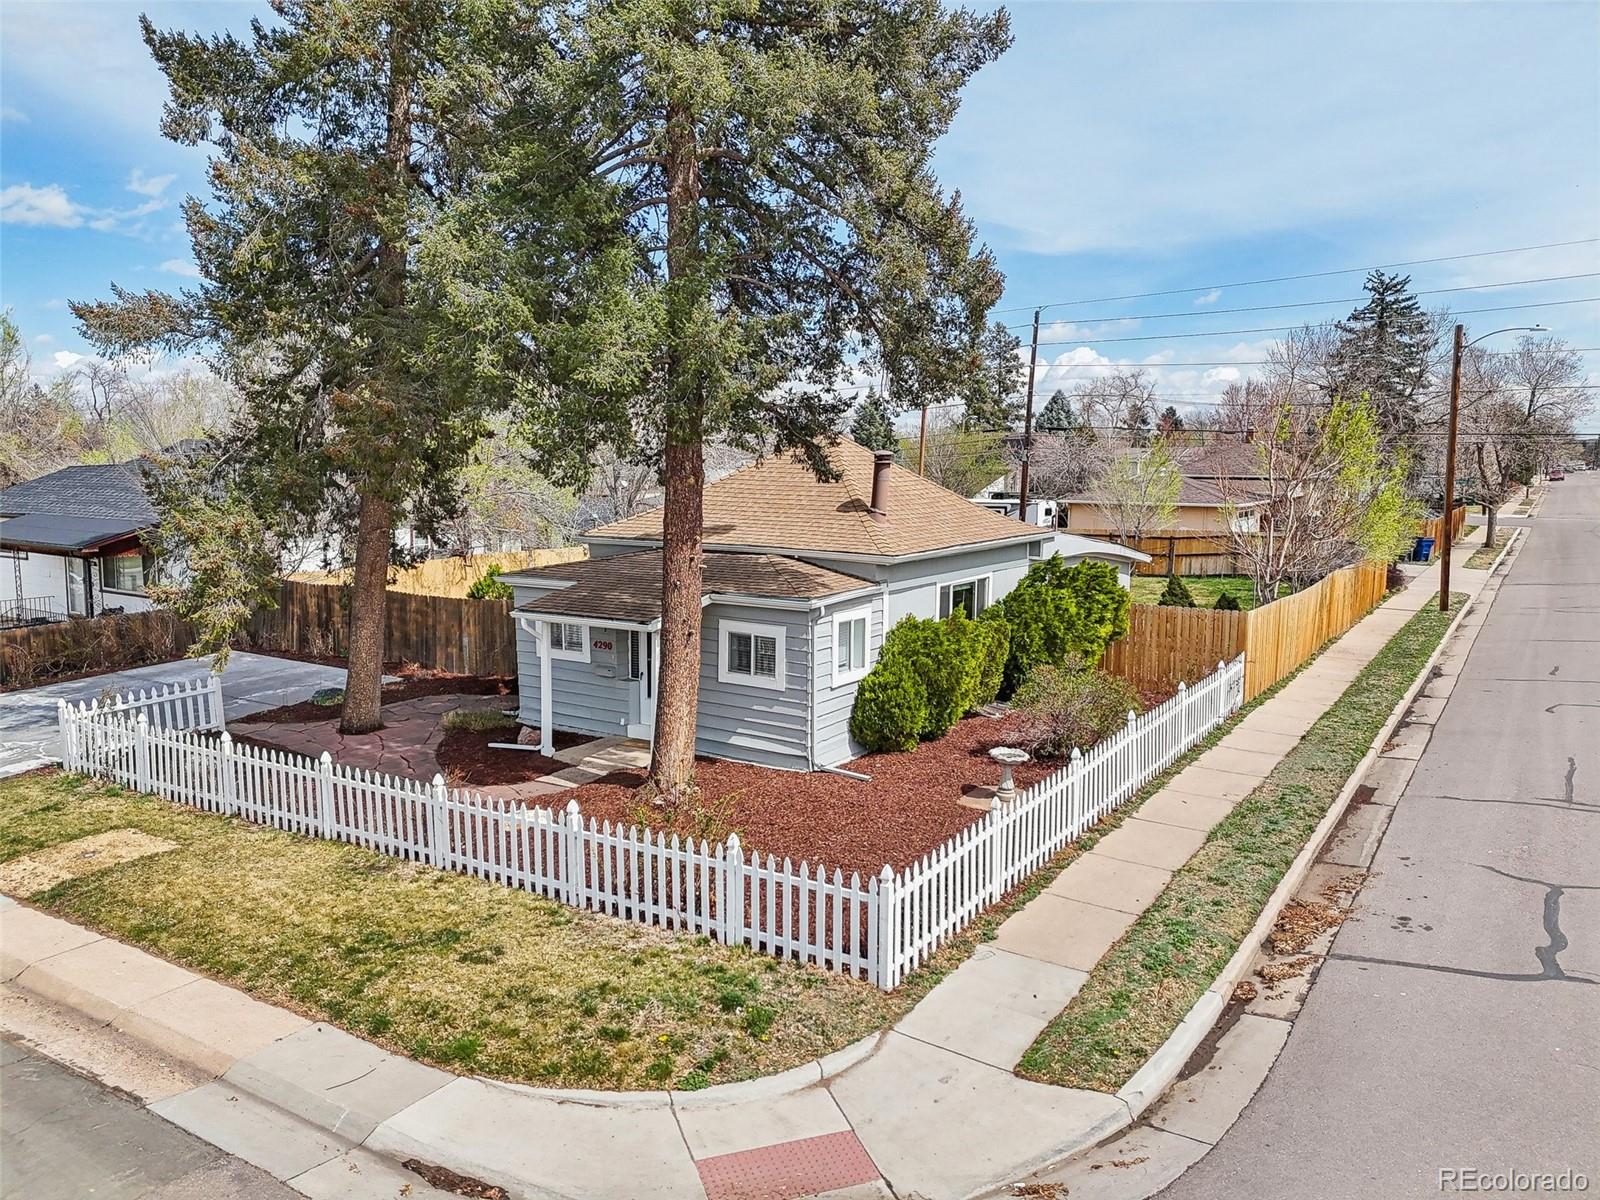
$485,000
3
bds
|
1
ba
|
1,539
sqft
|
built
1910
4290 S Cherokee St, Englewood, CO 80110
$-830
Cash flow
-8.9%
Cash-on-Cash Return
4.2%
Cap rate
0.6%
Rent to Value Ratio
215 out of 246 properties for sale in Englewood, CO
Limited Results Shown
Create a free account, or log in to reveal all property listings and enjoy the complete experience.
Active
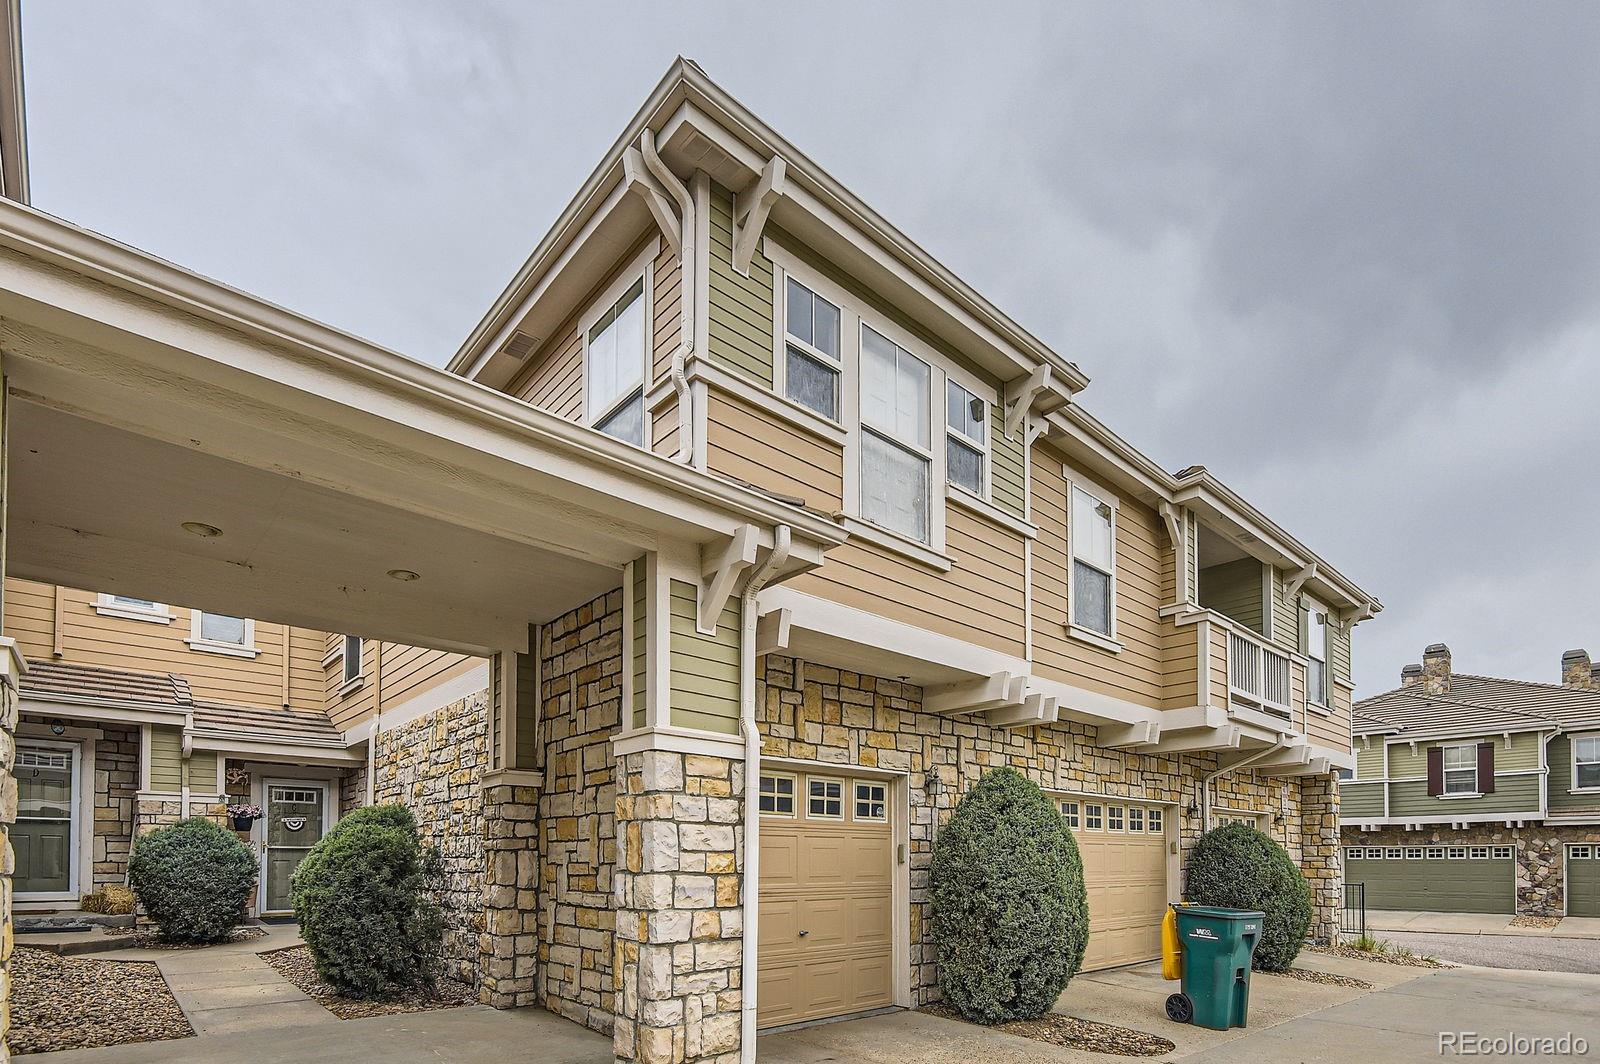
$385,000
3
bds
|
3
ba
|
1,420
sqft
|
built
2004
12835 Mayfair Way, Englewood, CO 80112
$-833
Cash flow
-11.3%
Cash-on-Cash Return
3.7%
Cap rate
0.6%
Rent to Value Ratio
Active
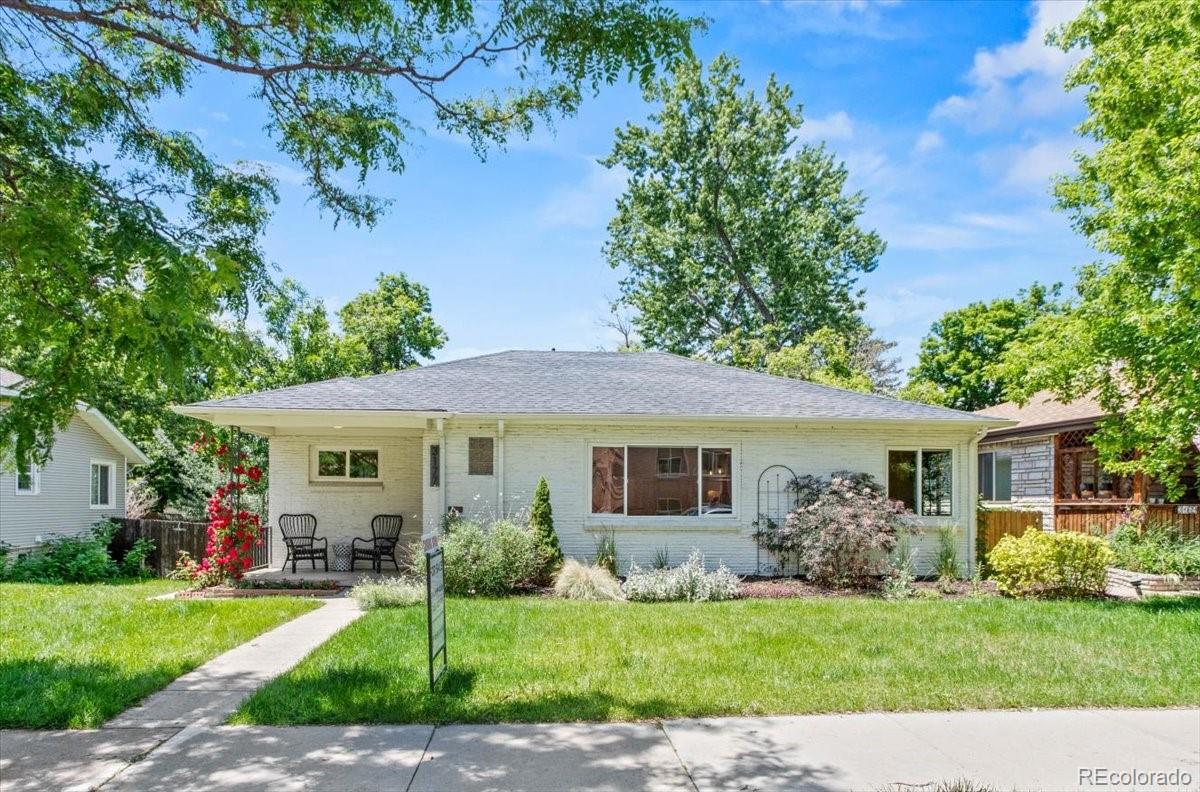
$785,000
5
bds
|
3
ba
|
2,052
sqft
|
built
1954
3177 S Grant St, Englewood, CO 80113
$-2,048
Cash flow
-13.6%
Cash-on-Cash Return
3.2%
Cap rate
0.4%
Rent to Value Ratio
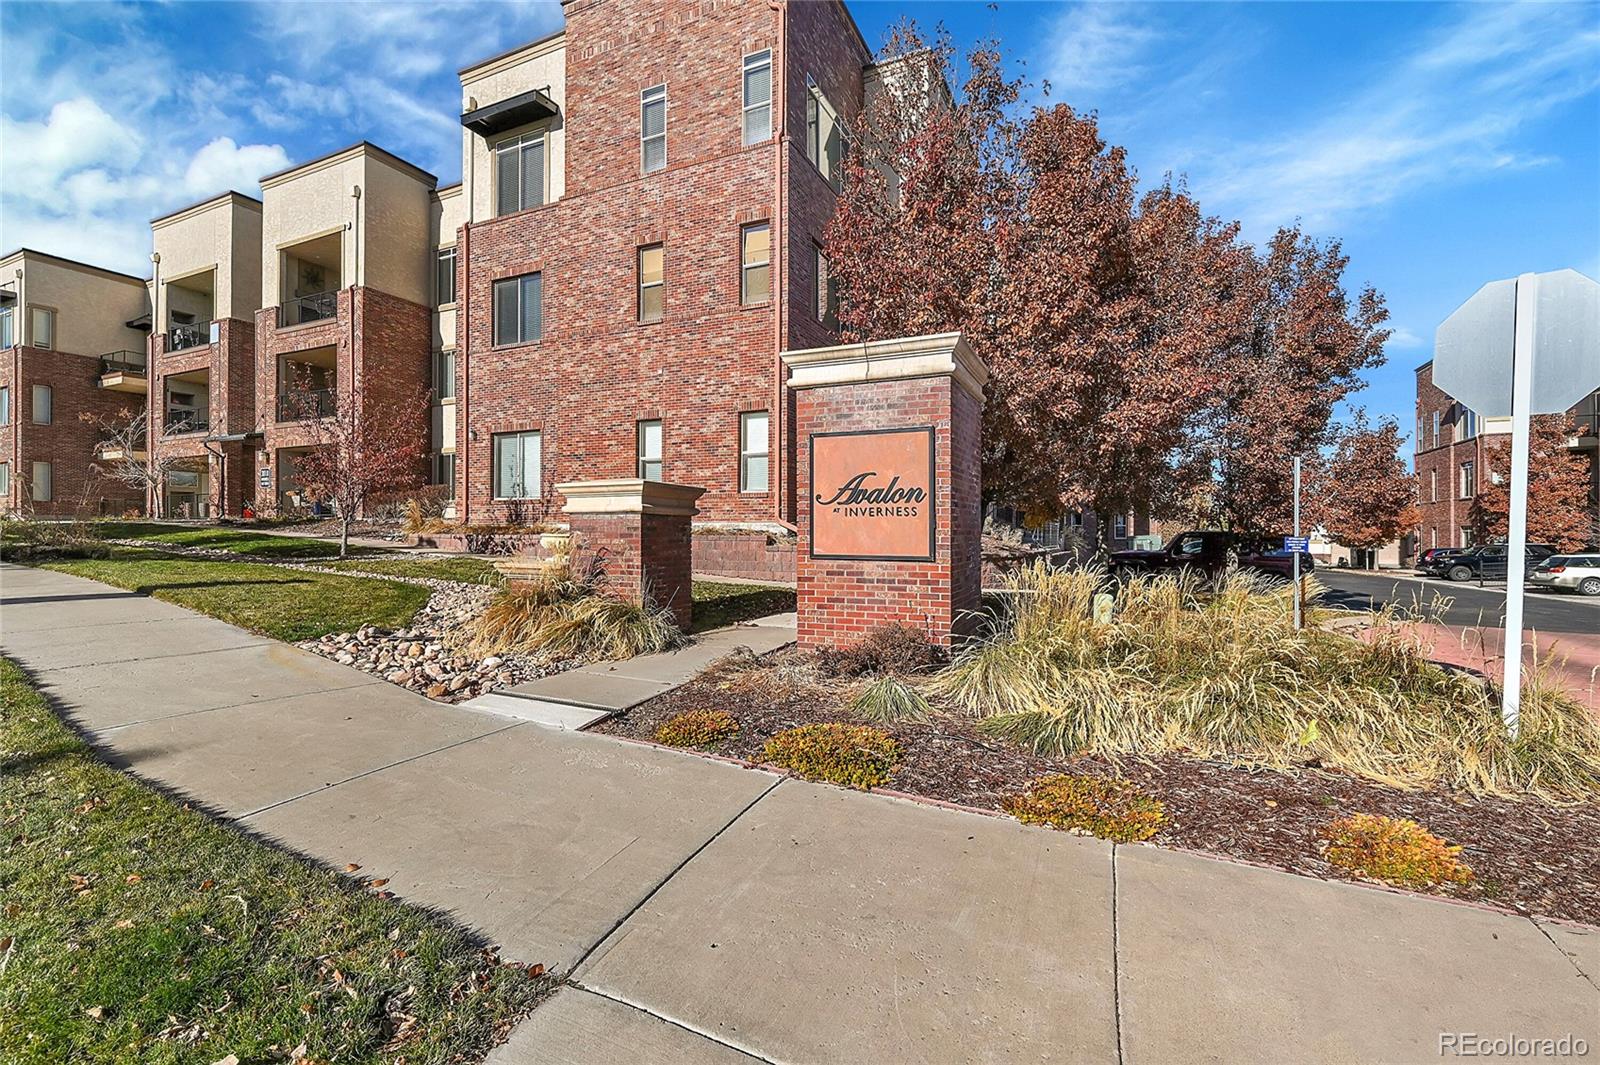
Active
$349,000
1
bds
|
1
ba
|
1,023
sqft
|
built
2015
301 Inverness Way S, Englewood, CO 80112
$-1,001
Cash flow
-15.0%
Cash-on-Cash Return
2.8%
Cap rate
0.6%
Rent to Value Ratio
Active
$485,000
3
bds
|
1
ba
|
1,539
sqft
|
built
1910
4290 S Cherokee St, Englewood, CO 80110
$-830
Cash flow
-8.9%
Cash-on-Cash Return
4.2%
Cap rate
0.6%
Rent to Value Ratio
Active under contract
$725,000
4
bds
|
4
ba
|
2,172
sqft
|
built
1978
5612 S Lansing Ct, Englewood, CO 80111
$-1,856
Cash flow
-13.4%
Cash-on-Cash Return
3.2%
Cap rate
0.5%
Rent to Value Ratio
Active
$240,000
1
bds
|
1
ba
|
765
sqft
|
built
1984
10293 E Peakview Ave, Englewood, CO 80111
$-477
Cash flow
-10.4%
Cash-on-Cash Return
3.9%
Cap rate
0.7%
Rent to Value Ratio
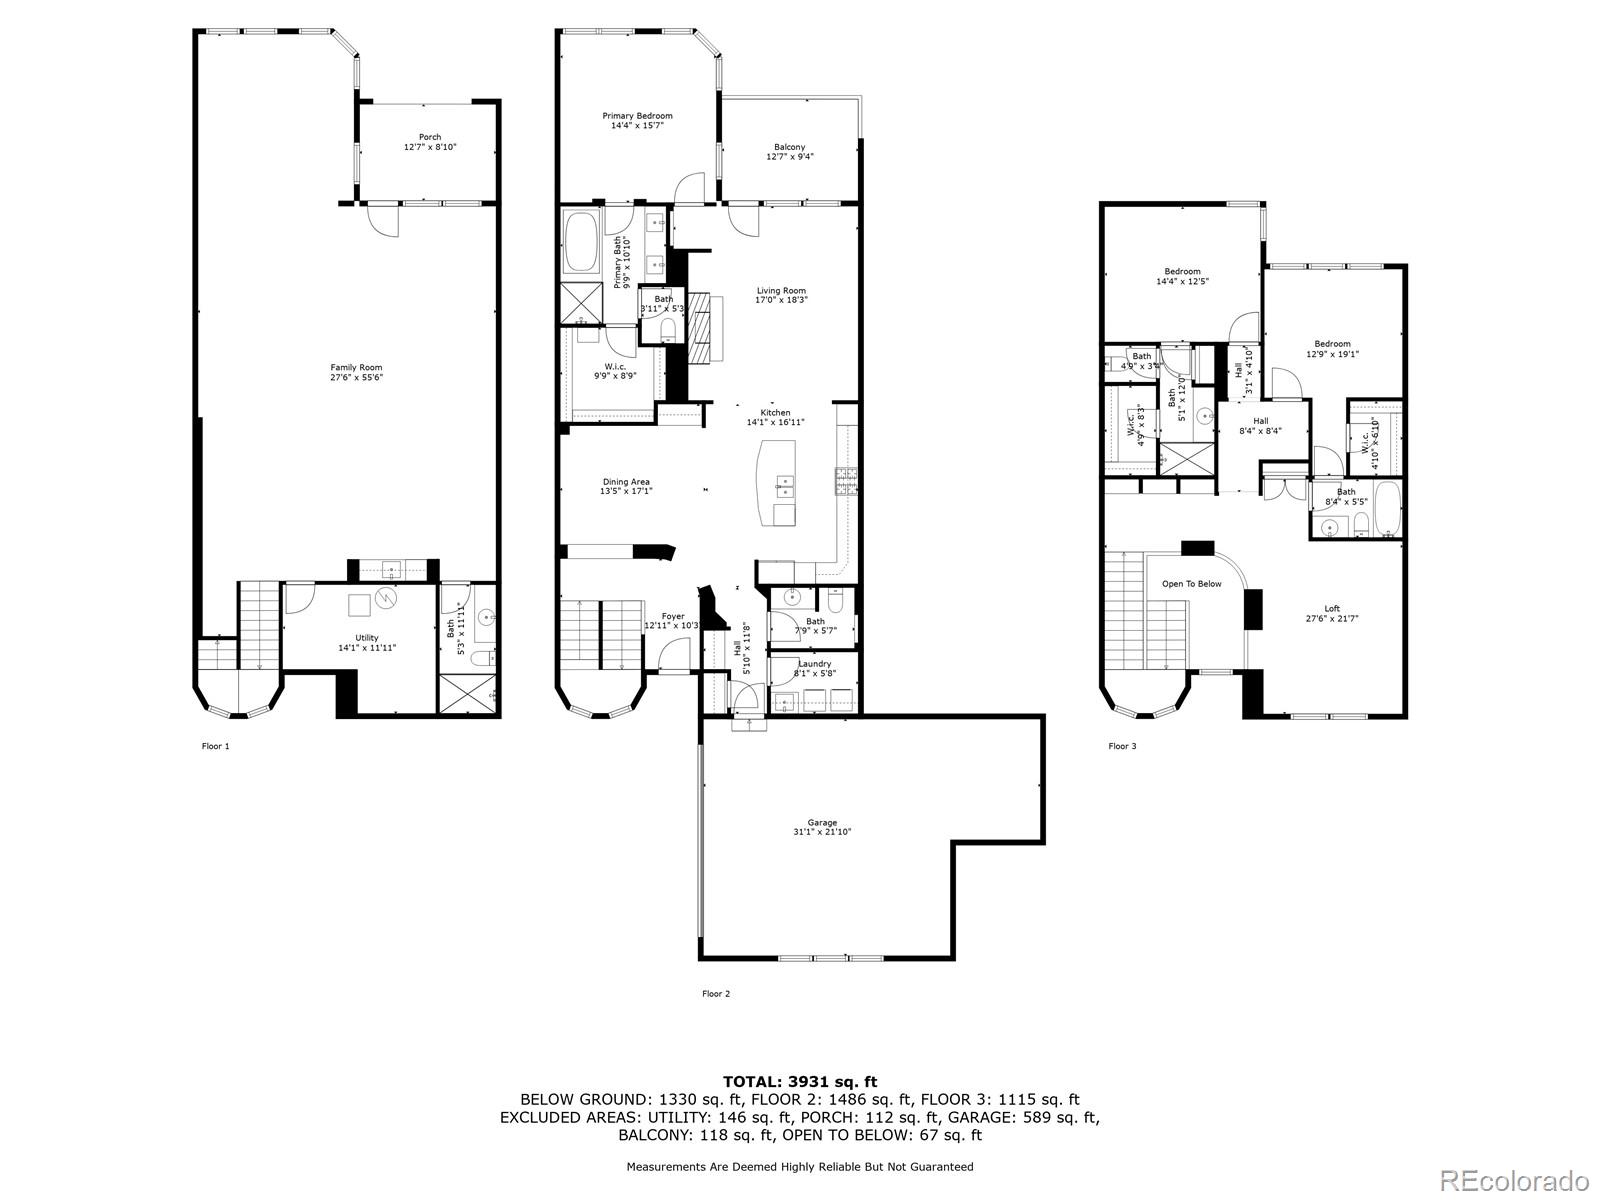
Active
$1,299,000
3
bds
|
5
ba
|
4,272
sqft
|
built
2008
7882 Vallagio Ln, Englewood, CO 80112
$-4,851
Cash flow
-19.5%
Cash-on-Cash Return
1.8%
Cap rate
0.4%
Rent to Value Ratio
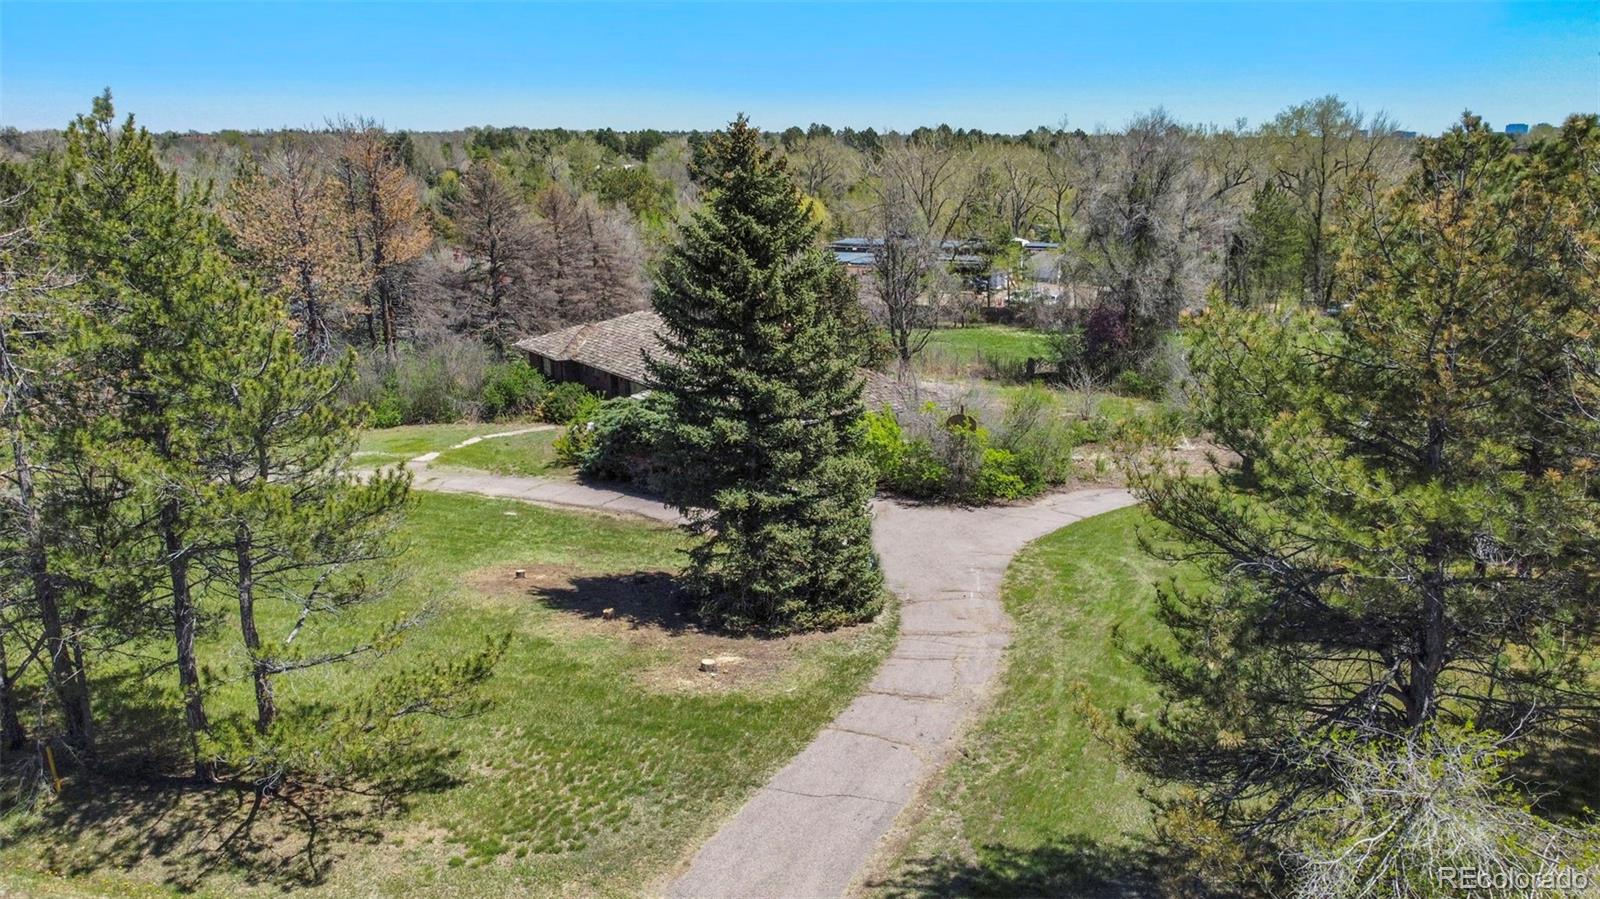
Active
$600,000
5
bds
|
0
ba
|
2,844
sqft
|
built
1964
3162 S Dale Ct, Englewood, CO 80110
$-956
Cash flow
-8.3%
Cash-on-Cash Return
4.4%
Cap rate
0.6%
Rent to Value Ratio
Active
$5,735,000
3
bds
|
3
ba
|
2,373
sqft
|
built
1963
4480 S Franklin St, Englewood, CO 80113
$-27,912
Cash flow
-25.4%
Cash-on-Cash Return
0.4%
Cap rate
0.1%
Rent to Value Ratio
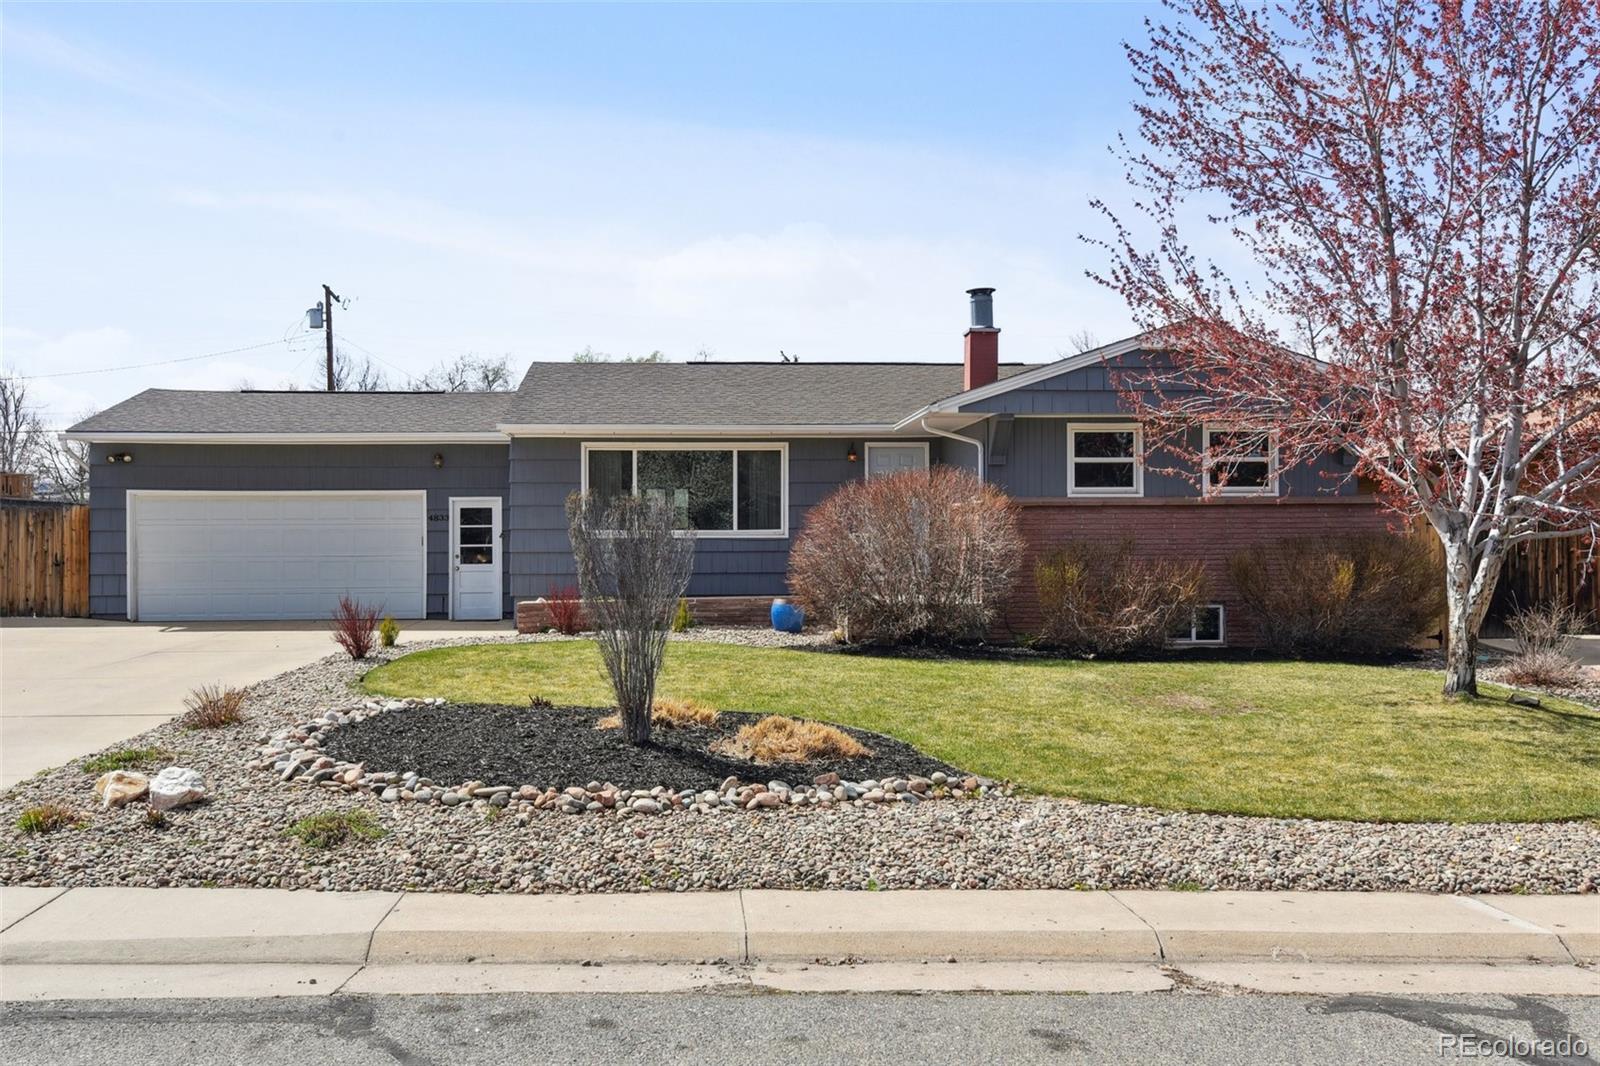
Active
$630,000
4
bds
|
2
ba
|
2,256
sqft
|
built
1956
4833 S Elati St, Englewood, CO 80110
$-1,419
Cash flow
-11.8%
Cash-on-Cash Return
3.6%
Cap rate
0.5%
Rent to Value Ratio
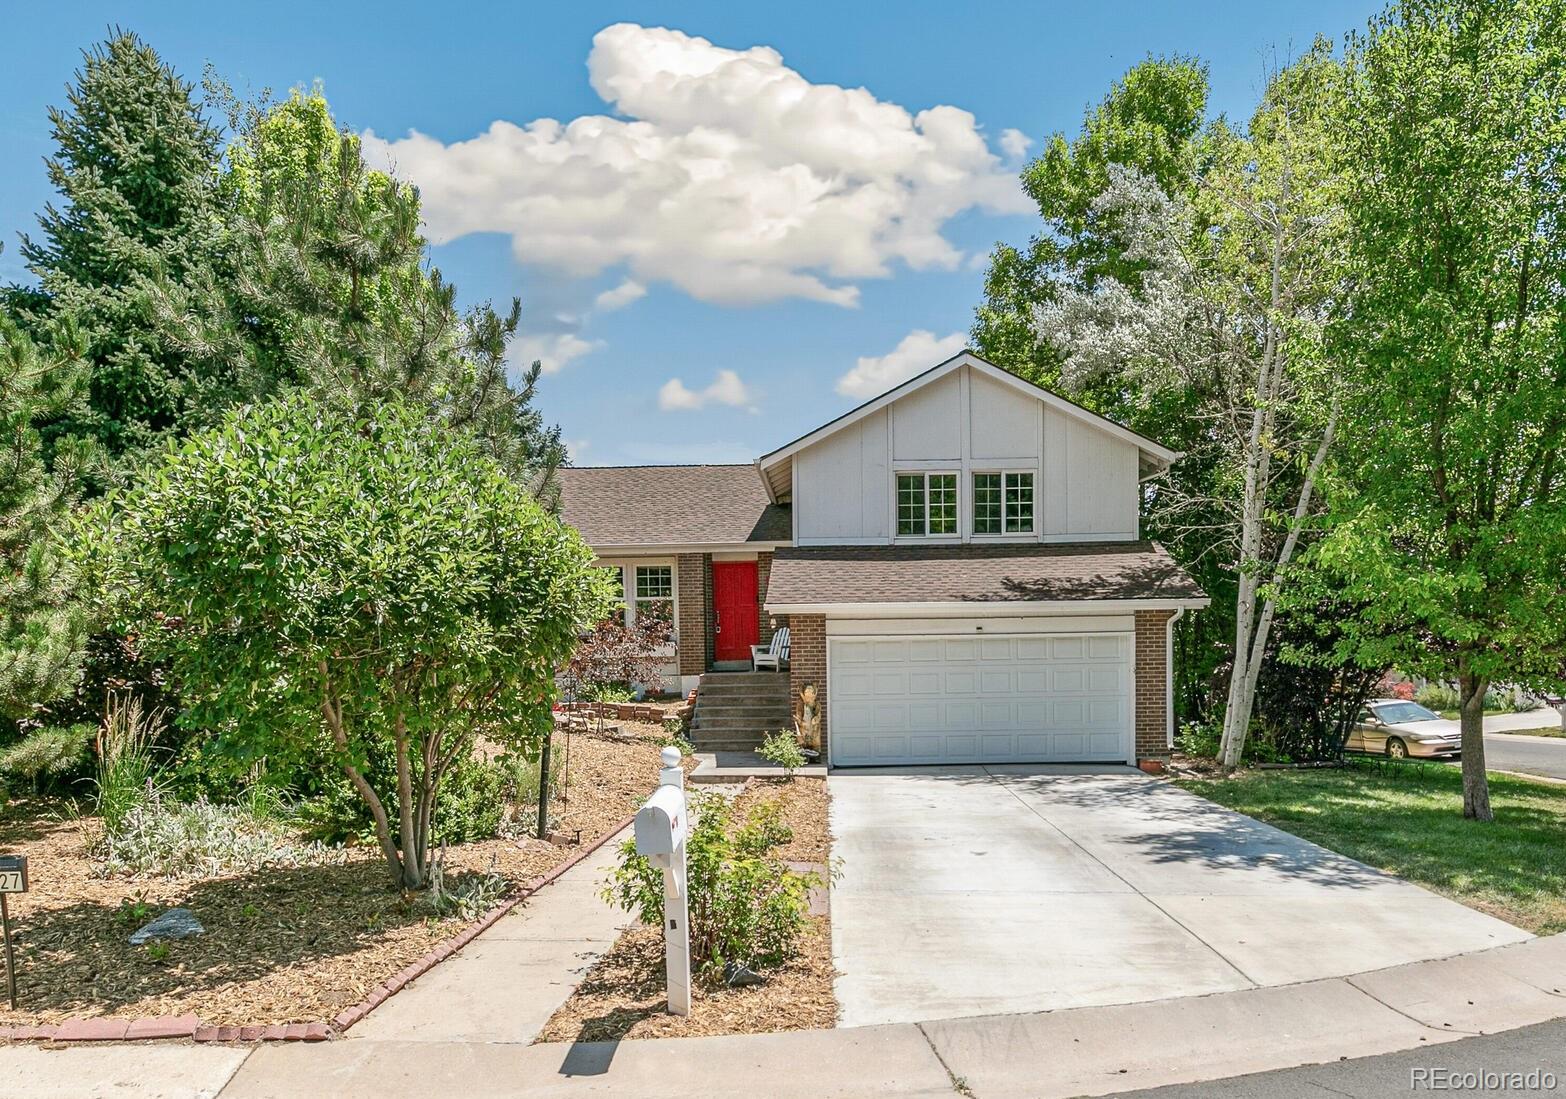
Pending
$700,000
4
bds
|
4
ba
|
2,386
sqft
|
built
1977
6327 S Emporia Cir, Englewood, CO 80111
$-1,818
Cash flow
-13.6%
Cash-on-Cash Return
3.2%
Cap rate
0.5%
Rent to Value Ratio
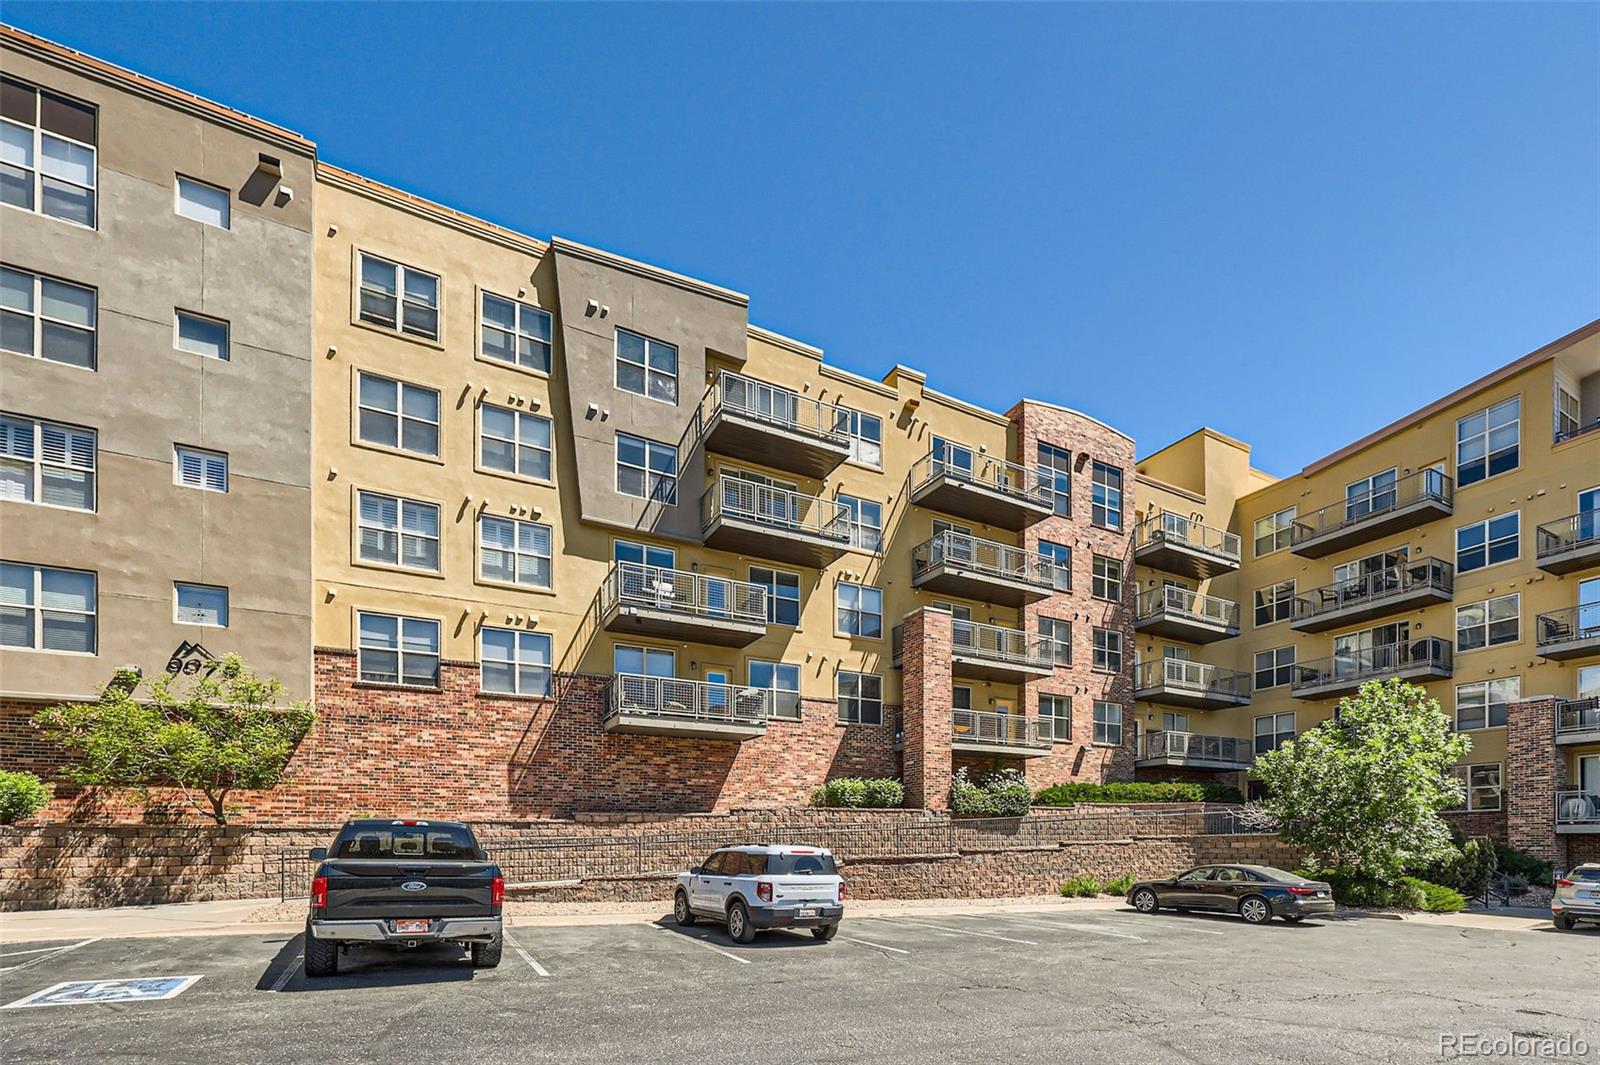
Active
$439,900
2
bds
|
2
ba
|
1,183
sqft
|
built
2007
9079 E Panorama Cir, Englewood, CO 80112
$-1,467
Cash flow
-17.4%
Cash-on-Cash Return
2.3%
Cap rate
0.5%
Rent to Value Ratio
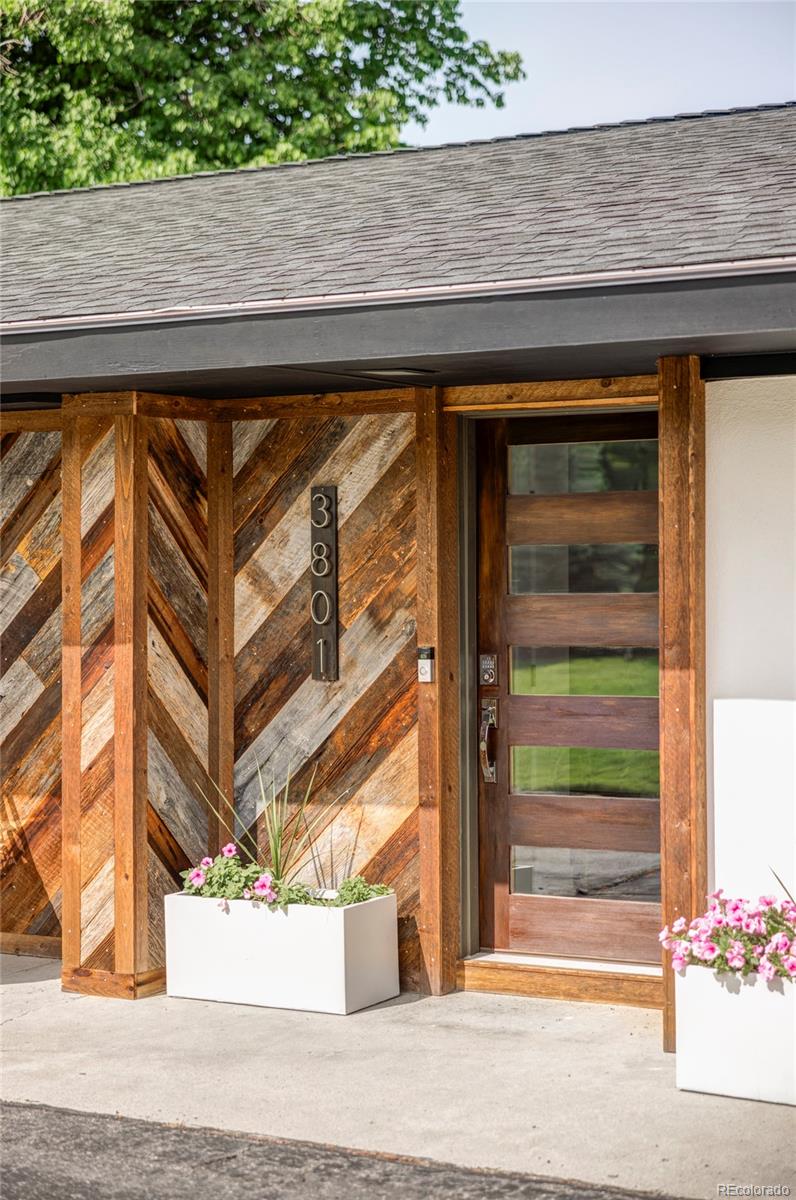
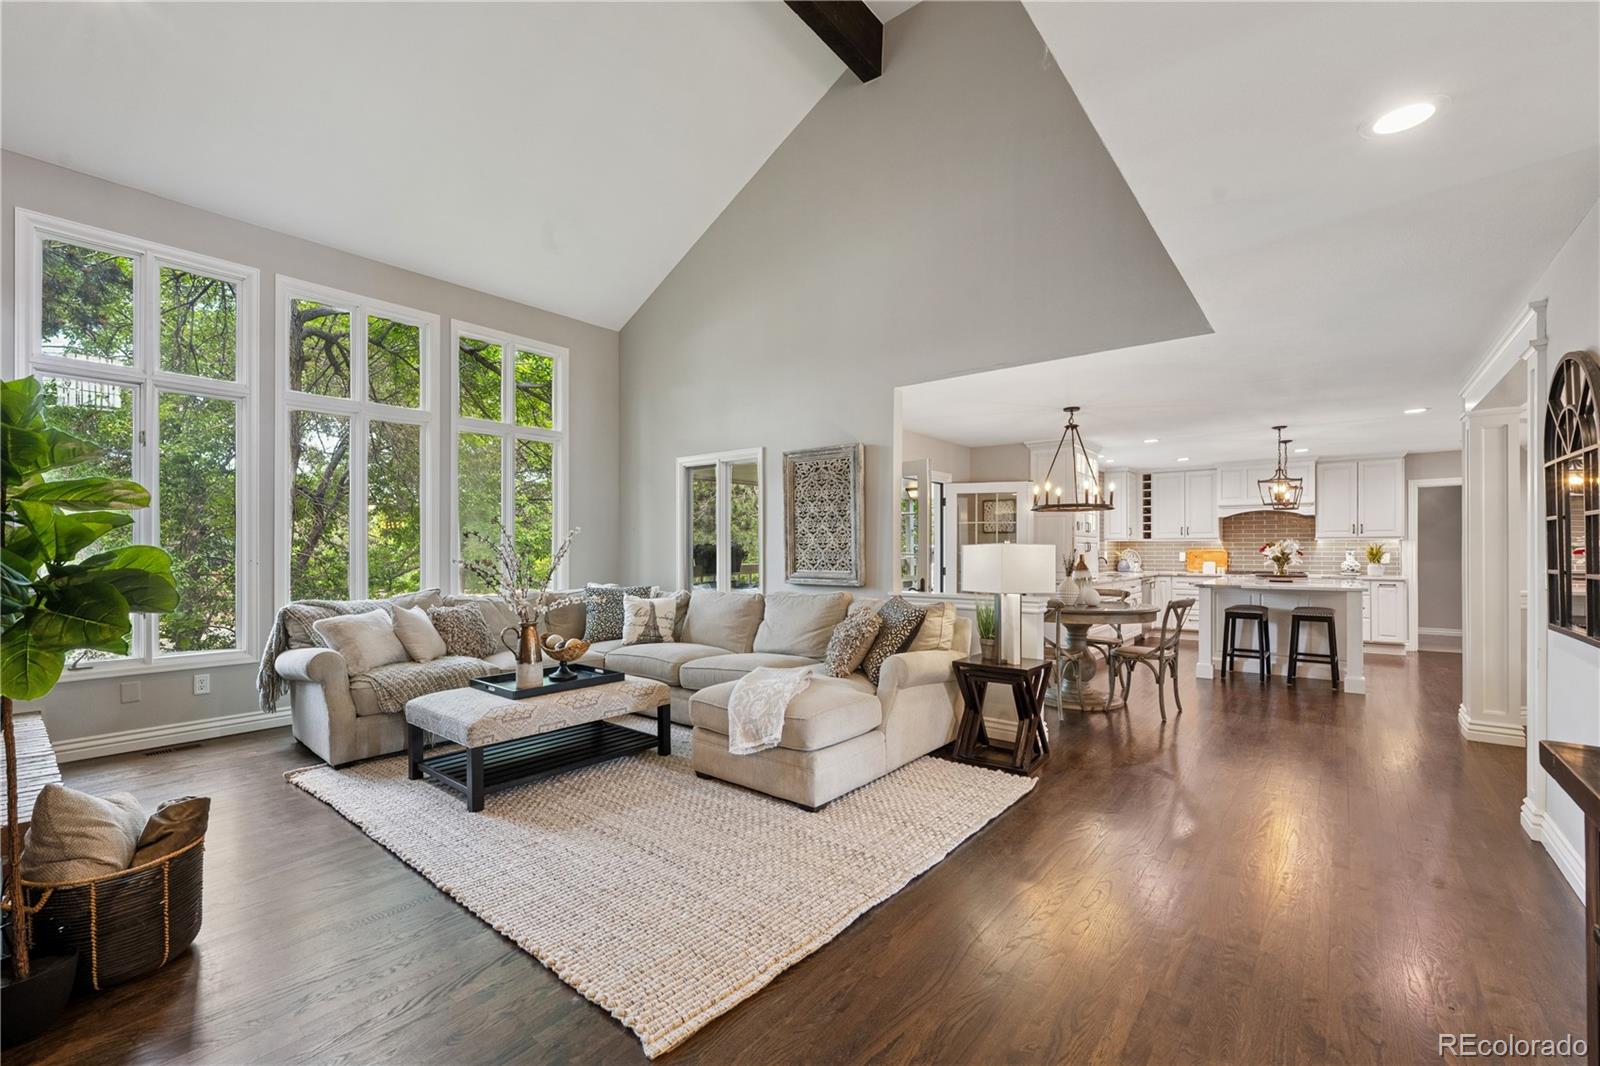
Active under contract
$2,295,000
4
bds
|
3
ba
|
3,256
sqft
|
built
1951
3801 S Albion St, Englewood, CO 80113
$-7,904
Cash flow
-18.0%
Cash-on-Cash Return
2.2%
Cap rate
0.3%
Rent to Value Ratio
Active
$1,550,000
7
bds
|
4
ba
|
4,862
sqft
|
built
1982
11453 E Orchard Pl, Englewood, CO 80111
$-5,769
Cash flow
-19.4%
Cash-on-Cash Return
1.8%
Cap rate
0.3%
Rent to Value Ratio
Active under contract
$485,000
4
bds
|
2
ba
|
2,302
sqft
|
built
1959
3334 W Grand Ave, Englewood, CO 80110
$-854
Cash flow
-9.2%
Cash-on-Cash Return
4.2%
Cap rate
0.6%
Rent to Value Ratio