Fargo, ND Investment Properties for Sale
Browse homes for sale and investment properties in Fargo, ND. Refine your search by price, property type, or more.
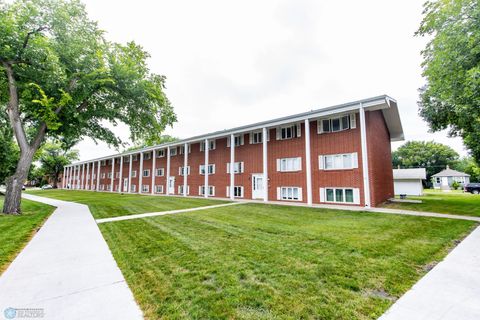
Best cash flowing properties in Fargo, ND
Active
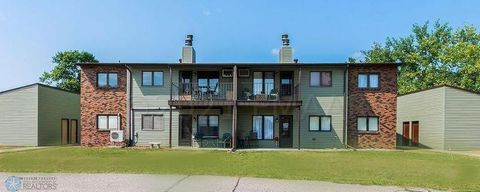
$129,000
2
bds
|
1
ba
|
921
sqft
|
built
1978
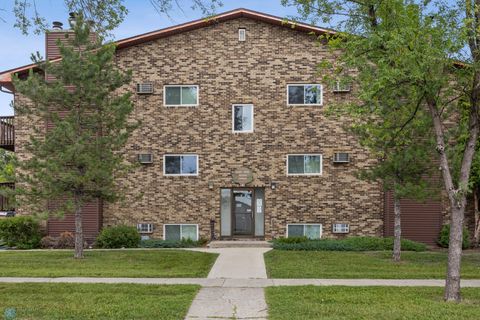
2402 18th St S, Fargo, ND 58103
$179
Cash flow
7.2%
Cash-on-Cash Return
7.3%
Cap rate
1.1%
Rent to Value Ratio
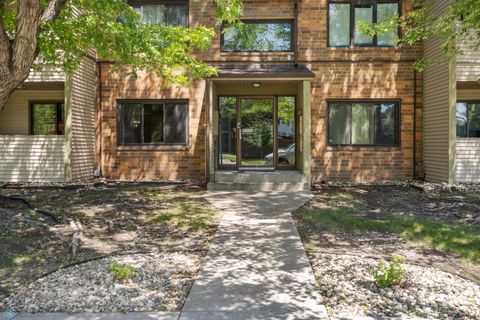
Active
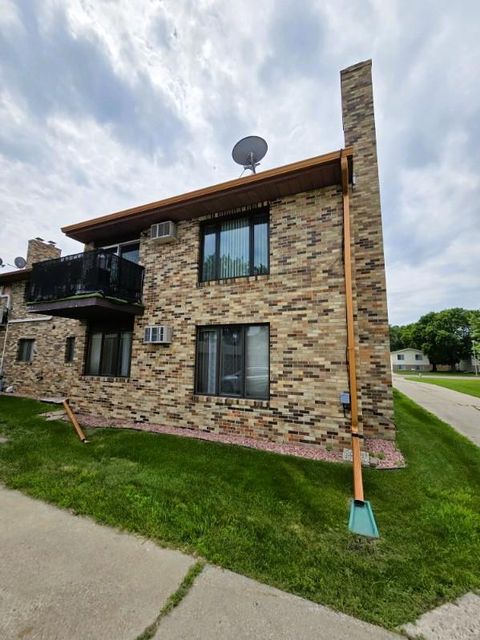
$129,900
2
bds
|
1
ba
|
936
sqft
|
built
1978
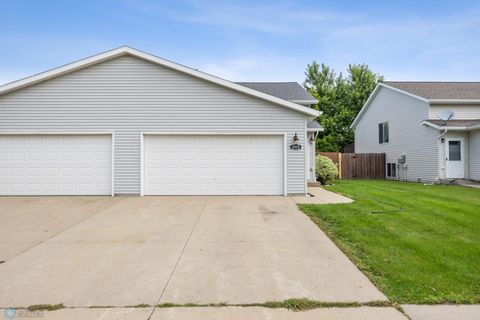
2308 18th St S, Fargo, ND 58103
$151
Cash flow
6.1%
Cash-on-Cash Return
7.1%
Cap rate
1.1%
Rent to Value Ratio
74 out of 285 properties for sale in Fargo, ND
Limited Results Shown
Create a free account, or log in to reveal all property listings and enjoy the complete experience.
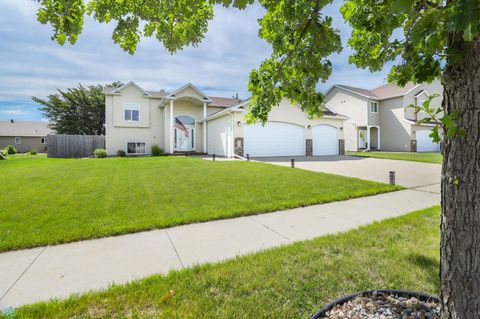
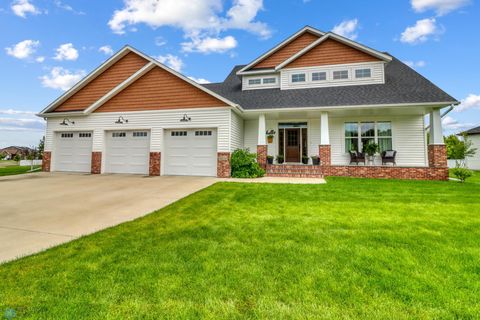
Active
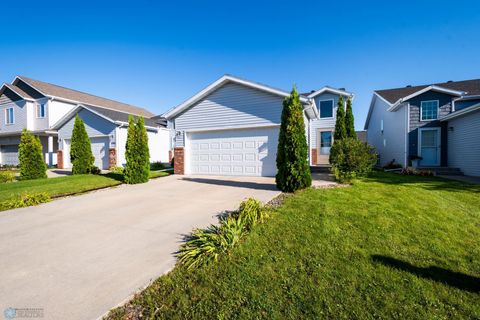
$329,900
4
bds
|
2
ba
|
1,880
sqft
|
built
2013
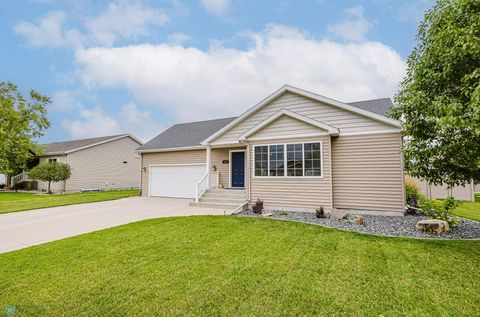
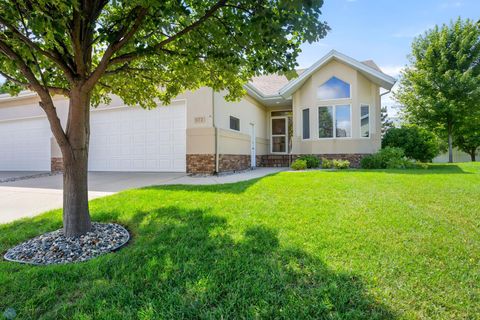
4767 Spencer Ln S, Fargo, ND 58104
$-217
Cash flow
-3.4%
Cash-on-Cash Return
4.9%
Cap rate
0.8%
Rent to Value Ratio
Active
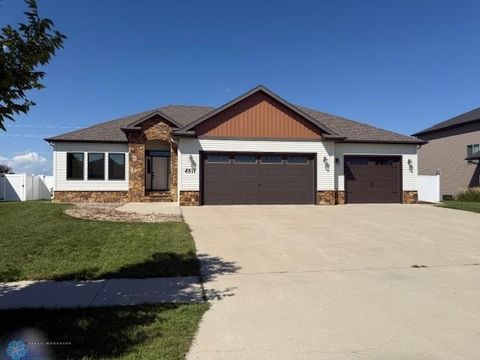
$639,900
4
bds
|
3
ba
|
3,032
sqft
|
built
2013
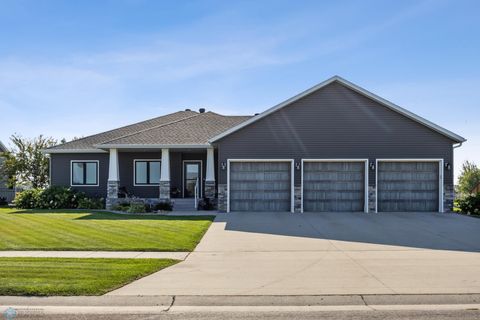
6511 Osgood Pkwy S, Fargo, ND 58104
$-1,497
Cash flow
-12.2%
Cash-on-Cash Return
2.9%
Cap rate
0.5%
Rent to Value Ratio
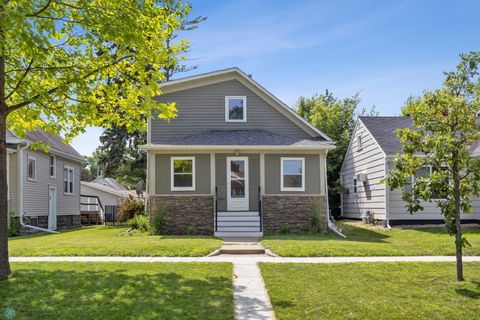
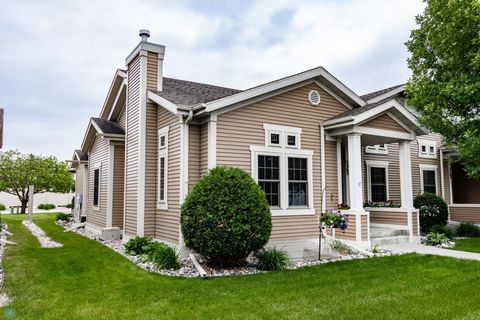
Active
$279,900
3
bds
|
2
ba
|
1,930
sqft
|
built
1998
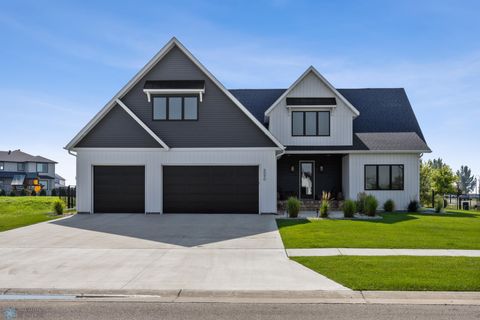
2714 Wheatland Dr S, Fargo, ND 58103
$-34
Cash flow
-0.6%
Cash-on-Cash Return
5.5%
Cap rate
0.8%
Rent to Value Ratio
Active
$320,000
3
bds
|
4
ba
|
2,486
sqft
|
built
1987
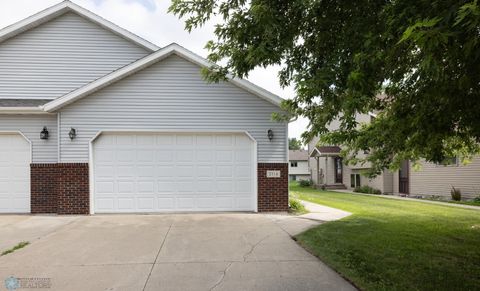
3210 15th Ave S, Fargo, ND 58103
$-599
Cash flow
-9.8%
Cash-on-Cash Return
3.4%
Cap rate
0.6%
Rent to Value Ratio
Active
$1,000,000
4
bds
|
4
ba
|
4,308
sqft
|
built
2009
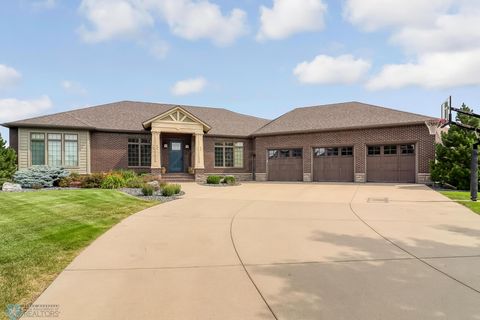
6108 Silverleaf Dr S, Fargo, ND 58104
$-2,797
Cash flow
-14.6%
Cash-on-Cash Return
2.3%
Cap rate
0.4%
Rent to Value Ratio
Active
$272,900
3
bds
|
2
ba
|
1,930
sqft
|
built
1996
2915 Dakota Park Cir S, Fargo, ND 58104
$-58
Cash flow
-1.1%
Cash-on-Cash Return
5.4%
Cap rate
0.8%
Rent to Value Ratio
Active
$399,900
4
bds
|
3
ba
|
2,896
sqft
|
built
2007
3730 Taylor St S, Fargo, ND 58104
$-167
Cash flow
-2.2%
Cash-on-Cash Return
5.2%
Cap rate
0.7%
Rent to Value Ratio
Active
$744,900
6
bds
|
3
ba
|
3,884
sqft
|
built
2014
5932 Autumn Dr S, Fargo, ND 58104
$-1,972
Cash flow
-13.8%
Cash-on-Cash Return
2.5%
Cap rate
0.5%
Rent to Value Ratio
Active
$1,175,000
7
bds
|
4
ba
|
4,915
sqft
|
built
2021
6090 Wildflower Dr S, Fargo, ND 58104
$-4,837
Cash flow
-21.5%
Cash-on-Cash Return
0.7%
Cap rate
0.2%
Rent to Value Ratio
Active
$360,000
4
bds
|
12
ba
|
2,484
sqft
|
built
1979
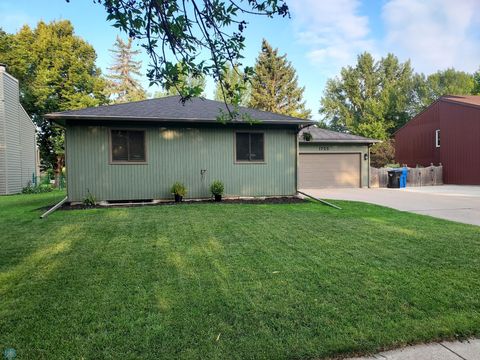
1725 Prairie Ln S, Fargo, ND 58103
$-340
Cash flow
-4.9%
Cash-on-Cash Return
4.5%
Cap rate
0.7%
Rent to Value Ratio
Active
$475,000
4
bds
|
3
ba
|
2,734
sqft
|
built
2015
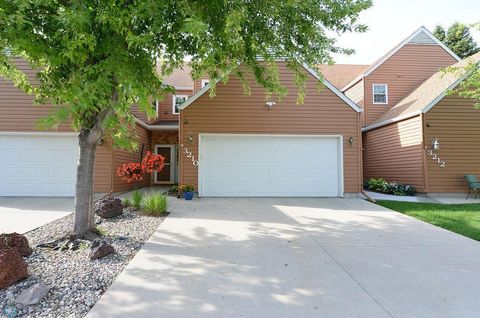
6163 Maple Valley Dr S, Fargo, ND 58104
$-1,043
Cash flow
-11.5%
Cash-on-Cash Return
3.0%
Cap rate
0.5%
Rent to Value Ratio
Active
$849,000
5
bds
|
3
ba
|
3,246
sqft
|
built
2014
4245 Coventry Dr S, Fargo, ND 58104
$-2,521
Cash flow
-15.5%
Cash-on-Cash Return
2.1%
Cap rate
0.4%
Rent to Value Ratio
Active
$410,000
4
bds
|
3
ba
|
2,127
sqft
|
built
2005
3527 Lincoln St S, Fargo, ND 58104
$-711
Cash flow
-9.0%
Cash-on-Cash Return
3.6%
Cap rate
0.6%
Rent to Value Ratio
Active
$740,000
5
bds
|
3
ba
|
3,974
sqft
|
built
2020
3620 Cordova Loop S, Fargo, ND 58104
$-1,372
Cash flow
-9.7%
Cash-on-Cash Return
3.5%
Cap rate
0.6%
Rent to Value Ratio
Active
$639,900
5
bds
|
3
ba
|
3,664
sqft
|
built
2015
4267 Ponderosa Pl S, Fargo, ND 58104
$-1,191
Cash flow
-9.7%
Cash-on-Cash Return
3.4%
Cap rate
0.6%
Rent to Value Ratio
Active
$359,900
4
bds
|
3
ba
|
2,000
sqft
|
built
2010
2812 Umber Ct S, Fargo, ND 58104
$-469
Cash flow
-6.8%
Cash-on-Cash Return
4.1%
Cap rate
0.7%
Rent to Value Ratio
Active
$294,900
3
bds
|
2
ba
|
1,958
sqft
|
built
1971
2926 Edgewood Dr N, Fargo, ND 58102
$-110
Cash flow
-1.9%
Cash-on-Cash Return
5.2%
Cap rate
0.7%
Rent to Value Ratio
Active
$609,900
4
bds
|
3
ba
|
2,990
sqft
|
built
2020
3037 Prairie Farms Cir S, Fargo, ND 58104
$-1,575
Cash flow
-13.5%
Cash-on-Cash Return
2.6%
Cap rate
0.5%
Rent to Value Ratio
Active
$669,900
4
bds
|
4
ba
|
3,914
sqft
|
built
2001
6176 Martens Way S, Fargo, ND 58104
$-1,018
Cash flow
-7.9%
Cash-on-Cash Return
3.9%
Cap rate
0.6%
Rent to Value Ratio
Active
$1,150,000
4
bds
|
4
ba
|
3,523
sqft
|
built
2004
2508 Rose Creek Pkwy S, Fargo, ND 58104
$-4,333
Cash flow
-19.7%
Cash-on-Cash Return
1.2%
Cap rate
0.3%
Rent to Value Ratio
Active
$789,500
5
bds
|
3
ba
|
4,155
sqft
|
built
2020
6884 21st St S, Fargo, ND 58104
$-2,337
Cash flow
-15.4%
Cash-on-Cash Return
2.1%
Cap rate
0.5%
Rent to Value Ratio
Active
$410,000
4
bds
|
3
ba
|
2,604
sqft
|
built
2005
3548 Buchanan St S, Fargo, ND 58104
$-915
Cash flow
-11.6%
Cash-on-Cash Return
3.0%
Cap rate
0.5%
Rent to Value Ratio
Active
$222,000
3
bds
|
2
ba
|
1,415
sqft
|
built
1979
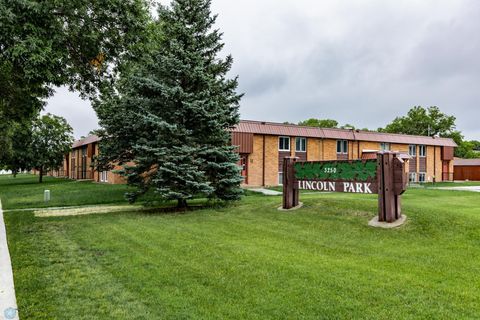
3250 15th Ave S, Fargo, ND 58103
$-481
Cash flow
-11.3%
Cash-on-Cash Return
3.1%
Cap rate
0.7%
Rent to Value Ratio
Active
$194,900
1
bds
|
1
ba
|
642
sqft
|
built
1911
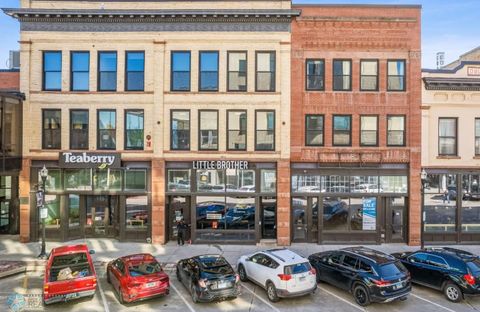
117 Broadway N, Fargo, ND 58102
$-207
Cash flow
-5.5%
Cash-on-Cash Return
4.4%
Cap rate
0.8%
Rent to Value Ratio
Active
$485,000
4
bds
|
3
ba
|
2,568
sqft
|
built
1999
1172 Eagle Park Dr S, Fargo, ND 58104
$-1,474
Cash flow
-15.9%
Cash-on-Cash Return
2.0%
Cap rate
0.4%
Rent to Value Ratio
Active
$110,000
2
bds
|
2
ba
|
967
sqft
|
built
1978
1129 22nd St S, Fargo, ND 58103
$124
Cash flow
5.9%
Cash-on-Cash Return
7.0%
Cap rate
1.2%
Rent to Value Ratio
Active
$94,900
2
bds
|
1
ba
|
1,005
sqft
|
built
1963
801 6th Ave N, Fargo, ND 58102
$-1
Cash flow
-0.1%
Cash-on-Cash Return
5.7%
Cap rate
1.2%
Rent to Value Ratio
Active
$409,000
4
bds
|
3
ba
|
2,672
sqft
|
built
2007
3625 Taylor St S, Fargo, ND 58104
$-372
Cash flow
-4.7%
Cash-on-Cash Return
4.6%
Cap rate
0.7%
Rent to Value Ratio
Active
$155,000
2
bds
|
2
ba
|
1,132
sqft
|
built
1977
3237 17th Ave S, Fargo, ND 58103
$-62
Cash flow
-2.1%
Cash-on-Cash Return
5.2%
Cap rate
1.0%
Rent to Value Ratio
Active
$309,000
4
bds
|
2
ba
|
1,994
sqft
|
built
1914
726 Oak St N, Fargo, ND 58102
$-450
Cash flow
-7.6%
Cash-on-Cash Return
3.9%
Cap rate
0.7%
Rent to Value Ratio
Active
$825,000
5
bds
|
3
ba
|
4,530
sqft
|
built
2008
4703 Woodhaven St S, Fargo, ND 58104
$-1,682
Cash flow
-10.6%
Cash-on-Cash Return
3.2%
Cap rate
0.6%
Rent to Value Ratio
Active
$250,000
2
bds
|
2
ba
|
1,265
sqft
|
built
1980
2636 18th St S, Fargo, ND 58103
$-550
Cash flow
-11.5%
Cash-on-Cash Return
3.0%
Cap rate
0.6%
Rent to Value Ratio
Active
$200,000
2
bds
|
2
ba
|
1,620
sqft
|
built
1976
2440 15th St S, Fargo, ND 58103
$-282
Cash flow
-7.4%
Cash-on-Cash Return
4.0%
Cap rate
0.8%
Rent to Value Ratio
Active
$125,000
2
bds
|
1
ba
|
967
sqft
|
built
1978
1129 22nd St S, Fargo, ND 58103
$-46
Cash flow
-1.9%
Cash-on-Cash Return
5.2%
Cap rate
1.0%
Rent to Value Ratio
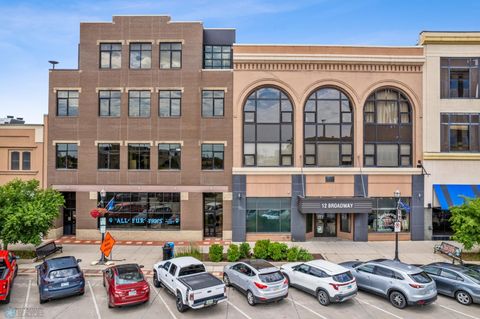
Active
$915,000
2
bds
|
2
ba
|
2,160
sqft
|
built
2004
12 Broadway N, Fargo, ND 58102
$-3,228
Cash flow
-18.4%
Cash-on-Cash Return
1.4%
Cap rate
0.3%
Rent to Value Ratio
Active
$779,900
4
bds
|
4
ba
|
3,750
sqft
|
built
2018
6728 Ashwood Loop, Fargo, ND 58104
$-2,937
Cash flow
-19.6%
Cash-on-Cash Return
1.2%
Cap rate
0.3%
Rent to Value Ratio
Active
$459,900
4
bds
|
3
ba
|
3,702
sqft
|
built
2003
1365 Highpointe Dr N, Fargo, ND 58102
$-1,343
Cash flow
-15.2%
Cash-on-Cash Return
2.2%
Cap rate
0.5%
Rent to Value Ratio
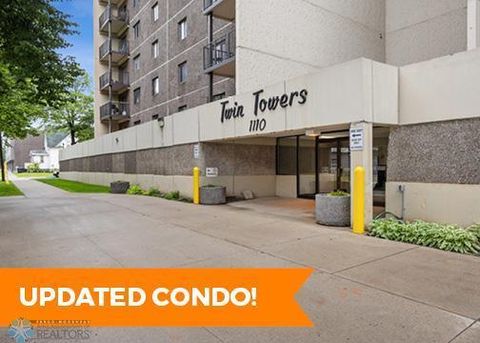
Active
$173,900
2
bds
|
2
ba
|
1,000
sqft
|
built
1978
1110 3rd Ave N, Fargo, ND 58102
$-17
Cash flow
-0.5%
Cash-on-Cash Return
5.6%
Cap rate
0.8%
Rent to Value Ratio