Fernandina Beach, FL Investment Properties for Sale
Browse homes for sale and investment properties in Fernandina Beach, FL. Refine your search by price, property type, or more.
Best cash flowing properties in Fernandina Beach, FL
Active
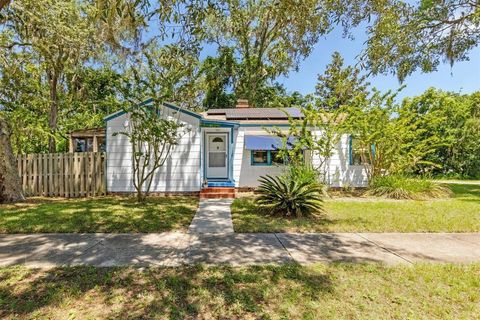
$475,000
3
bds
|
2
ba
|
1,360
sqft
|
built
1943
112 S 14th St, Fernandina Beach, FL 32034
$-767
Cash flow
-8.4%
Cash-on-Cash Return
4.2%
Cap rate
0.5%
Rent to Value Ratio
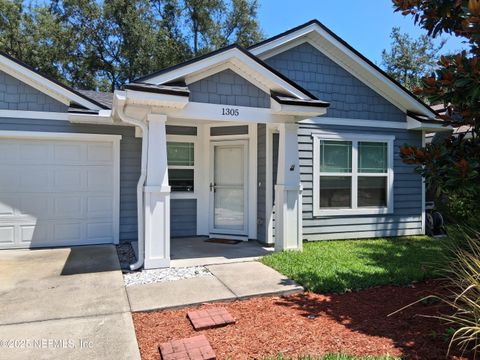
Active
$380,000
2
bds
|
2
ba
|
845
sqft
|
built
2021
1305 Hickory St, Fernandina Beach, FL 32034
$-913
Cash flow
-12.5%
Cash-on-Cash Return
3.3%
Cap rate
0.6%
Rent to Value Ratio
16 out of 213 properties for sale in Fernandina Beach, FL
Limited Results Shown
Create a free account, or log in to reveal all property listings and enjoy the complete experience.
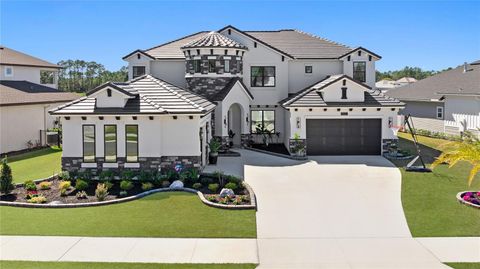
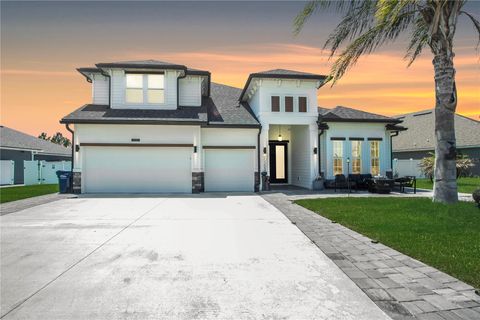
Active
$1,900,000
5
bds
|
4
ba
|
3,881
sqft
|
built
2023
95377 Wild Cherry Dr, Fernandina Beach, FL 32034
$-8,014
Cash flow
-22.0%
Cash-on-Cash Return
1.1%
Cap rate
0.2%
Rent to Value Ratio
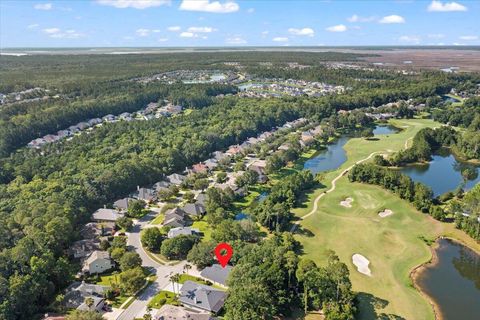
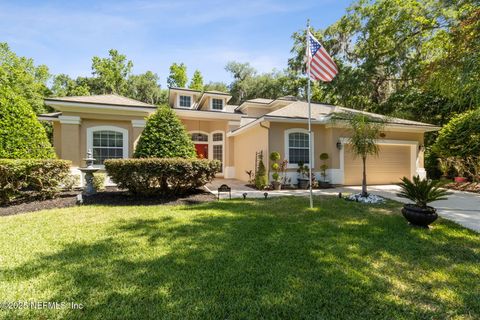
Active
$650,000
4
bds
|
3
ba
|
2,379
sqft
|
built
2004
85339 Amagansett Dr, Fernandina Beach, FL 32034
$-1,717
Cash flow
-13.8%
Cash-on-Cash Return
3.0%
Cap rate
0.5%
Rent to Value Ratio
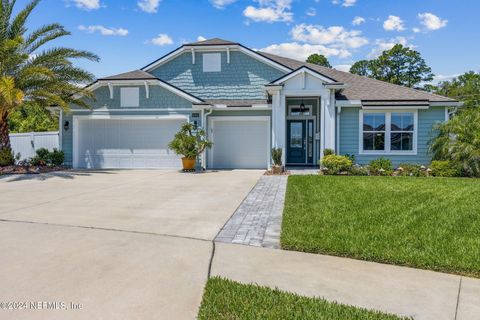
Active
$899,900
5
bds
|
3
ba
|
3,494
sqft
|
built
2000
94107 Limpkin Ln, Fernandina Beach, FL 32034
$-2,596
Cash flow
-15.1%
Cash-on-Cash Return
2.7%
Cap rate
0.4%
Rent to Value Ratio

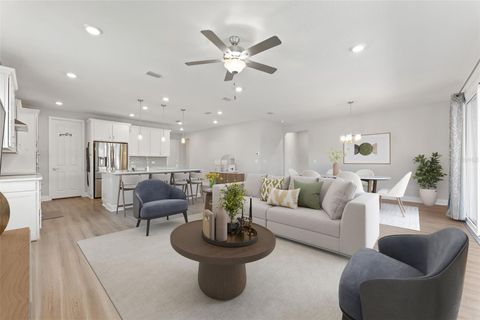
Active
$550,000
4
bds
|
3
ba
|
2,521
sqft
|
built
2016
32177 Juniper Parke Dr, Fernandina Beach, FL 32034
$-1,069
Cash flow
-10.1%
Cash-on-Cash Return
3.8%
Cap rate
0.6%
Rent to Value Ratio
Active
$1,195,000
4
bds
|
4
ba
|
3,370
sqft
|
built
2007
96197 Brady Point Rd, Fernandina Beach, FL 32034
$-2,984
Cash flow
-13.0%
Cash-on-Cash Return
3.2%
Cap rate
0.5%
Rent to Value Ratio
Active
$1,195,000
3
bds
|
3
ba
|
2,656
sqft
|
built
1996
2625 Long Boat Dr, Fernandina Beach, FL 32034
$-2,620
Cash flow
-11.4%
Cash-on-Cash Return
3.5%
Cap rate
0.5%
Rent to Value Ratio
Active
$3,200,000
3
bds
|
3
ba
|
3,230
sqft
|
built
2001
604 Ocean Club Ct, Fernandina Beach, FL 32034
$-14,503
Cash flow
-23.6%
Cash-on-Cash Return
0.7%
Cap rate
0.2%
Rent to Value Ratio
Active
$759,999
5
bds
|
5
ba
|
3,583
sqft
|
built
2021
95353 Orchid Blossom Trl, Fernandina Beach, FL 32034
$-1,897
Cash flow
-13.0%
Cash-on-Cash Return
3.2%
Cap rate
0.4%
Rent to Value Ratio
Active
$844,000
4
bds
|
4
ba
|
3,623
sqft
|
built
2003
85047 Sag Harbor Ct, Fernandina Beach, FL 32034
$-2,528
Cash flow
-15.6%
Cash-on-Cash Return
2.6%
Cap rate
0.4%
Rent to Value Ratio
Active
$985,000
4
bds
|
4
ba
|
2,798
sqft
|
built
2019
95343 Creekville Dr, Fernandina Beach, FL 32034
$-2,080
Cash flow
-11.0%
Cash-on-Cash Return
3.6%
Cap rate
0.5%
Rent to Value Ratio
Active
$745,000
3
bds
|
3
ba
|
2,120
sqft
|
built
2022
85507 Fall River Pkwy, Fernandina Beach, FL 32034
$-1,929
Cash flow
-13.5%
Cash-on-Cash Return
3.0%
Cap rate
0.5%
Rent to Value Ratio
Active
$669,999
3
bds
|
3
ba
|
3,381
sqft
|
built
2022
85431 Apple Canyon Ct, Fernandina Beach, FL 32034
$-1,769
Cash flow
-13.8%
Cash-on-Cash Return
3.0%
Cap rate
0.5%
Rent to Value Ratio
Active
$750,000
5
bds
|
6
ba
|
3,692
sqft
|
built
2011
85575 Sagaponack Dr, Fernandina Beach, FL 32034
$-998
Cash flow
-6.9%
Cash-on-Cash Return
4.6%
Cap rate
0.7%
Rent to Value Ratio

Active
$790,000
3
bds
|
3
ba
|
2,397
sqft
|
built
2020
88078 Marsh View Way, Fernandina Beach, FL 32034
$-1,563
Cash flow
-10.3%
Cash-on-Cash Return
3.8%
Cap rate
0.6%
Rent to Value Ratio