Bay County Investment Properties for Sale
Browse homes for sale and investment properties in Bay County. Refine your search by price, property type, or more.
Best cash flowing properties in Bay County

Active
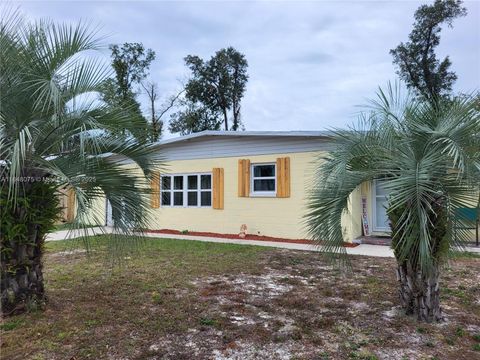
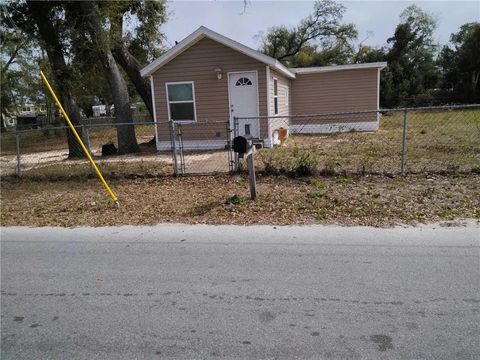
$85,000
3
bds
|
2
ba
|
1,066
sqft
|
built
1930
125 Linda Ave, Panama City, FL 32401
$577
Cash flow
35.4%
Cash-on-Cash Return
14.3%
Cap rate
2.0%
Rent to Value Ratio
Active
$190,000
3
bds
|
2
ba
|
0
sqft
|
built
2000
4712 Park Blvd, Panama City, FL 32404
$150
Cash flow
4.1%
Cash-on-Cash Return
7.1%
Cap rate
0.9%
Rent to Value Ratio
14 out of 15 properties for sale in Bay County
Limited Results Shown
Create a free account, or log in to reveal all property listings and enjoy the complete experience.
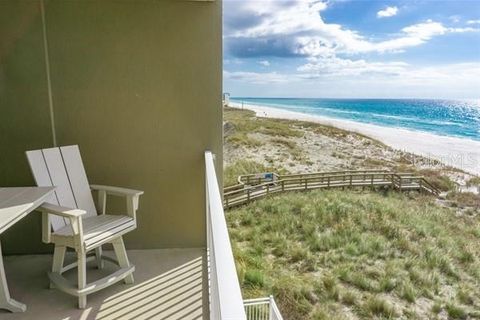
Active
$599,000
2
bds
|
2
ba
|
1,299
sqft
|
built
2007
14701 Front Beach Rd, Panama City Beach, FL 32413
$-3,347
Cash flow
-29.2%
Cash-on-Cash Return
-0.6%
Cap rate
0.4%
Rent to Value Ratio

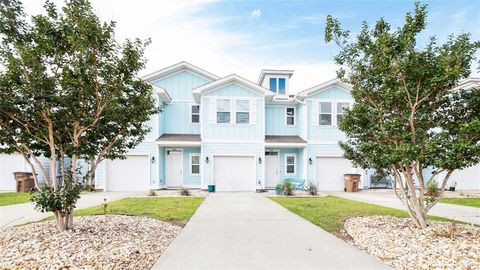
Active
$590,000
5
bds
|
3
ba
|
2,635
sqft
|
built
1993
120 Hombre Cir, Panama City Beach, FL 32407
$-969
Cash flow
-8.6%
Cash-on-Cash Return
4.2%
Cap rate
0.6%
Rent to Value Ratio
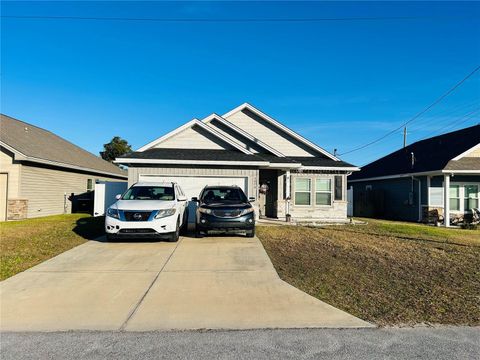
Active
$300,000
3
bds
|
3
ba
|
1,496
sqft
|
built
2018
7468 Shadow Lake Dr, Panama City Beach, FL 32407
$-697
Cash flow
-12.1%
Cash-on-Cash Return
3.4%
Cap rate
0.7%
Rent to Value Ratio
Active
$310,000
3
bds
|
2
ba
|
1,456
sqft
|
built
2019
3006 Brookins Rd, Panama City, FL 32405
$-303
Cash flow
-5.1%
Cash-on-Cash Return
5.0%
Cap rate
0.7%
Rent to Value Ratio

Active
$1,250,000
3
bds
|
4
ba
|
2,375
sqft
|
built
2006
5410 Gulf Dr, Panama City Beach, FL 32408
$-4,226
Cash flow
-17.6%
Cash-on-Cash Return
2.1%
Cap rate
0.3%
Rent to Value Ratio

Active
$278,978
4
bds
|
2
ba
|
2,860
sqft
|
built
1945
1000 Mc Kenzie Ave, Panama City, FL 32401
$-25
Cash flow
-0.5%
Cash-on-Cash Return
6.0%
Cap rate
0.9%
Rent to Value Ratio
Active
$650,000
3
bds
|
4
ba
|
1,820
sqft
|
built
2002
3101 Highway 98, Mexico Beach, FL 32456
$-1,837
Cash flow
-14.7%
Cash-on-Cash Return
2.8%
Cap rate
0.4%
Rent to Value Ratio

Active
$370,000
4
bds
|
3
ba
|
2,317
sqft
|
built
1993
508 Tracey Dr, Panama City, FL 32404
$-369
Cash flow
-5.2%
Cash-on-Cash Return
4.9%
Cap rate
0.7%
Rent to Value Ratio

Active
$3,175,000
4
bds
|
4
ba
|
2,517
sqft
|
built
1960
13011 Oleander Dr, Panama City Beach, FL 32407
$-13,350
Cash flow
-21.9%
Cash-on-Cash Return
1.1%
Cap rate
0.2%
Rent to Value Ratio
Active
$1,875,000
5
bds
|
5
ba
|
2,746
sqft
|
built
2023
19914 Front Beach Rd, Panama City Beach, FL 32413
$-6,631
Cash flow
-18.5%
Cash-on-Cash Return
1.9%
Cap rate
0.3%
Rent to Value Ratio
Active
$465,900
2
bds
|
3
ba
|
1,066
sqft
|
built
2007
9900 S Thomas Dr, Panama City, FL 32408
$-2,338
Cash flow
-26.2%
Cash-on-Cash Return
0.1%
Cap rate
0.5%
Rent to Value Ratio
Active
$150,000
3
bds
|
1
ba
|
0
sqft
|
built
1940
1628 Flower Ave, Panama City, FL 32405
$127
Cash flow
4.4%
Cash-on-Cash Return
7.2%
Cap rate
0.9%
Rent to Value Ratio