Clay County Investment Properties for Sale
Browse homes for sale and investment properties in Clay County. Refine your search by price, property type, or more.
Best cash flowing properties in Clay County
Active
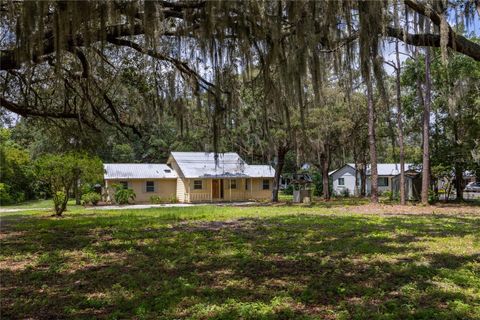
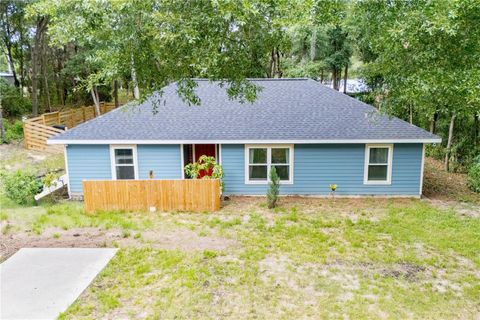
$190,000
3
bds
|
2
ba
|
1,690
sqft
|
built
1987
7980 State Road 100, Keystone Heights, FL 32656
$77
Cash flow
2.1%
Cash-on-Cash Return
6.6%
Cap rate
1.1%
Rent to Value Ratio

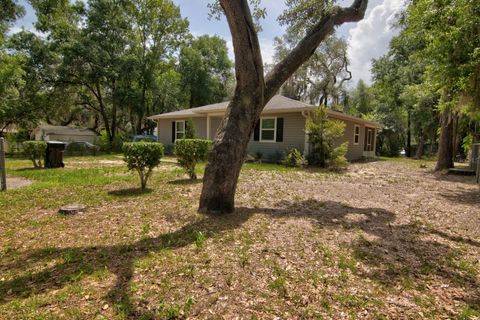
Active
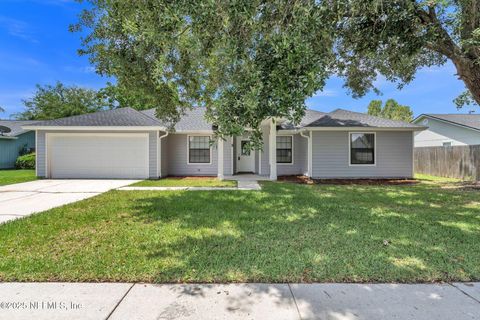
$349,900
3
bds
|
2
ba
|
1,867
sqft
|
built
2019
1124 Persimmon Dr, Middleburg, FL 32068
$-74
Cash flow
-1.1%
Cash-on-Cash Return
5.9%
Cap rate
0.7%
Rent to Value Ratio
65 out of 797 properties for sale in Clay County
Limited Results Shown
Create a free account, or log in to reveal all property listings and enjoy the complete experience.
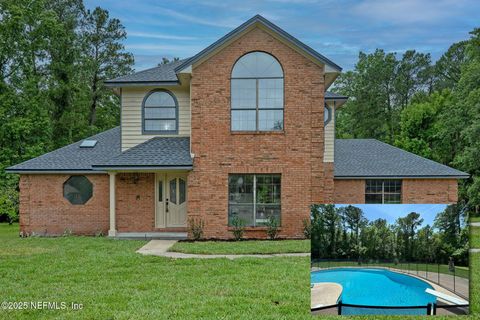
Active
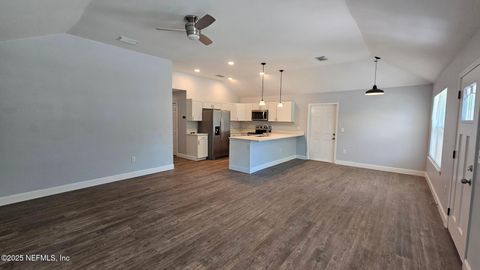
$325,000
4
bds
|
2
ba
|
1,629
sqft
|
built
1993
2114 Sahara Pl, Middleburg, FL 32068
$-634
Cash flow
-10.2%
Cash-on-Cash Return
3.8%
Cap rate
0.6%
Rent to Value Ratio

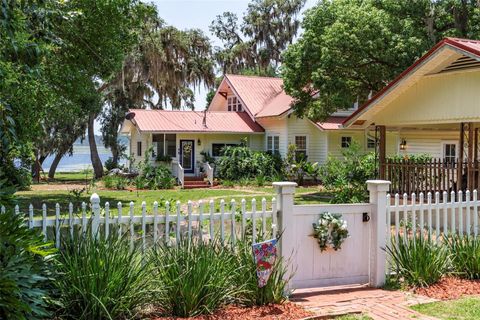
Active
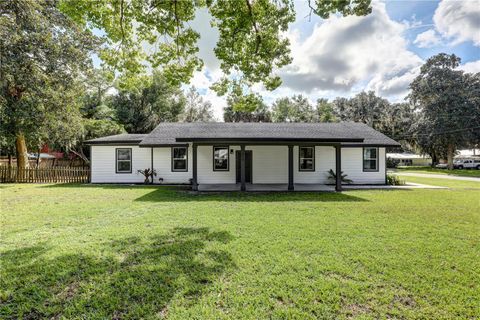
$199,000
2
bds
|
1
ba
|
876
sqft
|
built
1948
1505 Thomas St, Green Cove Springs, FL 32043
$-176
Cash flow
-4.6%
Cash-on-Cash Return
5.1%
Cap rate
0.7%
Rent to Value Ratio
Active
$339,500
3
bds
|
2
ba
|
1,587
sqft
|
built
2022
1978 Solomon St, Orange Park, FL 32073
$-684
Cash flow
-10.5%
Cash-on-Cash Return
3.7%
Cap rate
0.6%
Rent to Value Ratio

Active
$315,000
3
bds
|
2
ba
|
1,718
sqft
|
built
2007
464 Brentwood Ct, Green Cove Springs, FL 32043
$-372
Cash flow
-6.2%
Cash-on-Cash Return
4.7%
Cap rate
0.6%
Rent to Value Ratio
Active
$420,000
4
bds
|
3
ba
|
2,472
sqft
|
built
1950
316 S Cypress Ave, Green Cove Springs, FL 32043
$-656
Cash flow
-8.1%
Cash-on-Cash Return
4.3%
Cap rate
0.6%
Rent to Value Ratio

Active
$376,900
4
bds
|
3
ba
|
2,566
sqft
|
built
2003
222 Dover Bluff Dr, Orange Park, FL 32073
$-418
Cash flow
-5.8%
Cash-on-Cash Return
4.8%
Cap rate
0.7%
Rent to Value Ratio

Active
$337,000
4
bds
|
3
ba
|
2,206
sqft
|
built
2023
2271 Willow Glen Ln, Green Cove Springs, FL 32043
$-840
Cash flow
-13.0%
Cash-on-Cash Return
3.2%
Cap rate
0.7%
Rent to Value Ratio
Active
$399,000
5
bds
|
3
ba
|
2,612
sqft
|
built
2016
3410 Ridgeview Dr, Green Cove Springs, FL 32043
$-398
Cash flow
-5.2%
Cash-on-Cash Return
5.0%
Cap rate
0.6%
Rent to Value Ratio
Active
$799,000
3
bds
|
3
ba
|
3,637
sqft
|
built
2005
7120 Gas Line Rd, Keystone Heights, FL 32656
$-1,666
Cash flow
-10.9%
Cash-on-Cash Return
3.6%
Cap rate
0.5%
Rent to Value Ratio
Active
$539,900
4
bds
|
4
ba
|
2,653
sqft
|
built
2009
7634 Aztec Ct, Keystone Heights, FL 32656
$-864
Cash flow
-8.3%
Cash-on-Cash Return
4.2%
Cap rate
0.5%
Rent to Value Ratio

Active
$494,999
5
bds
|
4
ba
|
2,884
sqft
|
built
2003
2032 Trailing Pines Way, Fleming Island, FL 32003
$-956
Cash flow
-10.1%
Cash-on-Cash Return
3.8%
Cap rate
0.6%
Rent to Value Ratio
Active
$387,000
5
bds
|
3
ba
|
2,766
sqft
|
built
2007
2727 Wood Stork Trl, Orange Park, FL 32073
$-724
Cash flow
-9.8%
Cash-on-Cash Return
3.9%
Cap rate
0.6%
Rent to Value Ratio
Active
$239,900
3
bds
|
2
ba
|
1,242
sqft
|
built
2004
5784 S Crater Lake Cir, Keystone Heights, FL 32656
$-128
Cash flow
-2.8%
Cash-on-Cash Return
5.5%
Cap rate
0.8%
Rent to Value Ratio
Active
$575,000
4
bds
|
4
ba
|
2,716
sqft
|
built
2000
2518 Willow Creek Dr, Fleming Island, FL 32003
$-1,597
Cash flow
-14.5%
Cash-on-Cash Return
2.8%
Cap rate
0.5%
Rent to Value Ratio
Active
$540,000
4
bds
|
2
ba
|
2,020
sqft
|
built
1974
8048 County Line Rd, Melrose, FL 32666
$-1,452
Cash flow
-14.0%
Cash-on-Cash Return
2.9%
Cap rate
0.4%
Rent to Value Ratio

Active
$574,990
5
bds
|
4
ba
|
3,518
sqft
|
built
2024
2113 Featheredge Way, Middleburg, FL 32068
$-942
Cash flow
-8.5%
Cash-on-Cash Return
4.2%
Cap rate
0.6%
Rent to Value Ratio

Active
$485,000
4
bds
|
3
ba
|
2,735
sqft
|
built
2004
1726 Chatham Village Dr, Fleming Island, FL 32003
$-1,031
Cash flow
-11.1%
Cash-on-Cash Return
3.6%
Cap rate
0.6%
Rent to Value Ratio

Active
$589,000
3
bds
|
3
ba
|
2,174
sqft
|
built
1977
1799 County Road 209 B, Green Cove Springs, FL 32043
$-1,314
Cash flow
-11.6%
Cash-on-Cash Return
3.5%
Cap rate
0.5%
Rent to Value Ratio

Active
$499,900
5
bds
|
3
ba
|
3,149
sqft
|
built
2008
1300 Coopers Hawk Way, Middleburg, FL 32068
$-1,227
Cash flow
-12.8%
Cash-on-Cash Return
3.2%
Cap rate
0.6%
Rent to Value Ratio
Active
$279,000
3
bds
|
3
ba
|
1,634
sqft
|
built
2017
3268 Chestnut Ridge Way, Orange Park, FL 32065
$-599
Cash flow
-11.2%
Cash-on-Cash Return
3.6%
Cap rate
0.7%
Rent to Value Ratio
Active
$254,000
3
bds
|
2
ba
|
1,134
sqft
|
built
2005
3211 Ryans Ct, Green Cove Springs, FL 32043
$-341
Cash flow
-7.0%
Cash-on-Cash Return
4.5%
Cap rate
0.7%
Rent to Value Ratio
Active
$419,000
4
bds
|
3
ba
|
2,500
sqft
|
built
1984
2960 Black Creek Dr, Middleburg, FL 32068
$-1,225
Cash flow
-15.3%
Cash-on-Cash Return
2.6%
Cap rate
0.4%
Rent to Value Ratio
Active
$625,000
5
bds
|
3
ba
|
2,700
sqft
|
built
1982
8290 Melrose Rd, Melrose, FL 32666
$-1,811
Cash flow
-15.1%
Cash-on-Cash Return
2.7%
Cap rate
0.4%
Rent to Value Ratio
Active
$288,000
3
bds
|
2
ba
|
1,480
sqft
|
built
2000
1990 Eclipse Dr, Middleburg, FL 32068
$-598
Cash flow
-10.8%
Cash-on-Cash Return
3.7%
Cap rate
0.6%
Rent to Value Ratio

Active
$225,000
3
bds
|
3
ba
|
1,500
sqft
|
built
2013
2754 Hollybrook Ln, Orange Park, FL 32073
$-253
Cash flow
-5.9%
Cash-on-Cash Return
4.8%
Cap rate
0.8%
Rent to Value Ratio

Active
$335,000
3
bds
|
2
ba
|
1,757
sqft
|
built
1985
2396 Stonebridge Dr, Orange Park, FL 32065
$-362
Cash flow
-5.6%
Cash-on-Cash Return
4.9%
Cap rate
0.7%
Rent to Value Ratio
Active
$305,000
3
bds
|
2
ba
|
1,276
sqft
|
built
2022
250 SW Garden St, Keystone Heights, FL 32656
$-883
Cash flow
-15.1%
Cash-on-Cash Return
2.7%
Cap rate
0.5%
Rent to Value Ratio
Active
$320,000
2
bds
|
2
ba
|
1,200
sqft
|
built
2020
633 SW Magnolia Ave, Keystone Heights, FL 32656
$-642
Cash flow
-10.5%
Cash-on-Cash Return
3.7%
Cap rate
0.5%
Rent to Value Ratio

Active
$408,000
3
bds
|
2
ba
|
1,828
sqft
|
built
2017
6228 Blue Marlin Dr, Keystone Heights, FL 32656
$-618
Cash flow
-7.9%
Cash-on-Cash Return
4.3%
Cap rate
0.6%
Rent to Value Ratio
Active
$483,900
4
bds
|
4
ba
|
2,550
sqft
|
built
1987
668 Fingal Dr, Orange Park, FL 32073
$-1,503
Cash flow
-16.2%
Cash-on-Cash Return
2.4%
Cap rate
0.5%
Rent to Value Ratio

Active
$465,000
5
bds
|
5
ba
|
3,352
sqft
|
built
2005
529 Amberwood Ct, Orange Park, FL 32065
$-857
Cash flow
-9.6%
Cash-on-Cash Return
3.9%
Cap rate
0.6%
Rent to Value Ratio
Active
$798,500
5
bds
|
4
ba
|
3,068
sqft
|
built
1950
561 SE Lakeview Dr, Keystone Heights, FL 32656
$-2,483
Cash flow
-16.2%
Cash-on-Cash Return
2.4%
Cap rate
0.4%
Rent to Value Ratio
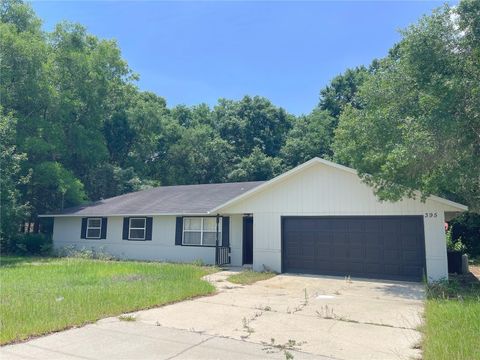
Active
$229,000
3
bds
|
2
ba
|
1,728
sqft
|
built
1994
395 SW Grove St, Keystone Heights, FL 32656
$-121
Cash flow
-2.8%
Cash-on-Cash Return
5.5%
Cap rate
0.9%
Rent to Value Ratio

Active
$174,900
3
bds
|
3
ba
|
1,343
sqft
|
built
1982
503 Kettering Way, Orange Park, FL 32073
$-386
Cash flow
-11.5%
Cash-on-Cash Return
3.5%
Cap rate
0.9%
Rent to Value Ratio
Active
$310,000
4
bds
|
2
ba
|
1,695
sqft
|
built
2014
724 Sunny Stroll Dr, Middleburg, FL 32068
$-443
Cash flow
-7.5%
Cash-on-Cash Return
4.4%
Cap rate
0.6%
Rent to Value Ratio
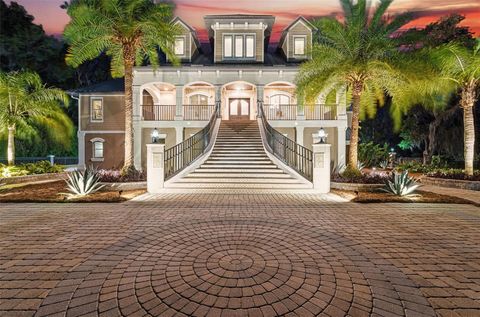
Active
$3,880,000
6
bds
|
6
ba
|
6,780
sqft
|
built
2009
140 Monterey Bay Ln, Green Cove Springs, FL 32043
$-17,162
Cash flow
-23.1%
Cash-on-Cash Return
0.8%
Cap rate
0.2%
Rent to Value Ratio

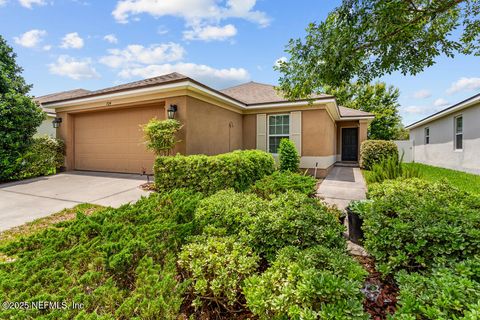
Active
$342,400
4
bds
|
2
ba
|
1,850
sqft
|
built
2014
3880 Great Falls Loop, Middleburg, FL 32068
$-660
Cash flow
-10.1%
Cash-on-Cash Return
3.8%
Cap rate
0.6%
Rent to Value Ratio
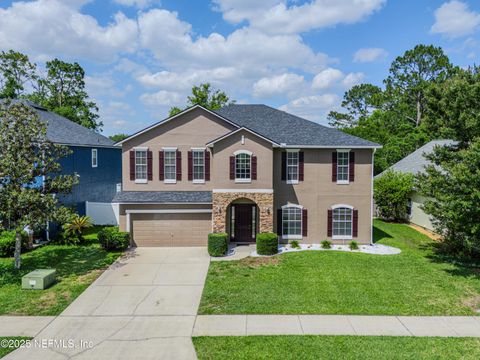
Active
$498,200
5
bds
|
3
ba
|
3,622
sqft
|
built
2005
2622 Kermit Ct, Orange Park, FL 32065
$-680
Cash flow
-7.1%
Cash-on-Cash Return
4.5%
Cap rate
0.6%
Rent to Value Ratio