Clay County Investment Properties for Sale
Browse homes for sale and investment properties in Clay County. Refine your search by price, property type, or more.
Best cash flowing properties in Clay County
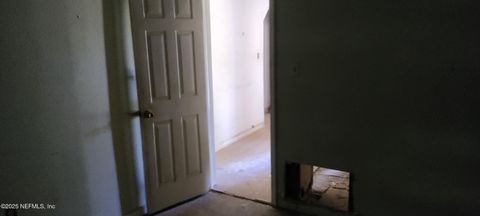
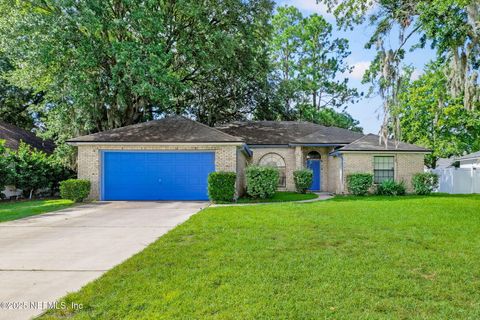
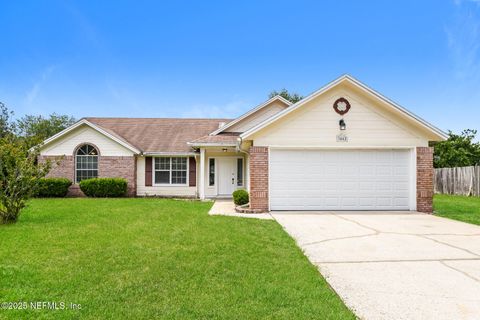
Active
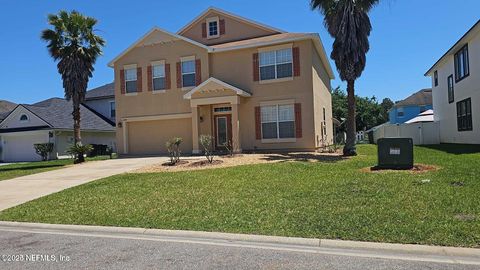
$159,000
2
bds
|
1
ba
|
0
sqft
|
built
1970
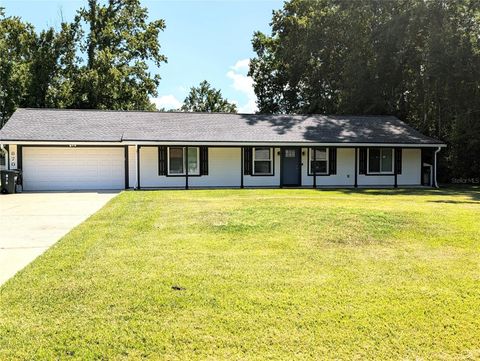
428 S Vermont Ave, Green Cove Springs, FL 32043
$359
Cash flow
11.8%
Cash-on-Cash Return
8.9%
Cap rate
1.1%
Rent to Value Ratio

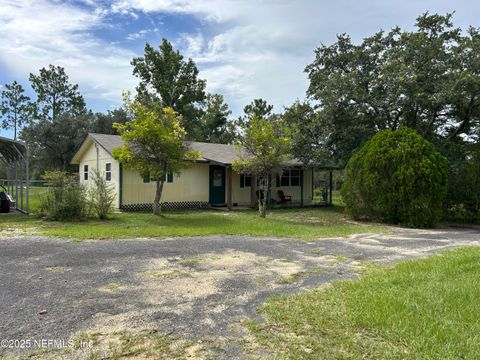
Active
$349,900
3
bds
|
2
ba
|
1,867
sqft
|
built
2019
1124 Persimmon Dr, Middleburg, FL 32068
$-74
Cash flow
-1.1%
Cash-on-Cash Return
5.9%
Cap rate
0.7%
Rent to Value Ratio
67 out of 578 properties for sale in Clay County
Limited Results Shown
Create a free account, or log in to reveal all property listings and enjoy the complete experience.

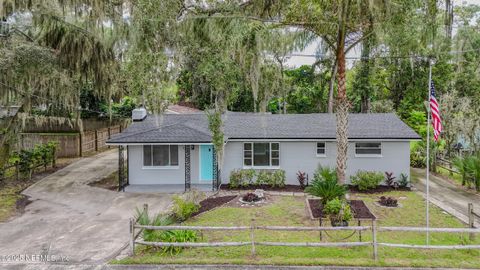
Active
$395,000
4
bds
|
2
ba
|
1,896
sqft
|
built
2002
3565 Eds Ct, Green Cove Springs, FL 32043
$-687
Cash flow
-9.1%
Cash-on-Cash Return
4.1%
Cap rate
0.6%
Rent to Value Ratio
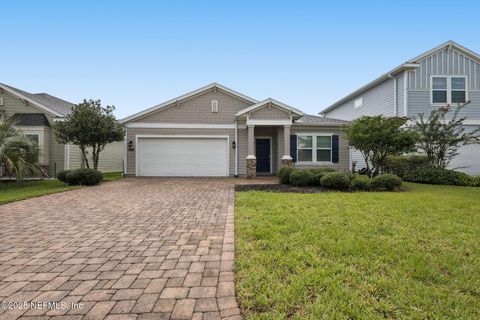
Active
$240,000
2
bds
|
1
ba
|
1,056
sqft
|
built
1984
6053 State Road 21, Keystone Heights, FL 32656
$-87
Cash flow
-1.9%
Cash-on-Cash Return
5.7%
Cap rate
0.8%
Rent to Value Ratio
Active
$315,000
4
bds
|
2
ba
|
1,605
sqft
|
built
1965
249 Mercury Dr, Orange Park, FL 32073
$-627
Cash flow
-10.4%
Cash-on-Cash Return
3.8%
Cap rate
0.6%
Rent to Value Ratio
Active
$359,900
3
bds
|
2
ba
|
2,126
sqft
|
built
2017
3858 Arbor Mill Cir, Orange Park, FL 32065
$-824
Cash flow
-11.9%
Cash-on-Cash Return
3.4%
Cap rate
0.6%
Rent to Value Ratio

Active
$724,000
4
bds
|
3
ba
|
2,398
sqft
|
built
2001
1501 Waterbridge Ct, Fleming Island, FL 32003
$-2,131
Cash flow
-15.4%
Cash-on-Cash Return
2.6%
Cap rate
0.4%
Rent to Value Ratio
Active
$339,500
3
bds
|
2
ba
|
1,587
sqft
|
built
2022
1978 Solomon St, Orange Park, FL 32073
$-684
Cash flow
-10.5%
Cash-on-Cash Return
3.7%
Cap rate
0.6%
Rent to Value Ratio

Active
$265,000
4
bds
|
2
ba
|
1,694
sqft
|
built
1972
489 Clermont Ave S, Orange Park, FL 32073
$-345
Cash flow
-6.8%
Cash-on-Cash Return
4.6%
Cap rate
0.8%
Rent to Value Ratio

Active
$315,000
3
bds
|
2
ba
|
1,718
sqft
|
built
2007
464 Brentwood Ct, Green Cove Springs, FL 32043
$-372
Cash flow
-6.2%
Cash-on-Cash Return
4.7%
Cap rate
0.6%
Rent to Value Ratio
Active
$774,900
3
bds
|
3
ba
|
2,105
sqft
|
built
1977
3793 Forest Dr, Middleburg, FL 32068
$-2,592
Cash flow
-17.5%
Cash-on-Cash Return
2.1%
Cap rate
0.3%
Rent to Value Ratio
Active
$420,000
4
bds
|
3
ba
|
2,472
sqft
|
built
1950
316 S Cypress Ave, Green Cove Springs, FL 32043
$-656
Cash flow
-8.1%
Cash-on-Cash Return
4.3%
Cap rate
0.6%
Rent to Value Ratio
Active
$318,900
3
bds
|
2
ba
|
1,707
sqft
|
built
2018
337 Saint James Way, Orange Park, FL 32065
$-558
Cash flow
-9.1%
Cash-on-Cash Return
4.0%
Cap rate
0.7%
Rent to Value Ratio

Active
$750,000
3
bds
|
3
ba
|
1,816
sqft
|
built
1974
2050 Laurel Dr, Middleburg, FL 32068
$-2,912
Cash flow
-20.3%
Cash-on-Cash Return
1.5%
Cap rate
0.3%
Rent to Value Ratio

Active
$376,900
4
bds
|
3
ba
|
2,566
sqft
|
built
2003
222 Dover Bluff Dr, Orange Park, FL 32073
$-418
Cash flow
-5.8%
Cash-on-Cash Return
4.8%
Cap rate
0.7%
Rent to Value Ratio

Active
$337,000
4
bds
|
3
ba
|
2,206
sqft
|
built
2023
2271 Willow Glen Ln, Green Cove Springs, FL 32043
$-840
Cash flow
-13.0%
Cash-on-Cash Return
3.2%
Cap rate
0.7%
Rent to Value Ratio
Active
$399,000
5
bds
|
3
ba
|
2,612
sqft
|
built
2016
3410 Ridgeview Dr, Green Cove Springs, FL 32043
$-398
Cash flow
-5.2%
Cash-on-Cash Return
5.0%
Cap rate
0.6%
Rent to Value Ratio
Active
$425,000
4
bds
|
3
ba
|
2,147
sqft
|
built
1982
2471 Charwood Ct, Orange Park, FL 32065
$-987
Cash flow
-12.1%
Cash-on-Cash Return
3.4%
Cap rate
0.5%
Rent to Value Ratio
Active
$539,900
4
bds
|
4
ba
|
2,653
sqft
|
built
2009
7634 Aztec Ct, Keystone Heights, FL 32656
$-864
Cash flow
-8.3%
Cash-on-Cash Return
4.2%
Cap rate
0.5%
Rent to Value Ratio
Active
$799,000
3
bds
|
3
ba
|
3,637
sqft
|
built
2005
7120 Gas Line Rd, Keystone Heights, FL 32656
$-1,666
Cash flow
-10.9%
Cash-on-Cash Return
3.6%
Cap rate
0.5%
Rent to Value Ratio
Active
$387,000
5
bds
|
3
ba
|
2,766
sqft
|
built
2007
2727 Wood Stork Trl, Orange Park, FL 32073
$-724
Cash flow
-9.8%
Cash-on-Cash Return
3.9%
Cap rate
0.6%
Rent to Value Ratio
Active
$239,900
3
bds
|
2
ba
|
1,242
sqft
|
built
2004
5784 S Crater Lake Cir, Keystone Heights, FL 32656
$-128
Cash flow
-2.8%
Cash-on-Cash Return
5.5%
Cap rate
0.8%
Rent to Value Ratio
Active
$575,000
4
bds
|
4
ba
|
2,716
sqft
|
built
2000
2518 Willow Creek Dr, Fleming Island, FL 32003
$-1,597
Cash flow
-14.5%
Cash-on-Cash Return
2.8%
Cap rate
0.5%
Rent to Value Ratio
Active
$510,000
4
bds
|
2
ba
|
2,020
sqft
|
built
1974
8048 County Line Rd, Melrose, FL 32666
$-1,298
Cash flow
-13.3%
Cash-on-Cash Return
3.1%
Cap rate
0.4%
Rent to Value Ratio
Active
$364,900
3
bds
|
2
ba
|
1,400
sqft
|
built
1989
870 Hibernia Forest Dr, Fleming Island, FL 32003
$-775
Cash flow
-11.1%
Cash-on-Cash Return
3.6%
Cap rate
0.5%
Rent to Value Ratio

Active
$574,990
5
bds
|
4
ba
|
3,518
sqft
|
built
2024
2113 Featheredge Way, Middleburg, FL 32068
$-942
Cash flow
-8.5%
Cash-on-Cash Return
4.2%
Cap rate
0.6%
Rent to Value Ratio
Active
$489,000
3
bds
|
3
ba
|
2,686
sqft
|
built
2002
1896 Chatham Village Dr, Fleming Island, FL 32003
$-1,081
Cash flow
-11.5%
Cash-on-Cash Return
3.5%
Cap rate
0.6%
Rent to Value Ratio
Active
$399,000
3
bds
|
3
ba
|
1,692
sqft
|
built
1971
6849 SE 35th St, Keystone Heights, FL 32656
$-664
Cash flow
-8.7%
Cash-on-Cash Return
4.2%
Cap rate
0.5%
Rent to Value Ratio
Active
$350,000
4
bds
|
2
ba
|
2,100
sqft
|
built
1976
226 Quince Ct, Orange Park, FL 32073
$-677
Cash flow
-10.1%
Cash-on-Cash Return
3.8%
Cap rate
0.5%
Rent to Value Ratio
Active
$349,000
4
bds
|
2
ba
|
1,947
sqft
|
built
1999
2975 Golden Pond Blvd, Orange Park, FL 32073
$-425
Cash flow
-6.4%
Cash-on-Cash Return
4.7%
Cap rate
0.6%
Rent to Value Ratio
Active
$725,000
3
bds
|
3
ba
|
2,356
sqft
|
built
1974
831 Arthur Moore Dr, Green Cove Springs, FL 32043
$-2,288
Cash flow
-16.5%
Cash-on-Cash Return
2.4%
Cap rate
0.4%
Rent to Value Ratio
Active
$485,000
5
bds
|
3
ba
|
2,434
sqft
|
built
1983
2852 Circle Ridge Dr, Orange Park, FL 32065
$-960
Cash flow
-10.3%
Cash-on-Cash Return
3.8%
Cap rate
0.5%
Rent to Value Ratio

Active
$589,000
3
bds
|
3
ba
|
2,174
sqft
|
built
1977
1799 County Road 209 B, Green Cove Springs, FL 32043
$-1,314
Cash flow
-11.6%
Cash-on-Cash Return
3.5%
Cap rate
0.5%
Rent to Value Ratio

Active
$499,900
5
bds
|
3
ba
|
3,149
sqft
|
built
2008
1300 Coopers Hawk Way, Middleburg, FL 32068
$-1,227
Cash flow
-12.8%
Cash-on-Cash Return
3.2%
Cap rate
0.6%
Rent to Value Ratio
Active
$375,000
4
bds
|
2
ba
|
2,388
sqft
|
built
1967
2741 Birchwood Dr, Orange Park, FL 32073
$-609
Cash flow
-8.5%
Cash-on-Cash Return
4.2%
Cap rate
0.6%
Rent to Value Ratio
Active
$297,000
3
bds
|
2
ba
|
1,803
sqft
|
built
1990
3442 Deerfield Pointe Dr, Orange Park, FL 32073
$-671
Cash flow
-11.8%
Cash-on-Cash Return
3.4%
Cap rate
0.6%
Rent to Value Ratio
Active
$254,000
3
bds
|
2
ba
|
1,134
sqft
|
built
2005
3211 Ryans Ct, Green Cove Springs, FL 32043
$-341
Cash flow
-7.0%
Cash-on-Cash Return
4.5%
Cap rate
0.7%
Rent to Value Ratio
Active
$419,000
4
bds
|
3
ba
|
2,500
sqft
|
built
1984
2960 Black Creek Dr, Middleburg, FL 32068
$-1,225
Cash flow
-15.3%
Cash-on-Cash Return
2.6%
Cap rate
0.4%
Rent to Value Ratio
Active
$283,000
3
bds
|
2
ba
|
1,248
sqft
|
built
1969
583 Clermont Ave S, Orange Park, FL 32073
$-562
Cash flow
-10.4%
Cash-on-Cash Return
3.8%
Cap rate
0.6%
Rent to Value Ratio
Active
$625,000
5
bds
|
3
ba
|
2,700
sqft
|
built
1982
8290 Melrose Rd, Melrose, FL 32666
$-1,811
Cash flow
-15.1%
Cash-on-Cash Return
2.7%
Cap rate
0.4%
Rent to Value Ratio