Levy County Investment Properties for Sale
Browse homes for sale and investment properties in Levy County. Refine your search by price, property type, or more.
Best cash flowing properties in Levy County

Active
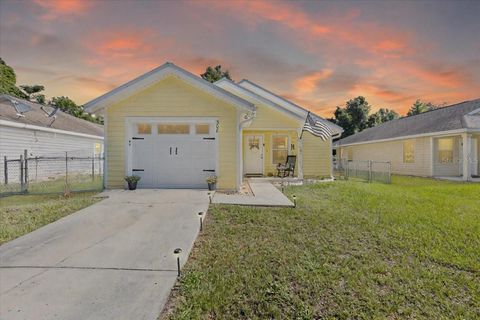
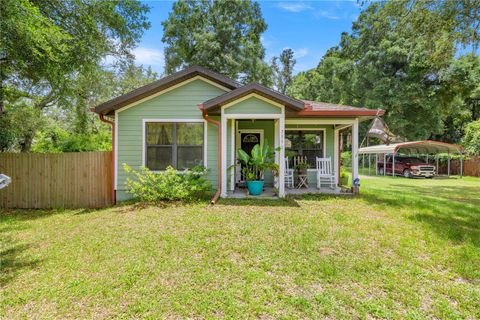
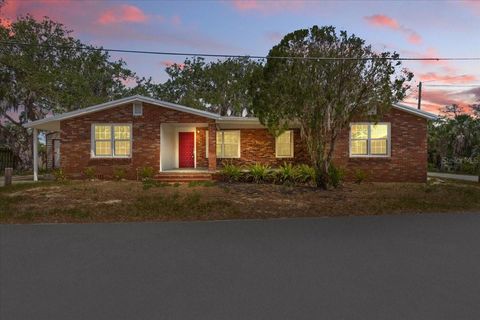
$149,900
3
bds
|
2
ba
|
1,670
sqft
|
built
1950
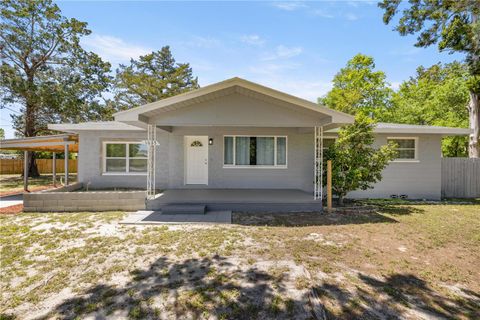
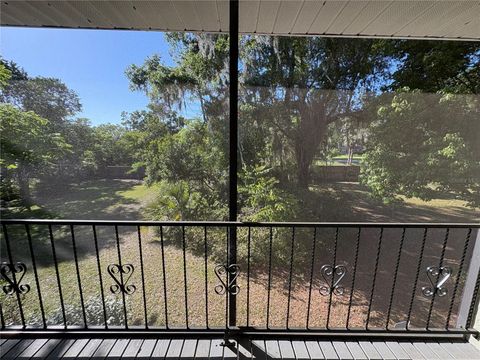
171 NE 2nd St, Williston, FL 32696
$404
Cash flow
14.1%
Cash-on-Cash Return
9.4%
Cap rate
1.3%
Rent to Value Ratio
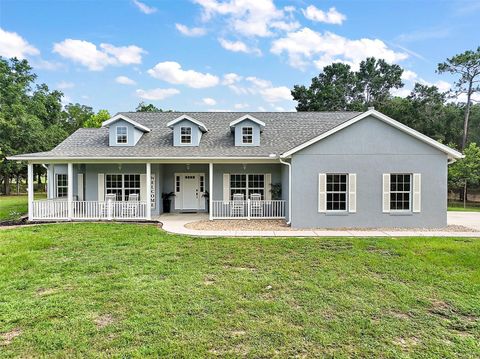
Active
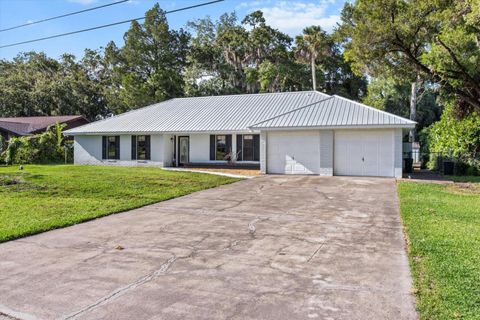
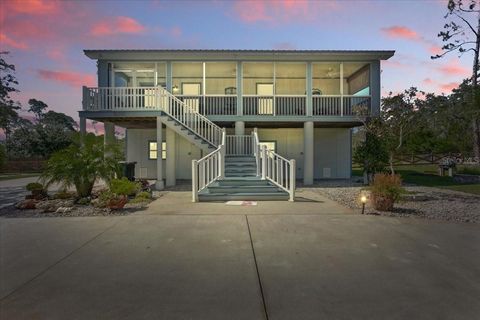
$275,000
3
bds
|
2
ba
|
2,590
sqft
|
built
1991
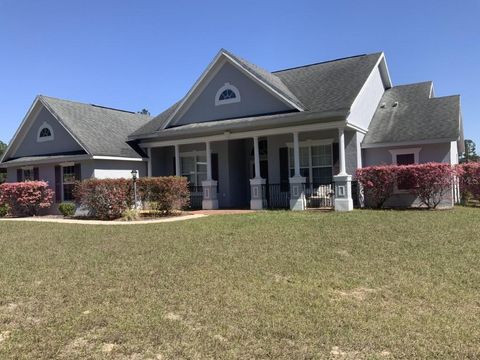
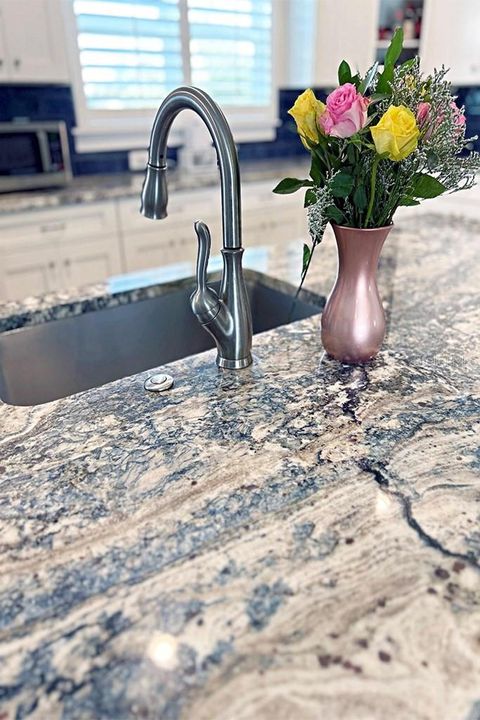
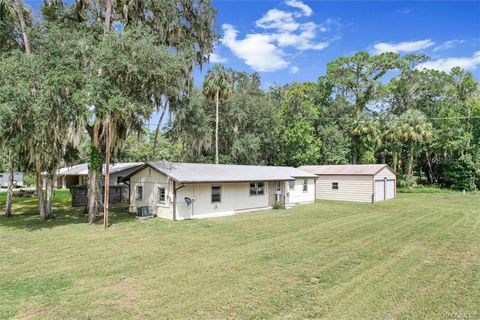
171 W Country Club Dr, Williston, FL 32696
$171
Cash flow
3.2%
Cash-on-Cash Return
6.9%
Cap rate
0.9%
Rent to Value Ratio
54 out of 120 properties for sale in Levy County
Limited Results Shown
Create a free account, or log in to reveal all property listings and enjoy the complete experience.
Active
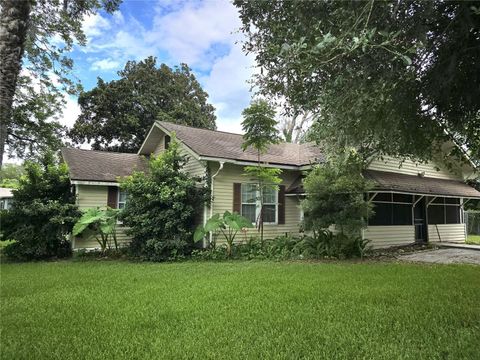
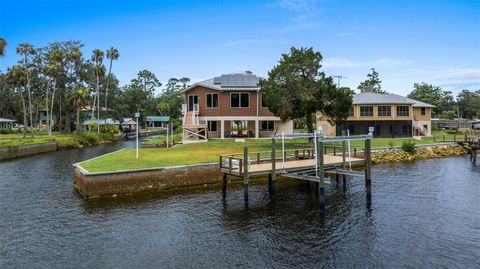
$849,000
3
bds
|
3
ba
|
2,091
sqft
|
built
2007
11951 SE 130th Ct, Dunnellon, FL 34431
$-2,349
Cash flow
-14.4%
Cash-on-Cash Return
2.8%
Cap rate
0.4%
Rent to Value Ratio

Active
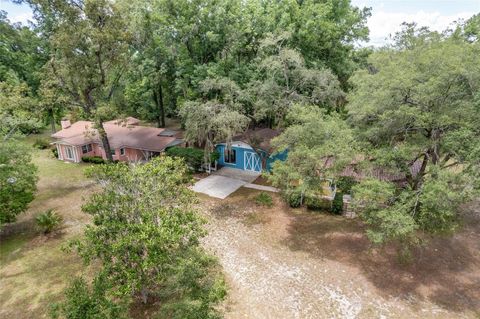
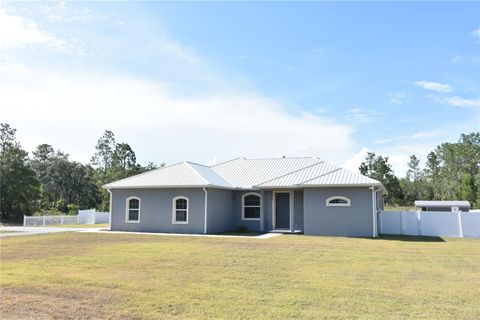
$815,000
3
bds
|
3
ba
|
2,741
sqft
|
built
2007
6351 SE 140th Ave, Morriston, FL 32668
$-2,445
Cash flow
-15.7%
Cash-on-Cash Return
2.5%
Cap rate
0.4%
Rent to Value Ratio

Active
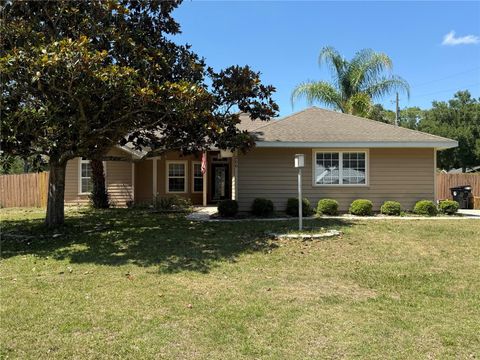
$335,000
3
bds
|
2
ba
|
1,640
sqft
|
built
1971
11624 SE 196th Ln, Dunnellon, FL 34431
$-674
Cash flow
-10.5%
Cash-on-Cash Return
3.7%
Cap rate
0.6%
Rent to Value Ratio
Active
$625,000
3
bds
|
2
ba
|
2,196
sqft
|
built
2003
2830 NE 180th Ave, Williston, FL 32696
$-1,338
Cash flow
-11.2%
Cash-on-Cash Return
3.6%
Cap rate
0.5%
Rent to Value Ratio
Active
$375,000
3
bds
|
3
ba
|
2,016
sqft
|
built
2008
7290 NE 106th Ter, Bronson, FL 32621
$-340
Cash flow
-4.7%
Cash-on-Cash Return
5.1%
Cap rate
0.7%
Rent to Value Ratio

Active
$264,900
3
bds
|
2
ba
|
1,404
sqft
|
built
2001
704 SE 2nd St, Williston, FL 32696
$-37
Cash flow
-0.7%
Cash-on-Cash Return
6.0%
Cap rate
0.8%
Rent to Value Ratio
Active
$949,900
3
bds
|
2
ba
|
2,117
sqft
|
built
2006
16231 SE 80th St, Morriston, FL 32668
$-3,075
Cash flow
-16.9%
Cash-on-Cash Return
2.3%
Cap rate
0.3%
Rent to Value Ratio
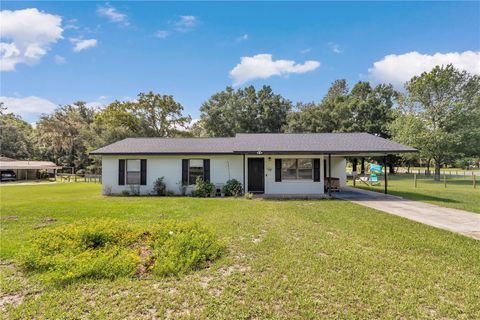
Active
$249,000
3
bds
|
2
ba
|
1,056
sqft
|
built
1982
16550 NE 26th Pl, Williston, FL 32696
$-292
Cash flow
-6.1%
Cash-on-Cash Return
4.7%
Cap rate
0.7%
Rent to Value Ratio
Active
$429,000
3
bds
|
2
ba
|
1,617
sqft
|
built
1977
8991 NW 115th St, Chiefland, FL 32626
$-925
Cash flow
-11.2%
Cash-on-Cash Return
3.6%
Cap rate
0.5%
Rent to Value Ratio

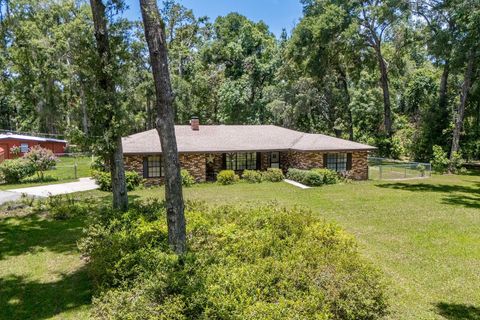
Active
$350,000
3
bds
|
2
ba
|
2,310
sqft
|
built
1990
531 NE 151st Ter, Williston, FL 32696
$139
Cash flow
2.1%
Cash-on-Cash Return
6.6%
Cap rate
0.8%
Rent to Value Ratio
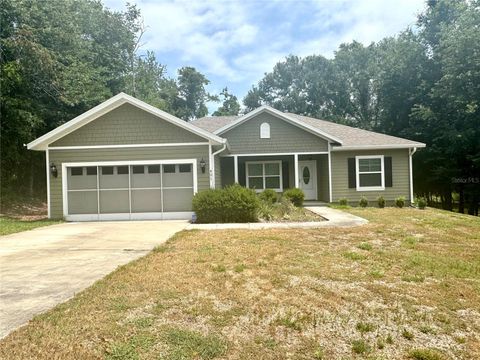
Active
$304,000
3
bds
|
2
ba
|
1,584
sqft
|
built
2021
451 NE 151st Ter, Williston, FL 32696
$-341
Cash flow
-5.9%
Cash-on-Cash Return
4.8%
Cap rate
0.7%
Rent to Value Ratio
Active
$217,000
3
bds
|
2
ba
|
1,163
sqft
|
built
2008
308 SW 2nd Ave, Chiefland, FL 32626
$-109
Cash flow
-2.6%
Cash-on-Cash Return
5.5%
Cap rate
0.8%
Rent to Value Ratio
Active
$450,000
3
bds
|
2
ba
|
1,853
sqft
|
built
1984
18 Palm Circle Dr, Inglis, FL 34449
$-677
Cash flow
-7.8%
Cash-on-Cash Return
4.3%
Cap rate
0.6%
Rent to Value Ratio
Active
$179,000
2
bds
|
1
ba
|
1,252
sqft
|
built
1940
41 NW 5th St, Williston, FL 32696
$-120
Cash flow
-3.5%
Cash-on-Cash Return
5.3%
Cap rate
0.8%
Rent to Value Ratio
Active
$397,500
5
bds
|
3
ba
|
2,427
sqft
|
built
1972
10490 NW 101st St, Chiefland, FL 32626
$0
Cash flow
n/a
Cash-on-Cash Return
n/a
Cap rate
n/a
Rent to Value Ratio
Active
$375,000
4
bds
|
2
ba
|
1,764
sqft
|
built
1979
261 Ishie Ave, Bronson, FL 32621
$-654
Cash flow
-9.1%
Cash-on-Cash Return
4.1%
Cap rate
0.6%
Rent to Value Ratio
Active
$290,000
3
bds
|
2
ba
|
1,500
sqft
|
built
2021
15591 NE 14th Pl, Williston, FL 32696
$-38
Cash flow
-0.7%
Cash-on-Cash Return
6.0%
Cap rate
0.8%
Rent to Value Ratio
Active
$249,900
3
bds
|
2
ba
|
1,370
sqft
|
built
2000
8311 NW 174th Pl, Fanning Springs, FL 32693
$-203
Cash flow
-4.2%
Cash-on-Cash Return
5.2%
Cap rate
0.8%
Rent to Value Ratio
Active
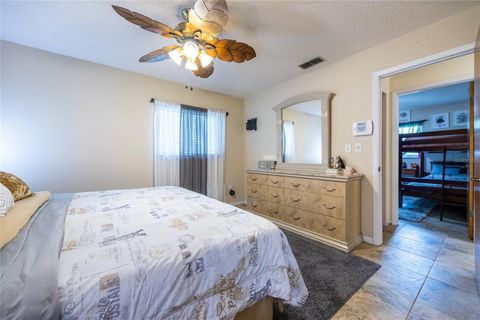
$265,000
3
bds
|
2
ba
|
1,469
sqft
|
built
1993
281 E Country Club Dr, Williston, FL 32696
$-502
Cash flow
-9.9%
Cash-on-Cash Return
3.9%
Cap rate
0.6%
Rent to Value Ratio
Active
$215,000
2
bds
|
2
ba
|
984
sqft
|
built
2008
7930 NW 166th St, Trenton, FL 32693
$-30
Cash flow
-0.7%
Cash-on-Cash Return
6.0%
Cap rate
0.7%
Rent to Value Ratio
Active
$1,060,000
3
bds
|
2
ba
|
2,117
sqft
|
built
2005
7 Oak Dr, Yankeetown, FL 34498
$-3,951
Cash flow
-19.4%
Cash-on-Cash Return
1.7%
Cap rate
0.3%
Rent to Value Ratio

Active
$397,500
4
bds
|
2
ba
|
2,154
sqft
|
built
1983
20165 SE 115th Ave, Inglis, FL 34449
$-492
Cash flow
-6.5%
Cash-on-Cash Return
4.7%
Cap rate
0.7%
Rent to Value Ratio

Active
$300,000
2
bds
|
2
ba
|
819
sqft
|
built
1983
3850 SE 22nd Ct, Morriston, FL 32668
$-707
Cash flow
-12.3%
Cash-on-Cash Return
3.3%
Cap rate
0.5%
Rent to Value Ratio
Active
$454,000
3
bds
|
3
ba
|
2,151
sqft
|
built
2022
251 SE 148th Ave, Williston, FL 32696
$-953
Cash flow
-11.0%
Cash-on-Cash Return
3.6%
Cap rate
0.6%
Rent to Value Ratio
Active
$299,000
3
bds
|
2
ba
|
1,407
sqft
|
built
2010
206 SE 8th Ave, Williston, FL 32696
$-411
Cash flow
-7.2%
Cash-on-Cash Return
4.5%
Cap rate
0.7%
Rent to Value Ratio
Active
$449,000
2
bds
|
2
ba
|
1,240
sqft
|
built
2019
15250 SW 100th Pl, Cedar Key, FL 32625
$-1,174
Cash flow
-13.6%
Cash-on-Cash Return
3.0%
Cap rate
0.4%
Rent to Value Ratio
Active
$369,900
3
bds
|
2
ba
|
1,459
sqft
|
built
1965
12301 Cedar St, Cedar Key, FL 32625
$-923
Cash flow
-13.0%
Cash-on-Cash Return
3.2%
Cap rate
0.6%
Rent to Value Ratio

Active
$724,999
4
bds
|
4
ba
|
2,682
sqft
|
built
1996
7450 SE State Road 121, Morriston, FL 32668
$-1,713
Cash flow
-12.3%
Cash-on-Cash Return
3.3%
Cap rate
0.4%
Rent to Value Ratio

Active
$184,000
3
bds
|
1
ba
|
1,072
sqft
|
built
1968
1226 Hawthorne Ave, Cedar Key, FL 32625
$168
Cash flow
4.8%
Cash-on-Cash Return
7.2%
Cap rate
1.0%
Rent to Value Ratio
Active
$285,000
3
bds
|
2
ba
|
1,256
sqft
|
built
1981
2531 NE 167th Ave, Williston, FL 32696
$-405
Cash flow
-7.4%
Cash-on-Cash Return
4.4%
Cap rate
0.7%
Rent to Value Ratio

Active
$264,999
3
bds
|
2
ba
|
1,995
sqft
|
built
1962
219 NW 7th St, Williston, FL 32696
$156
Cash flow
3.1%
Cash-on-Cash Return
6.9%
Cap rate
0.9%
Rent to Value Ratio
Active
$139,900
2
bds
|
2
ba
|
1,020
sqft
|
built
1961
10590 Highway 40 E, Inglis, FL 34449
$-66
Cash flow
-2.5%
Cash-on-Cash Return
5.6%
Cap rate
0.8%
Rent to Value Ratio
Active
$225,000
3
bds
|
1
ba
|
1,300
sqft
|
built
1960
1025 NE 4th St, Chiefland, FL 32626
$-436
Cash flow
-10.1%
Cash-on-Cash Return
3.8%
Cap rate
0.6%
Rent to Value Ratio
Active
$559,900
5
bds
|
3
ba
|
3,204
sqft
|
built
1977
155 S Court St, Bronson, FL 32621
$-1,197
Cash flow
-11.2%
Cash-on-Cash Return
3.6%
Cap rate
0.6%
Rent to Value Ratio
Active
$870,000
3
bds
|
3
ba
|
1,928
sqft
|
built
2022
5300 NW 52nd Ct, Chiefland, FL 32626
$-3,132
Cash flow
-18.8%
Cash-on-Cash Return
1.8%
Cap rate
0.3%
Rent to Value Ratio
Active
$189,900
2
bds
|
3
ba
|
1,160
sqft
|
built
1930
241 Hudson St, Inglis, FL 34449
$102
Cash flow
2.8%
Cash-on-Cash Return
6.8%
Cap rate
0.8%
Rent to Value Ratio
Active
$470,000
3
bds
|
2
ba
|
1,668
sqft
|
built
1990
10851 SE 195th St, Inglis, FL 34449
$-1,050
Cash flow
-11.7%
Cash-on-Cash Return
3.5%
Cap rate
0.5%
Rent to Value Ratio
Active
$325,000
3
bds
|
2
ba
|
1,905
sqft
|
built
1975
334 NW 6th St, Williston, FL 32696
$-38
Cash flow
-0.6%
Cash-on-Cash Return
6.0%
Cap rate
0.8%
Rent to Value Ratio