Pinellas County Investment Properties for Sale
Browse homes for sale and investment properties in Pinellas County. Refine your search by price, property type, or more.
Best cash flowing properties in Pinellas County
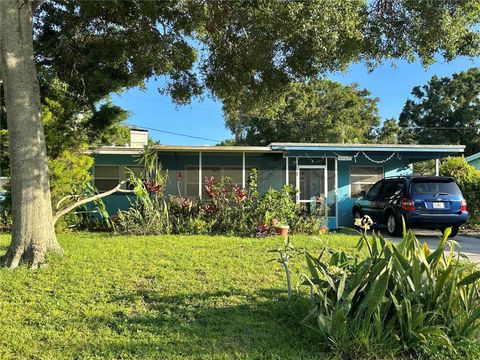
Active
$150,000
2
bds
|
1
ba
|
872
sqft
|
built
1972
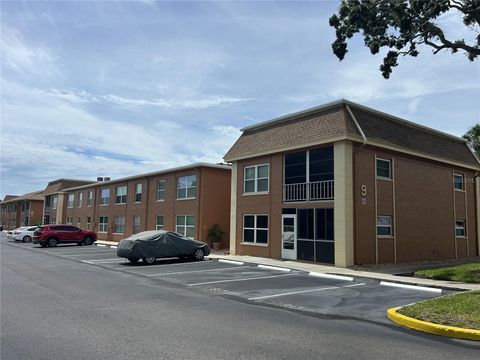
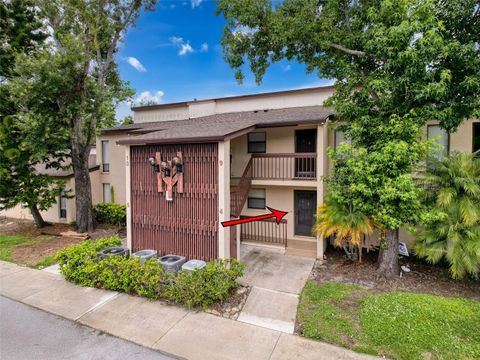
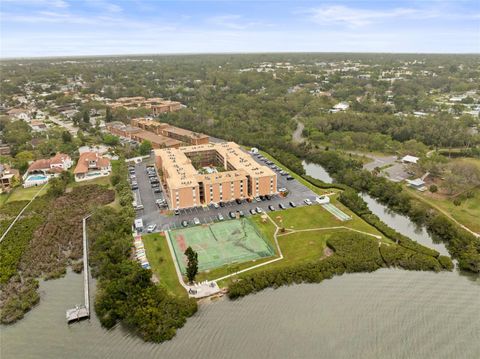
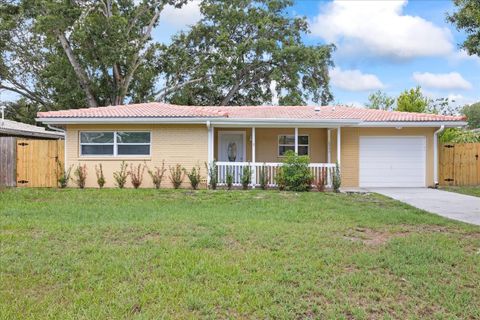
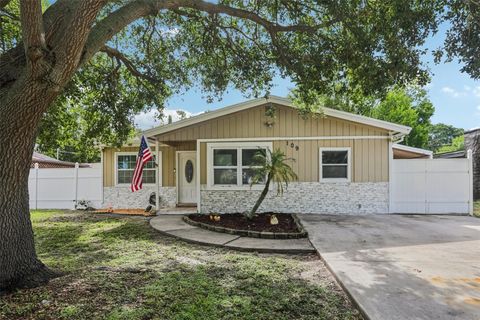
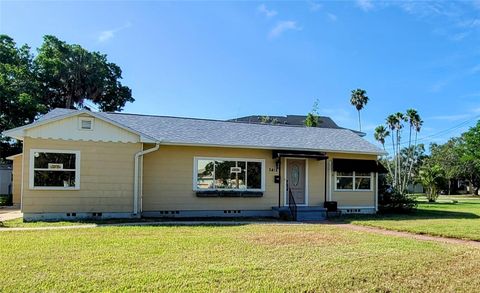
12760 Indian Rocks Rd, Largo, FL 33774
$375
Cash flow
13.0%
Cash-on-Cash Return
9.1%
Cap rate
1.1%
Rent to Value Ratio
Active
$144,900
1
bds
|
2
ba
|
810
sqft
|
built
1974
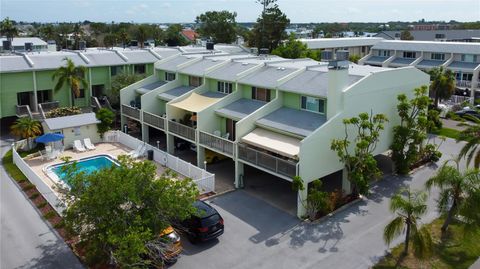
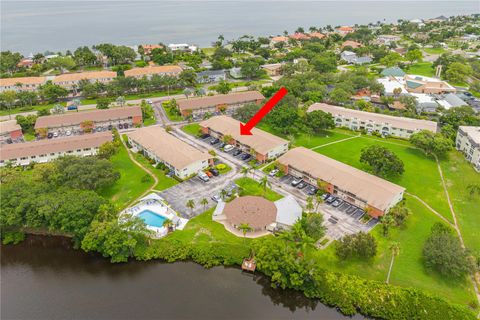
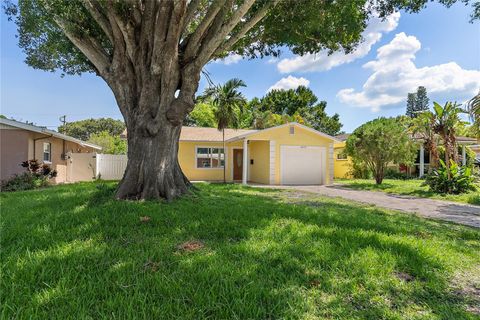
2621 Cove Cay Dr, Clearwater, FL 33760
$315
Cash flow
11.3%
Cash-on-Cash Return
8.8%
Cap rate
1.1%
Rent to Value Ratio
1,818 out of 2,404 properties for sale in Pinellas County
Limited Results Shown
Create a free account, or log in to reveal all property listings and enjoy the complete experience.
Active
$249,882
3
bds
|
1
ba
|
935
sqft
|
built
1955
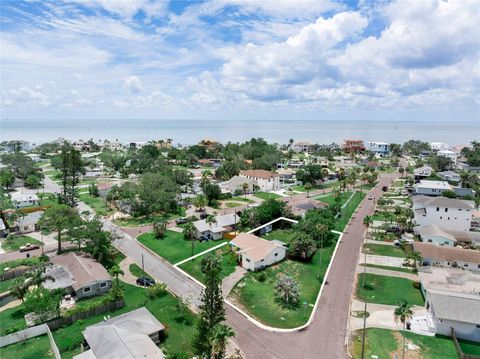
10436 117th Dr, Largo, FL 33773
$-123
Cash flow
-2.6%
Cash-on-Cash Return
5.6%
Cap rate
0.7%
Rent to Value Ratio
Active
$250,000
2
bds
|
2
ba
|
1,425
sqft
|
built
1982
14820 Rue De Bayonne, Clearwater, FL 33762
$-100
Cash flow
-2.1%
Cash-on-Cash Return
5.7%
Cap rate
0.9%
Rent to Value Ratio

Active
$465,000
3
bds
|
3
ba
|
1,789
sqft
|
built
1982
2199 Blue Tern Dr, Palm Harbor, FL 34683
$-657
Cash flow
-7.4%
Cash-on-Cash Return
4.5%
Cap rate
0.7%
Rent to Value Ratio
Active
$160,000
2
bds
|
2
ba
|
1,220
sqft
|
built
1981
1200 Tarpon Woods Blvd, Palm Harbor, FL 34685
$-137
Cash flow
-4.5%
Cash-on-Cash Return
5.1%
Cap rate
1.3%
Rent to Value Ratio
Active
$395,000
3
bds
|
2
ba
|
1,252
sqft
|
built
1975
1580 Arizona Ave NE, Saint Petersburg, FL 33703
$-214
Cash flow
-2.8%
Cash-on-Cash Return
5.5%
Cap rate
0.7%
Rent to Value Ratio

Active
$235,000
2
bds
|
1
ba
|
1,087
sqft
|
built
1974
345 S Mc Mullen Booth Rd, Clearwater, FL 33759
$145
Cash flow
3.2%
Cash-on-Cash Return
6.9%
Cap rate
1.0%
Rent to Value Ratio
Active
$437,000
3
bds
|
3
ba
|
1,390
sqft
|
built
1980
318 Windrush Blvd, Indian Rocks Beach, FL 33785
$-1,104
Cash flow
-13.2%
Cash-on-Cash Return
3.1%
Cap rate
0.8%
Rent to Value Ratio
Active
$739,999
4
bds
|
3
ba
|
3,120
sqft
|
built
2006
2228 Hannah Way S, Dunedin, FL 34698
$-1,279
Cash flow
-9.0%
Cash-on-Cash Return
4.1%
Cap rate
0.6%
Rent to Value Ratio
Active
$284,000
3
bds
|
2
ba
|
1,326
sqft
|
built
1958
1605 Logan St, Clearwater, FL 33755
$16
Cash flow
0.3%
Cash-on-Cash Return
6.2%
Cap rate
0.8%
Rent to Value Ratio
Active
$2,900,000
5
bds
|
8
ba
|
3,354
sqft
|
built
1951
122 Coral Ave, Redington Shores, FL 33708
$-12,356
Cash flow
-22.2%
Cash-on-Cash Return
1.0%
Cap rate
0.2%
Rent to Value Ratio

Active
$450,000
3
bds
|
2
ba
|
1,320
sqft
|
built
1956
1529 Essex Dr N, Saint Petersburg, FL 33710
$-1,207
Cash flow
-14.0%
Cash-on-Cash Return
2.9%
Cap rate
0.4%
Rent to Value Ratio
Active
$263,900
2
bds
|
3
ba
|
1,110
sqft
|
built
1996
267 Countryside Key Blvd, Oldsmar, FL 34677
$-431
Cash flow
-8.5%
Cash-on-Cash Return
4.2%
Cap rate
0.9%
Rent to Value Ratio

Active
$895,000
4
bds
|
3
ba
|
3,118
sqft
|
built
2020
729 89th Ave N, Saint Petersburg, FL 33702
$-782
Cash flow
-4.6%
Cash-on-Cash Return
5.1%
Cap rate
0.8%
Rent to Value Ratio
Active
$239,950
2
bds
|
2
ba
|
1,440
sqft
|
built
1975
225 Country Club Dr, Largo, FL 33771
$21
Cash flow
0.5%
Cash-on-Cash Return
6.3%
Cap rate
1.0%
Rent to Value Ratio
Active
$165,000
2
bds
|
2
ba
|
987
sqft
|
built
1972
12760 Indian Rocks Rd, Largo, FL 33774
$297
Cash flow
9.4%
Cash-on-Cash Return
8.3%
Cap rate
1.2%
Rent to Value Ratio
Active
$149,900
1
bds
|
1
ba
|
865
sqft
|
built
1970
4510 Overlook Dr NE, Saint Petersburg, FL 33703
$279
Cash flow
9.7%
Cash-on-Cash Return
8.4%
Cap rate
1.2%
Rent to Value Ratio
Active
$304,500
3
bds
|
2
ba
|
1,146
sqft
|
built
1962
530 74th Ave N, Saint Petersburg, FL 33702
$-110
Cash flow
-1.9%
Cash-on-Cash Return
5.7%
Cap rate
0.7%
Rent to Value Ratio
Active
$879,000
bds
|
0
ba
|
2,040
sqft
|
built
1953
100 144th Ave, Madeira Beach, FL 33708
$-3,470
Cash flow
-20.6%
Cash-on-Cash Return
1.4%
Cap rate
0.3%
Rent to Value Ratio
Active
$795,000
4
bds
|
4
ba
|
1,719
sqft
|
built
1954
1800 Mound Pl S, Saint Petersburg, FL 33712
$-2,219
Cash flow
-14.6%
Cash-on-Cash Return
2.8%
Cap rate
0.5%
Rent to Value Ratio
Active
$219,000
2
bds
|
2
ba
|
1,245
sqft
|
built
1987
6206 92nd Pl N, Pinellas Park, FL 33782
$-530
Cash flow
-12.6%
Cash-on-Cash Return
3.2%
Cap rate
1.1%
Rent to Value Ratio
Active
$148,000
2
bds
|
1
ba
|
752
sqft
|
built
1980
1851 Bough Ave, Clearwater, FL 33760
$-255
Cash flow
-9.0%
Cash-on-Cash Return
4.1%
Cap rate
1.1%
Rent to Value Ratio
Active
$585,000
3
bds
|
2
ba
|
1,910
sqft
|
built
1960
3173 Fountainhead Dr, Largo, FL 33770
$-906
Cash flow
-8.1%
Cash-on-Cash Return
4.3%
Cap rate
0.7%
Rent to Value Ratio

Active
$474,000
3
bds
|
2
ba
|
1,343
sqft
|
built
1959
4374 32nd Ter N, Saint Petersburg, FL 33713
$-1,278
Cash flow
-14.1%
Cash-on-Cash Return
2.9%
Cap rate
0.5%
Rent to Value Ratio
Active
$400,000
3
bds
|
2
ba
|
1,188
sqft
|
built
1961
2333 Indigo Dr, Clearwater, FL 33763
$-961
Cash flow
-12.5%
Cash-on-Cash Return
3.3%
Cap rate
0.5%
Rent to Value Ratio
Active
$800,000
2
bds
|
2
ba
|
1,213
sqft
|
built
1952
1830 Santa Barbara Dr, Dunedin, FL 34698
$-1,938
Cash flow
-12.6%
Cash-on-Cash Return
3.2%
Cap rate
0.5%
Rent to Value Ratio
Active
$349,900
2
bds
|
1
ba
|
720
sqft
|
built
1960
5519 Kelly Dr N, Saint Petersburg, FL 33703
$-541
Cash flow
-8.1%
Cash-on-Cash Return
4.3%
Cap rate
0.6%
Rent to Value Ratio
Active
$555,000
2
bds
|
2
ba
|
1,245
sqft
|
built
2005
851 3rd Ave N, Saint Petersburg, FL 33701
$-1,702
Cash flow
-16.0%
Cash-on-Cash Return
2.5%
Cap rate
0.6%
Rent to Value Ratio
Active
$245,999
2
bds
|
2
ba
|
1,125
sqft
|
built
1972
2616 Cove Cay Dr, Clearwater, FL 33760
$260
Cash flow
5.5%
Cash-on-Cash Return
7.4%
Cap rate
1.0%
Rent to Value Ratio
Active
$147,900
2
bds
|
2
ba
|
853
sqft
|
built
1984
1813 Bough Ave, Clearwater, FL 33760
$-375
Cash flow
-13.2%
Cash-on-Cash Return
3.1%
Cap rate
1.2%
Rent to Value Ratio
Active
$199,700
2
bds
|
2
ba
|
835
sqft
|
built
1974
2525 W Bay Dr, Largo, FL 33770
$59
Cash flow
1.5%
Cash-on-Cash Return
6.5%
Cap rate
0.9%
Rent to Value Ratio
Active
$525,000
3
bds
|
3
ba
|
1,945
sqft
|
built
1975
1 Beach Dr SE, Saint Petersburg, FL 33701
$-139
Cash flow
-1.4%
Cash-on-Cash Return
5.8%
Cap rate
0.8%
Rent to Value Ratio
Active
$330,000
3
bds
|
2
ba
|
1,243
sqft
|
built
1955
109 Emerald Ln, Largo, FL 33771
$-317
Cash flow
-5.0%
Cash-on-Cash Return
5.0%
Cap rate
0.7%
Rent to Value Ratio
Active
$599,900
3
bds
|
2
ba
|
1,833
sqft
|
built
1977
8289 136th St, Seminole, FL 33776
$-1,084
Cash flow
-9.4%
Cash-on-Cash Return
4.0%
Cap rate
0.6%
Rent to Value Ratio
Active
$470,000
3
bds
|
2
ba
|
1,870
sqft
|
built
1954
2306 Cheryl Rd, Largo, FL 33771
$-937
Cash flow
-10.4%
Cash-on-Cash Return
3.8%
Cap rate
0.6%
Rent to Value Ratio

Active
$395,000
2
bds
|
2
ba
|
1,167
sqft
|
built
1957
2239 Curtis Dr S, Clearwater, FL 33764
$-766
Cash flow
-10.1%
Cash-on-Cash Return
3.8%
Cap rate
0.6%
Rent to Value Ratio
Active
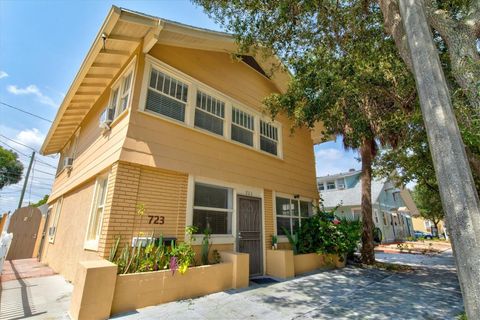
$525,000
3
bds
|
2
ba
|
1,644
sqft
|
built
1925
723 7th Ave N, Saint Petersburg, FL 33701
$-1,073
Cash flow
-10.7%
Cash-on-Cash Return
3.7%
Cap rate
0.6%
Rent to Value Ratio
Active
$320,000
2
bds
|
1
ba
|
1,220
sqft
|
built
1947
3415 Overlook Dr NE, Saint Petersburg, FL 33703
$170
Cash flow
2.8%
Cash-on-Cash Return
6.8%
Cap rate
0.9%
Rent to Value Ratio
Active
$429,000
3
bds
|
2
ba
|
1,276
sqft
|
built
1980
4242 7th Ave N, Saint Petersburg, FL 33713
$-725
Cash flow
-8.8%
Cash-on-Cash Return
4.1%
Cap rate
0.7%
Rent to Value Ratio