Pinellas County Investment Properties for Sale
Browse homes for sale and investment properties in Pinellas County. Refine your search by price, property type, or more.
Best cash flowing properties in Pinellas County
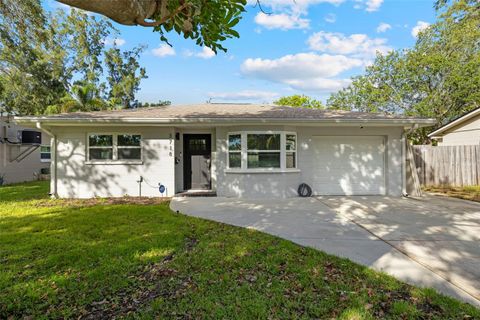
Active
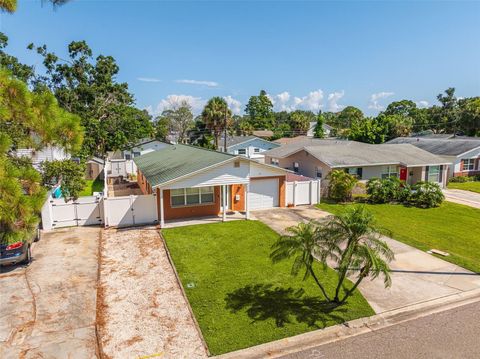
$229,900
3
bds
|
2
ba
|
1,147
sqft
|
built
1970
1719 Mississippi Ave NE, Saint Petersburg, FL 33703
$340
Cash flow
7.7%
Cash-on-Cash Return
7.9%
Cap rate
1.0%
Rent to Value Ratio
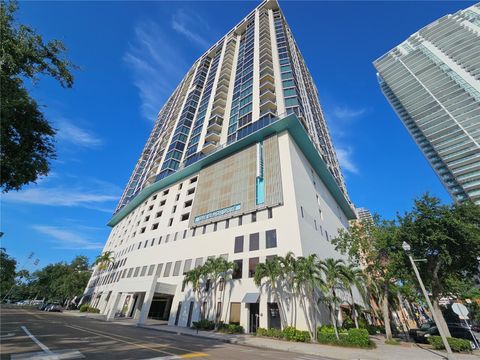
Active
$508,000
2
bds
|
2
ba
|
1,945
sqft
|
built
1975
1 Beach Dr SE, Saint Petersburg, FL 33701
$198
Cash flow
2.0%
Cash-on-Cash Return
6.6%
Cap rate
0.9%
Rent to Value Ratio
2,105 out of 2,784 properties for sale in Pinellas County
Limited Results Shown
Create a free account, or log in to reveal all property listings and enjoy the complete experience.
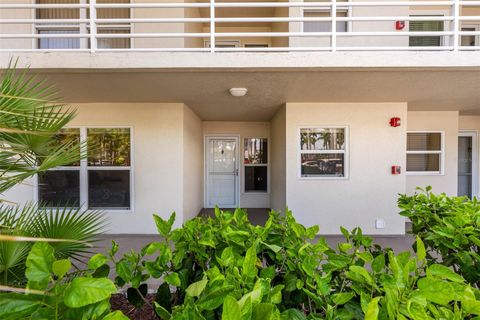
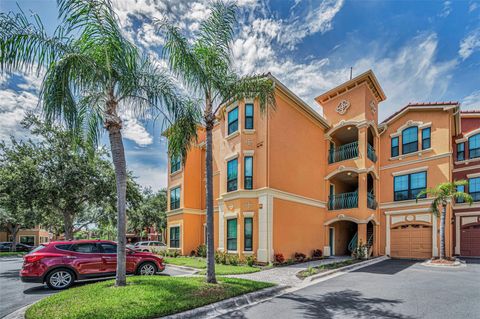
Active
$675,000
3
bds
|
2
ba
|
1,135
sqft
|
built
1992
6085 Bahia Del Mar Cir, Saint Petersburg, FL 33715
$-2,265
Cash flow
-17.5%
Cash-on-Cash Return
2.1%
Cap rate
0.5%
Rent to Value Ratio
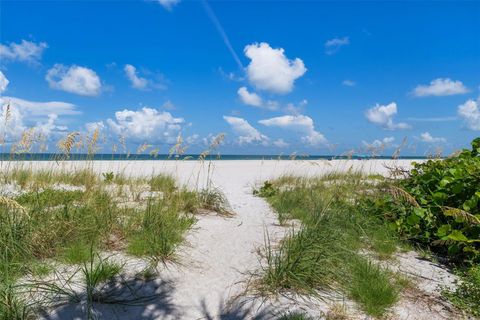
Active
$750,000
2
bds
|
2
ba
|
1,462
sqft
|
built
1974
1390 Gulf Blvd, Clearwater, FL 33767
$-1,896
Cash flow
-13.2%
Cash-on-Cash Return
3.1%
Cap rate
0.6%
Rent to Value Ratio
Active
$640,000
2
bds
|
2
ba
|
1,200
sqft
|
built
1982
2112 Gulf Blvd, Indian Rocks Beach, FL 33785
$-1,813
Cash flow
-14.8%
Cash-on-Cash Return
2.7%
Cap rate
0.5%
Rent to Value Ratio
Active
$460,000
3
bds
|
3
ba
|
1,990
sqft
|
built
2005
270 Valencia Cir, Saint Petersburg, FL 33716
$-1,487
Cash flow
-16.9%
Cash-on-Cash Return
2.3%
Cap rate
0.7%
Rent to Value Ratio
Active
$497,000
2
bds
|
3
ba
|
1,410
sqft
|
built
2019
1223 Sunset Ln, Dunedin, FL 34698
$-1,145
Cash flow
-12.0%
Cash-on-Cash Return
3.4%
Cap rate
0.6%
Rent to Value Ratio
Active
$325,000
2
bds
|
2
ba
|
812
sqft
|
built
1949
9399 Antilles Dr, Seminole, FL 33776
$-224
Cash flow
-3.6%
Cash-on-Cash Return
5.3%
Cap rate
0.7%
Rent to Value Ratio
Active
$480,000
2
bds
|
3
ba
|
1,265
sqft
|
built
1982
7520 Sunshine Skyway Ln S, Saint Petersburg, FL 33711
$-2,051
Cash flow
-22.3%
Cash-on-Cash Return
1.0%
Cap rate
0.6%
Rent to Value Ratio
Active
$469,000
3
bds
|
3
ba
|
1,616
sqft
|
built
1962
2481 Burnice Dr, Clearwater, FL 33764
$-1,090
Cash flow
-12.1%
Cash-on-Cash Return
3.4%
Cap rate
0.6%
Rent to Value Ratio
Active
$355,000
3
bds
|
2
ba
|
1,041
sqft
|
built
1954
130 Melody Ln, Largo, FL 33771
$-658
Cash flow
-9.7%
Cash-on-Cash Return
3.9%
Cap rate
0.6%
Rent to Value Ratio
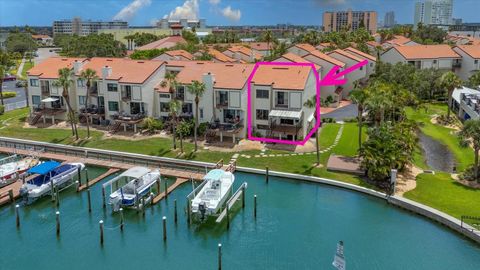
Active
$415,000
3
bds
|
3
ba
|
2,044
sqft
|
built
2005
1190 Venetian Harbor Dr NE, Saint Petersburg, FL 33702
$-979
Cash flow
-12.3%
Cash-on-Cash Return
3.3%
Cap rate
0.8%
Rent to Value Ratio
Active
$499,500
2
bds
|
2
ba
|
1,397
sqft
|
built
1968
1510 San Diego Dr, Dunedin, FL 34698
$-677
Cash flow
-7.1%
Cash-on-Cash Return
4.5%
Cap rate
0.6%
Rent to Value Ratio
Active
$505,990
4
bds
|
2
ba
|
1,413
sqft
|
built
1957
11220 Cherokee Dr, Saint Petersburg, FL 33708
$-781
Cash flow
-8.1%
Cash-on-Cash Return
4.3%
Cap rate
0.6%
Rent to Value Ratio
Active
$1,499,999
4
bds
|
4
ba
|
3,020
sqft
|
built
2007
17745 Gulf Blvd, Redington Shores, FL 33708
$-4,345
Cash flow
-15.1%
Cash-on-Cash Return
2.7%
Cap rate
0.5%
Rent to Value Ratio
Active
$635,000
3
bds
|
2
ba
|
1,725
sqft
|
built
1964
863 Bay Breeze Ter, Largo, FL 33770
$-1,767
Cash flow
-14.5%
Cash-on-Cash Return
2.8%
Cap rate
0.5%
Rent to Value Ratio
Active
$325,000
2
bds
|
2
ba
|
1,443
sqft
|
built
2002
2738 Via Tivoli, Clearwater, FL 33764
$-560
Cash flow
-9.0%
Cash-on-Cash Return
4.1%
Cap rate
0.7%
Rent to Value Ratio
Active
$839,000
3
bds
|
3
ba
|
1,886
sqft
|
built
1980
240 Windward Psge, Clearwater, FL 33767
$-2,804
Cash flow
-17.4%
Cash-on-Cash Return
2.1%
Cap rate
0.6%
Rent to Value Ratio
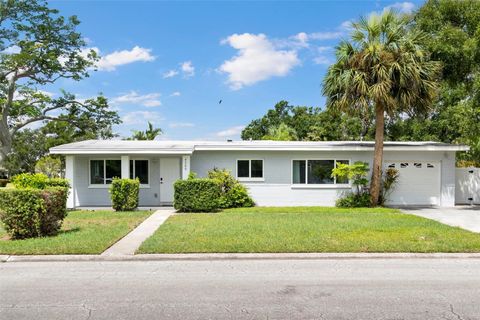
Active
$450,000
2
bds
|
2
ba
|
1,296
sqft
|
built
1971
3718 Alabama Ave NE, Saint Petersburg, FL 33703
$-419
Cash flow
-4.9%
Cash-on-Cash Return
5.0%
Cap rate
0.8%
Rent to Value Ratio
Active
$449,000
3
bds
|
2
ba
|
1,400
sqft
|
built
1959
4300 Maple St NE, Saint Petersburg, FL 33703
$-1,164
Cash flow
-13.5%
Cash-on-Cash Return
3.0%
Cap rate
0.6%
Rent to Value Ratio
Active
$750,000
2
bds
|
2
ba
|
1,132
sqft
|
built
1931
718 Bay Esplanade, Clearwater, FL 33767
$-1,824
Cash flow
-12.7%
Cash-on-Cash Return
3.2%
Cap rate
0.5%
Rent to Value Ratio
Active
$359,900
3
bds
|
2
ba
|
1,044
sqft
|
built
1992
3164 Duane Ave, Oldsmar, FL 34677
$-398
Cash flow
-5.8%
Cash-on-Cash Return
4.8%
Cap rate
0.6%
Rent to Value Ratio
Active
$1,450,000
3
bds
|
4
ba
|
2,150
sqft
|
built
1982
119 Marina Del Rey Ct, Clearwater, FL 33767
$-4,125
Cash flow
-14.8%
Cash-on-Cash Return
2.7%
Cap rate
0.5%
Rent to Value Ratio
Active
$1,490,000
3
bds
|
3
ba
|
1,740
sqft
|
built
1982
19700 Gulf Blvd, Indian Shores, FL 33785
$-4,120
Cash flow
-14.4%
Cash-on-Cash Return
2.8%
Cap rate
0.4%
Rent to Value Ratio
Active
$585,000
2
bds
|
2
ba
|
1,040
sqft
|
built
1973
315 Medallion Blvd, Madeira Beach, FL 33708
$-1,440
Cash flow
-12.8%
Cash-on-Cash Return
3.2%
Cap rate
0.5%
Rent to Value Ratio
Active
$574,999
4
bds
|
2
ba
|
1,690
sqft
|
built
1986
2935 Shore Dr, Safety Harbor, FL 34695
$-1,966
Cash flow
-17.8%
Cash-on-Cash Return
2.0%
Cap rate
0.3%
Rent to Value Ratio
Active
$339,000
3
bds
|
2
ba
|
1,379
sqft
|
built
2002
2220 Chianti Pl, Palm Harbor, FL 34683
$-1,029
Cash flow
-15.8%
Cash-on-Cash Return
2.5%
Cap rate
0.7%
Rent to Value Ratio
Active
$1,135,000
2
bds
|
2
ba
|
1,348
sqft
|
built
2004
521 Mandalay Ave, Clearwater, FL 33767
$-3,233
Cash flow
-14.9%
Cash-on-Cash Return
2.7%
Cap rate
0.5%
Rent to Value Ratio
Active
$318,500
2
bds
|
1
ba
|
768
sqft
|
built
1972
3019 Englewood Dr, Largo, FL 33771
$-634
Cash flow
-10.4%
Cash-on-Cash Return
3.8%
Cap rate
0.6%
Rent to Value Ratio
Active
$489,900
3
bds
|
3
ba
|
2,023
sqft
|
built
1988
14873 Feather Cove Rd, Clearwater, FL 33762
$-1,187
Cash flow
-12.6%
Cash-on-Cash Return
3.2%
Cap rate
0.6%
Rent to Value Ratio
Active
$395,000
3
bds
|
2
ba
|
1,091
sqft
|
built
1970
1826 Nevada Ave NE, Saint Petersburg, FL 33703
$-370
Cash flow
-4.9%
Cash-on-Cash Return
5.0%
Cap rate
0.6%
Rent to Value Ratio
Active
$549,000
4
bds
|
3
ba
|
1,484
sqft
|
built
1950
905 Plaza St, Clearwater, FL 33755
$-1,832
Cash flow
-17.4%
Cash-on-Cash Return
2.1%
Cap rate
0.3%
Rent to Value Ratio
Active
$225,000
2
bds
|
2
ba
|
1,100
sqft
|
built
1980
2685 Sabal Springs Cir, Clearwater, FL 33761
$-573
Cash flow
-13.3%
Cash-on-Cash Return
3.1%
Cap rate
0.8%
Rent to Value Ratio
Active
$549,000
3
bds
|
2
ba
|
1,471
sqft
|
built
1974
908 Highview Dr, Palm Harbor, FL 34683
$-1,158
Cash flow
-11.0%
Cash-on-Cash Return
3.6%
Cap rate
0.5%
Rent to Value Ratio
Active
$229,000
2
bds
|
2
ba
|
912
sqft
|
built
1986
12900 Vonn Rd, Largo, FL 33774
$-608
Cash flow
-13.9%
Cash-on-Cash Return
3.0%
Cap rate
0.9%
Rent to Value Ratio
Active
$229,000
2
bds
|
2
ba
|
930
sqft
|
built
1971
2700 Bayshore Blvd, Dunedin, FL 34698
$-1,017
Cash flow
-23.2%
Cash-on-Cash Return
0.8%
Cap rate
0.8%
Rent to Value Ratio
Active
$176,000
1
bds
|
1
ba
|
765
sqft
|
built
1973
7321 Central Ave, Saint Petersburg, FL 33710
$-420
Cash flow
-12.5%
Cash-on-Cash Return
3.3%
Cap rate
0.9%
Rent to Value Ratio
Active
$360,000
3
bds
|
2
ba
|
1,126
sqft
|
built
1985
612 Boston St, Tarpon Springs, FL 34689
$-367
Cash flow
-5.3%
Cash-on-Cash Return
4.9%
Cap rate
0.6%
Rent to Value Ratio
Active
$697,500
4
bds
|
2
ba
|
2,437
sqft
|
built
1988
778 Centerwood Dr, Tarpon Springs, FL 34688
$-1,587
Cash flow
-11.9%
Cash-on-Cash Return
3.4%
Cap rate
0.5%
Rent to Value Ratio
Active
$159,000
1
bds
|
1
ba
|
690
sqft
|
built
1974
2525 W Bay Dr, Largo, FL 33770
$112
Cash flow
3.7%
Cash-on-Cash Return
7.0%
Cap rate
1.0%
Rent to Value Ratio