Florissant, MO Investment Properties for Sale
Browse homes for sale and investment properties in Florissant, MO. Refine your search by price, property type, or more.
Best cash flowing properties in Florissant, MO
Active
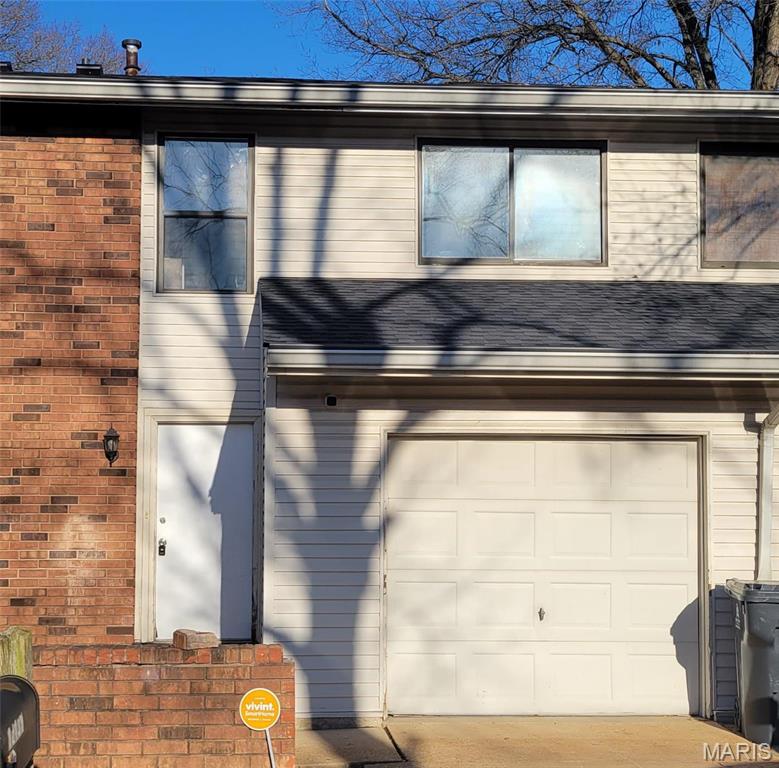
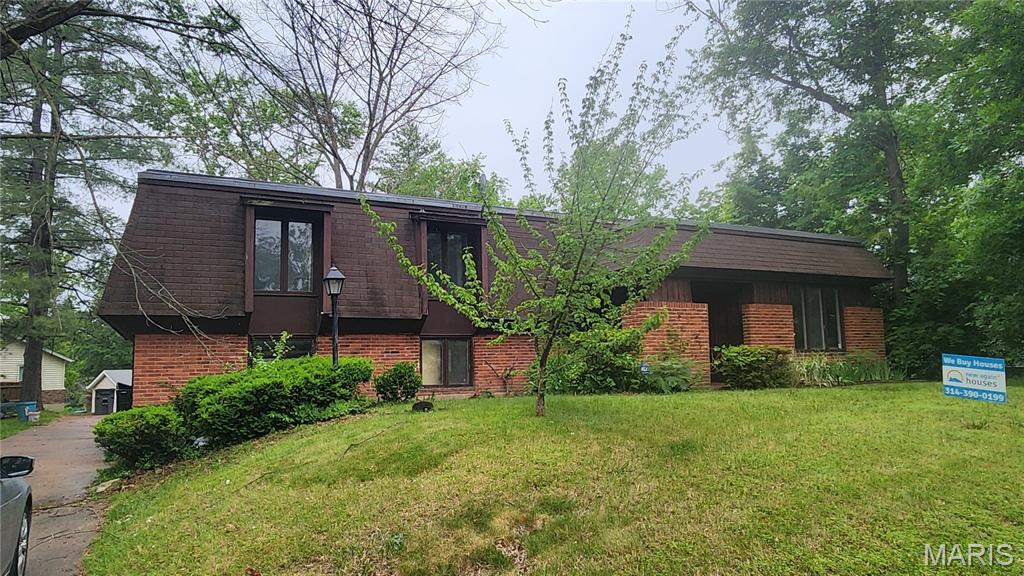
$99,000
3
bds
|
4
ba
|
1,296
sqft
|
built
1974
12435 Sea Lane Dr, Florissant, MO 63033
$470
Cash flow
24.8%
Cash-on-Cash Return
12.0%
Cap rate
1.6%
Rent to Value Ratio
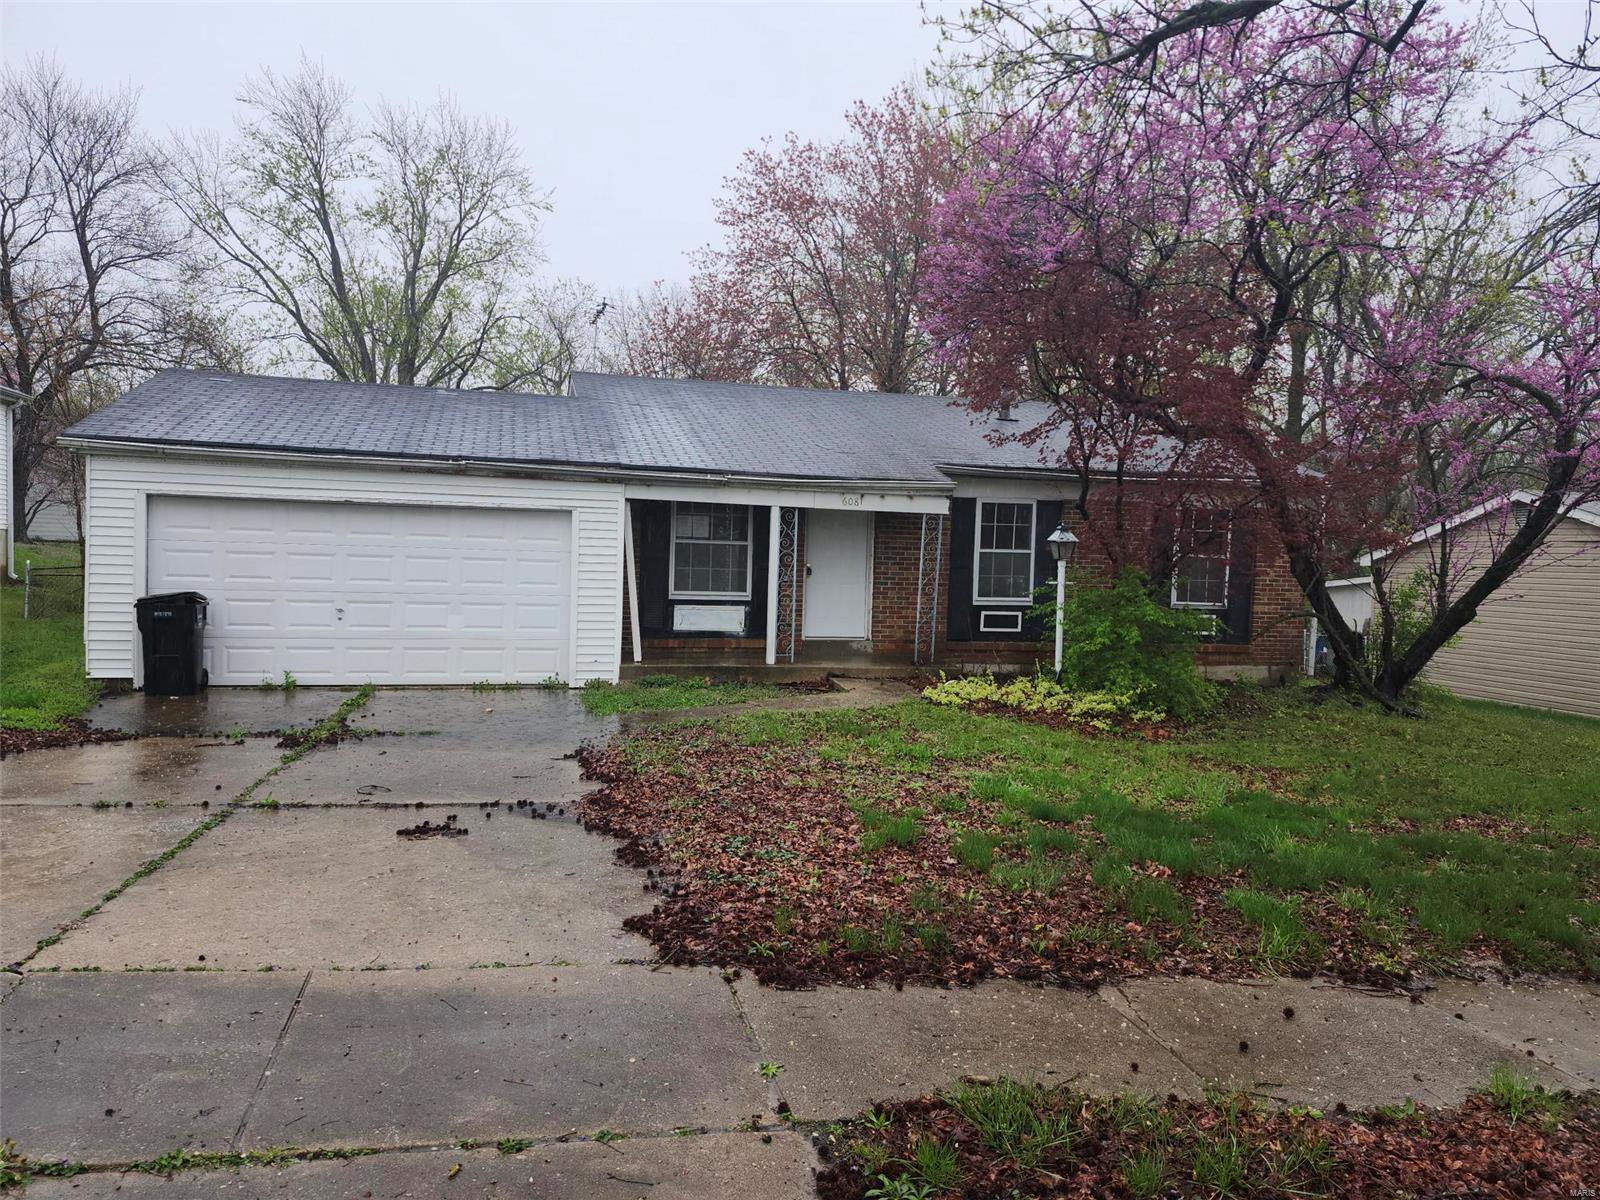
Pending
$120,000
3
bds
|
1
ba
|
1,044
sqft
|
built
1972
6081 Silver Fox Dr, Florissant, MO 63034
$301
Cash flow
13.1%
Cash-on-Cash Return
9.3%
Cap rate
1.3%
Rent to Value Ratio
23 out of 115 properties for sale in Florissant, MO
Limited Results Shown
Create a free account, or log in to reveal all property listings and enjoy the complete experience.
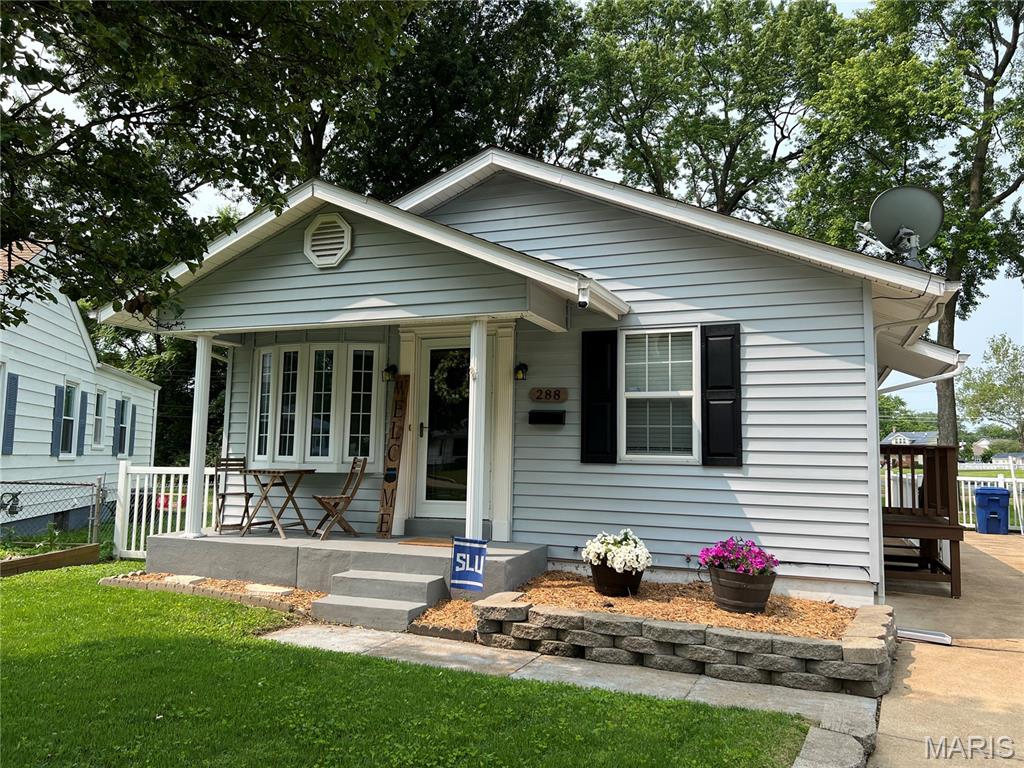
Pending
$169,900
2
bds
|
2
ba
|
864
sqft
|
built
1953
288 Elmdale Ct, Florissant, MO 63031
$-20
Cash flow
-0.6%
Cash-on-Cash Return
6.1%
Cap rate
0.9%
Rent to Value Ratio
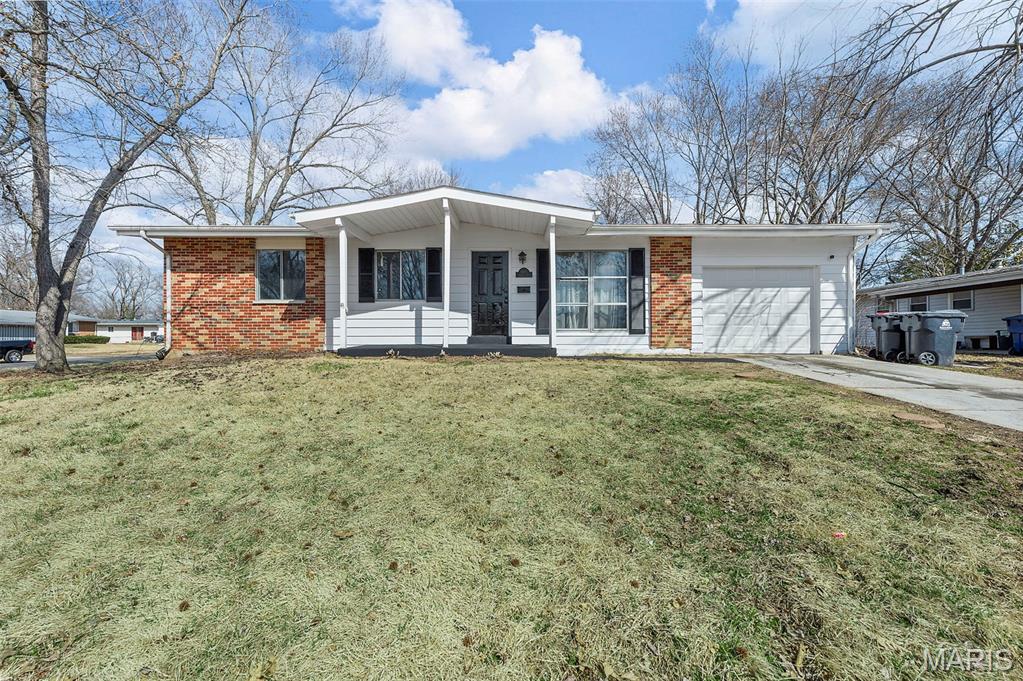
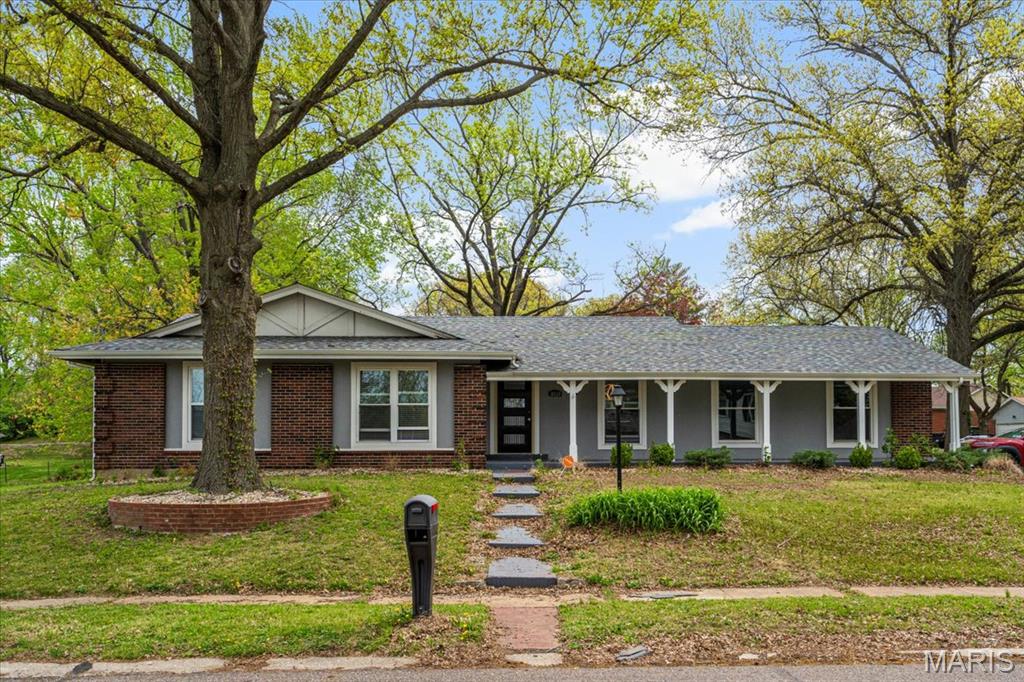
Active
$199,000
3
bds
|
2
ba
|
1,235
sqft
|
built
1961
965 Cheyenne Dr, Florissant, MO 63033
$-117
Cash flow
-3.1%
Cash-on-Cash Return
5.6%
Cap rate
0.8%
Rent to Value Ratio
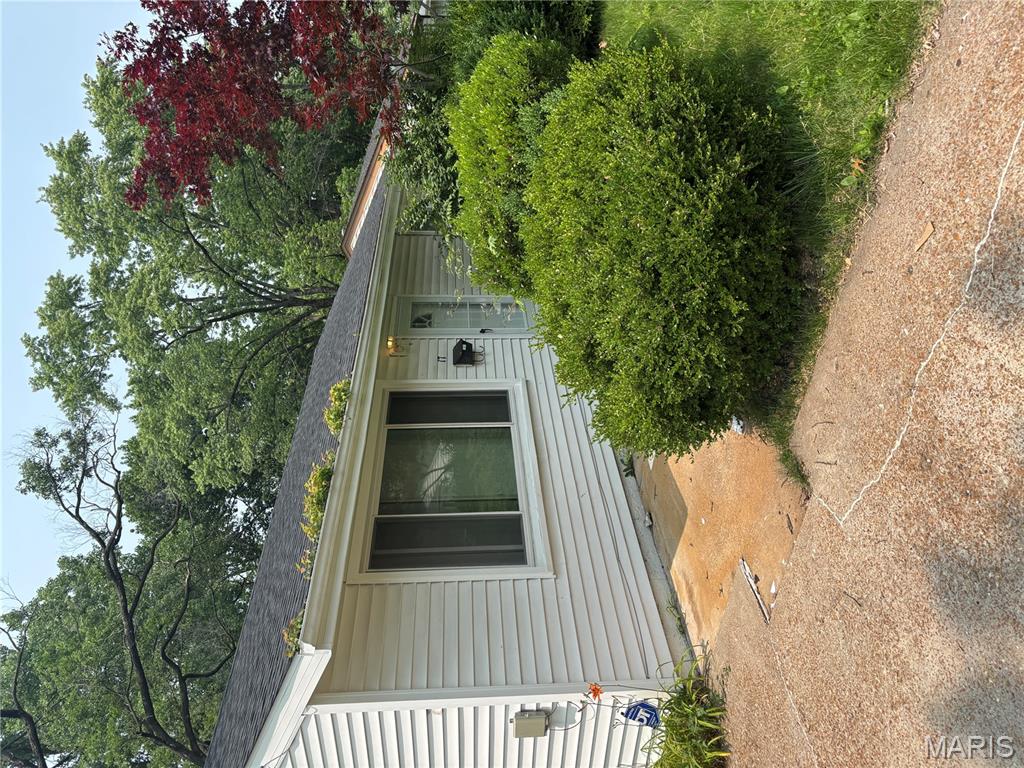
Active
$109,000
2
bds
|
1
ba
|
792
sqft
|
built
1955
17 Mary Ann Ct, Florissant, MO 63031
$51
Cash flow
2.4%
Cash-on-Cash Return
6.8%
Cap rate
1.0%
Rent to Value Ratio
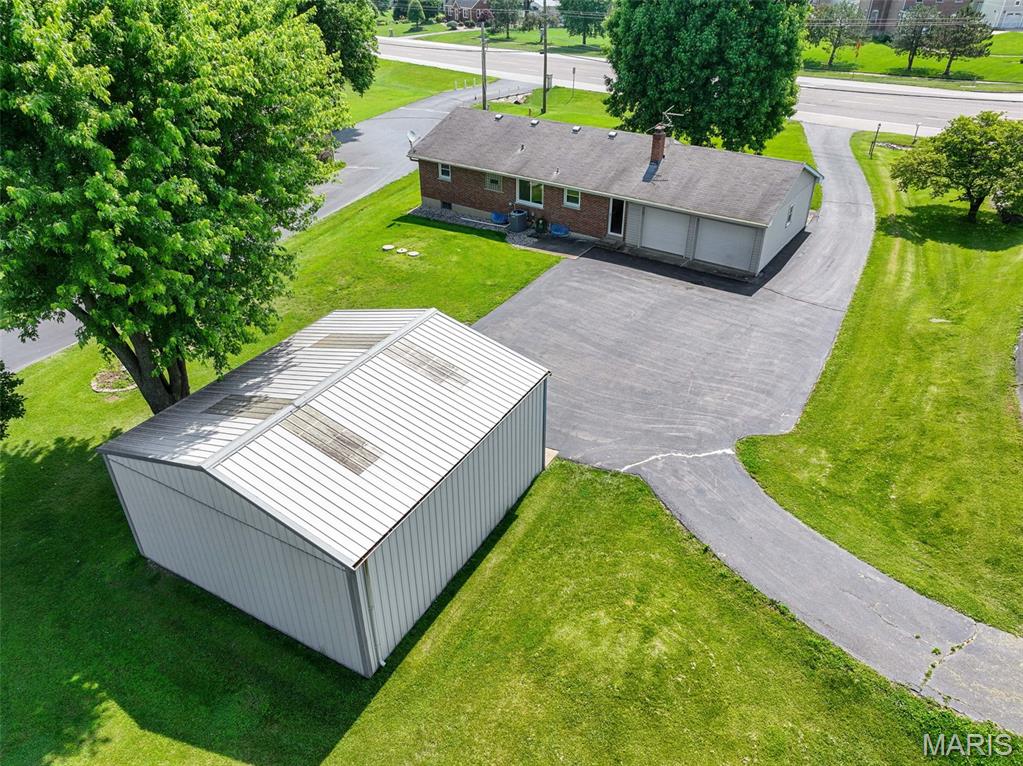
Pending
$200,000
3
bds
|
1
ba
|
1,170
sqft
|
built
1958
4945 N Highway 67, Florissant, MO 63034
$-52
Cash flow
-1.4%
Cash-on-Cash Return
6.0%
Cap rate
0.9%
Rent to Value Ratio
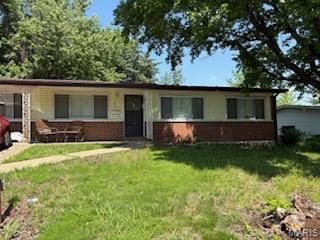
Active
$175,000
4
bds
|
0
ba
|
1,875
sqft
|
built
1956
945 Paddock Dr, Florissant, MO 63033
$-12
Cash flow
-0.4%
Cash-on-Cash Return
6.2%
Cap rate
0.9%
Rent to Value Ratio

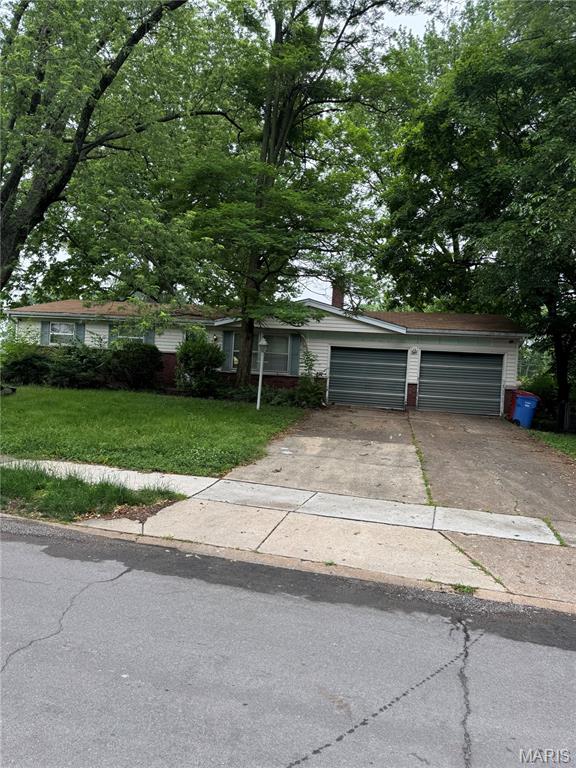
Active
$239,000
3
bds
|
2
ba
|
1,161
sqft
|
built
1968
2186 Aristocrat Dr, Florissant, MO 63031
$-480
Cash flow
-10.5%
Cash-on-Cash Return
3.9%
Cap rate
0.6%
Rent to Value Ratio
Pending
$139,000
3
bds
|
2
ba
|
1,040
sqft
|
built
1963
1580 Queens Dr, Florissant, MO 63031
$182
Cash flow
6.8%
Cash-on-Cash Return
7.9%
Cap rate
1.2%
Rent to Value Ratio
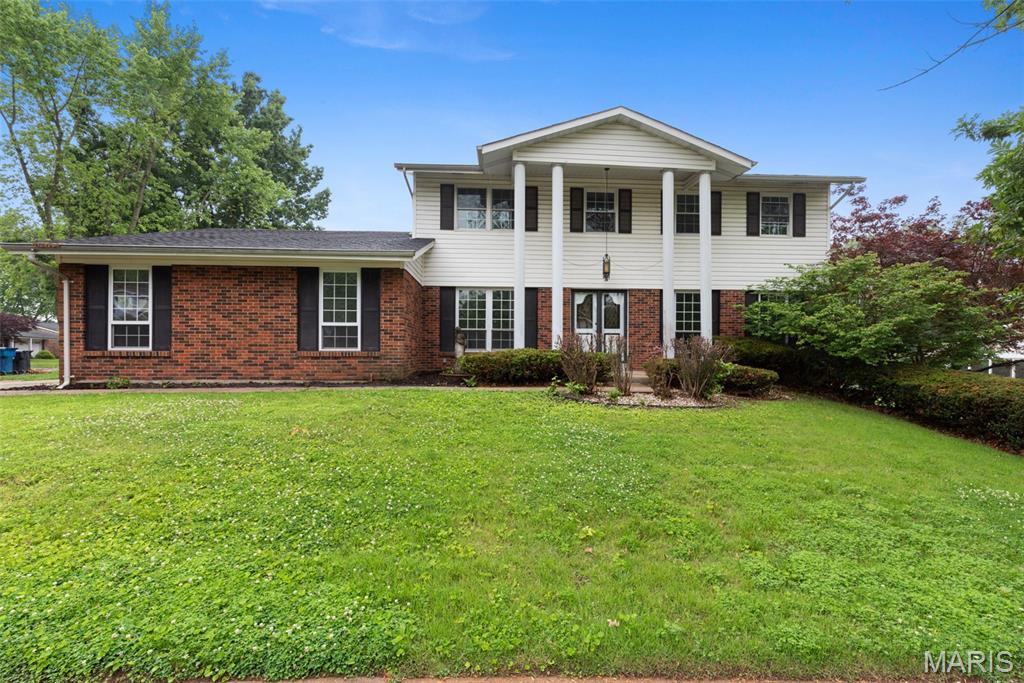
Active
$349,000
4
bds
|
3
ba
|
3,366
sqft
|
built
1978
14729 Mondoubleau Ln, Florissant, MO 63034
$-946
Cash flow
-14.1%
Cash-on-Cash Return
3.0%
Cap rate
0.5%
Rent to Value Ratio
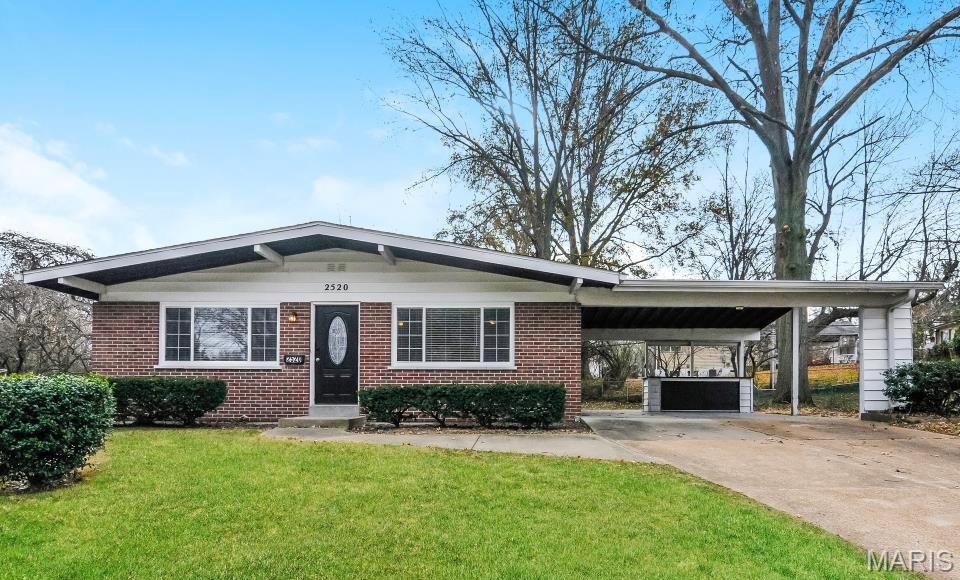
Active
$209,900
4
bds
|
2
ba
|
1,312
sqft
|
built
1956
2520 Furlong Ln, Florissant, MO 63033
$-40
Cash flow
-1.0%
Cash-on-Cash Return
6.1%
Cap rate
0.9%
Rent to Value Ratio
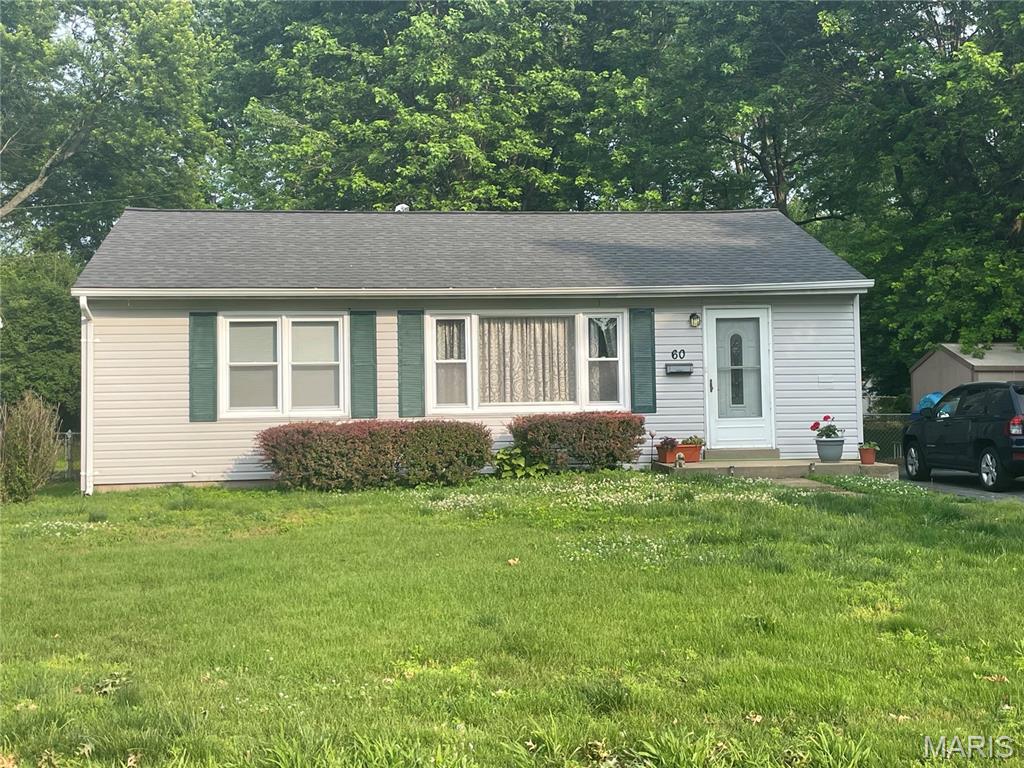
Active under contract
$162,900
4
bds
|
2
ba
|
1,512
sqft
|
built
1956
60 La Venta Dr, Florissant, MO 63031
$32
Cash flow
1.0%
Cash-on-Cash Return
6.5%
Cap rate
1.0%
Rent to Value Ratio
Active
$114,900
3
bds
|
2
ba
|
1,900
sqft
|
built
1974
619 Rosetta Dr, Florissant, MO 63031
$-108
Cash flow
-4.9%
Cash-on-Cash Return
5.2%
Cap rate
1.2%
Rent to Value Ratio
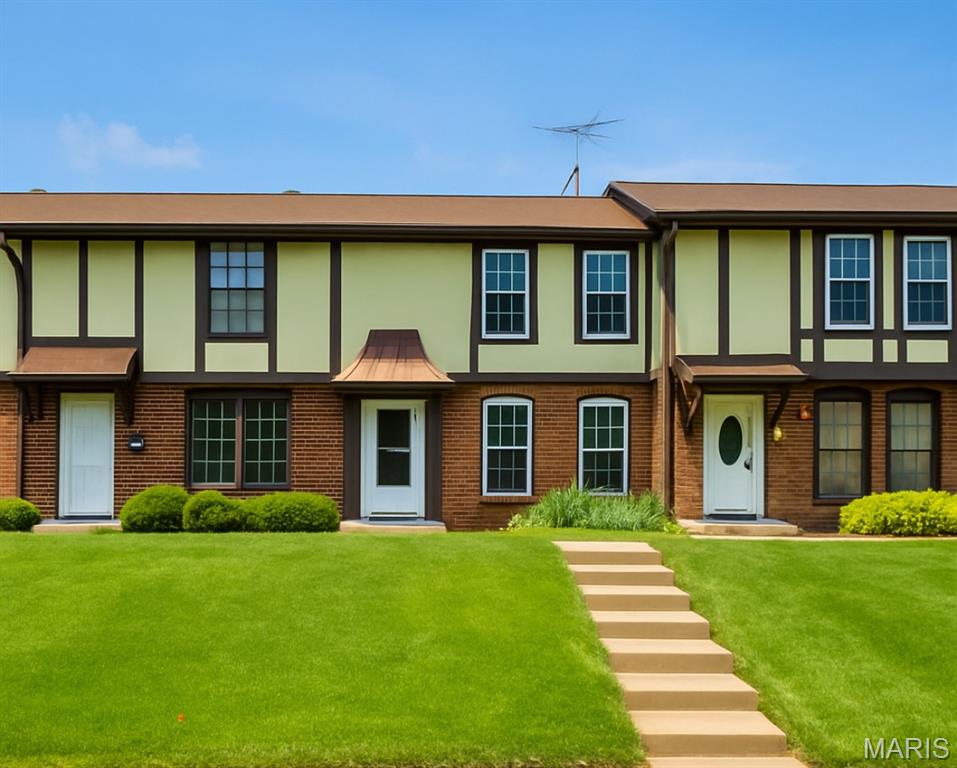
Active under contract
$150,000
4
bds
|
3
ba
|
1,642
sqft
|
built
1969
12911 Dunstone Dr, Florissant, MO 63033
$288
Cash flow
10.0%
Cash-on-Cash Return
8.6%
Cap rate
1.3%
Rent to Value Ratio
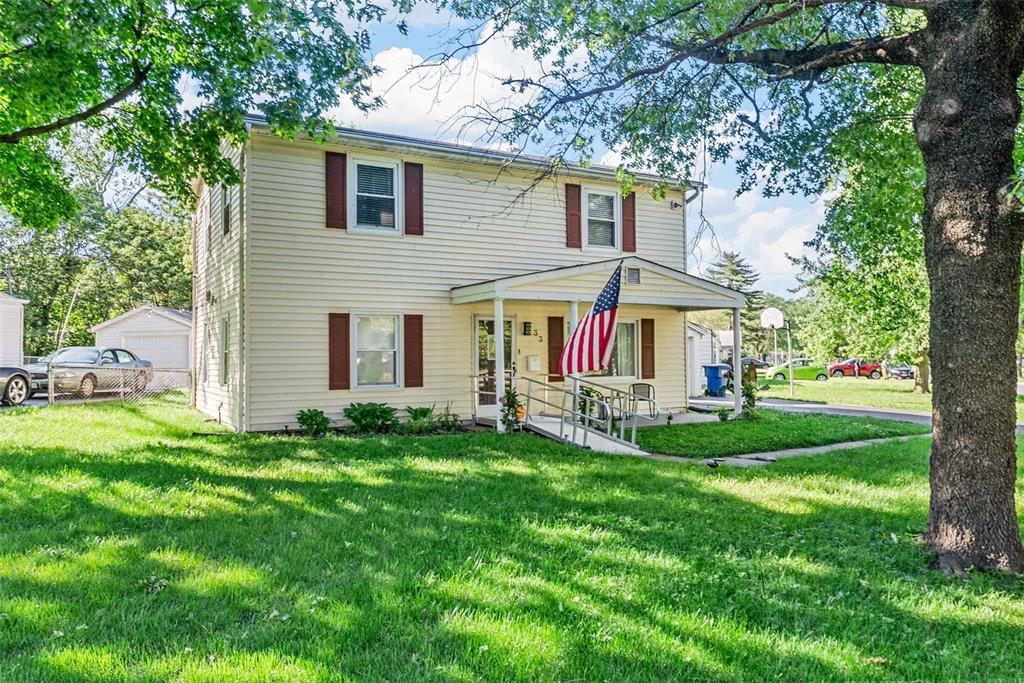
Pending
$199,900
6
bds
|
2
ba
|
1,806
sqft
|
built
1950
33 Saint Celeste Dr, Florissant, MO 63031
$-38
Cash flow
-1.0%
Cash-on-Cash Return
6.1%
Cap rate
0.9%
Rent to Value Ratio
Pending
$165,000
3
bds
|
2
ba
|
1,725
sqft
|
built
1964
2245 Patterson Rd, Florissant, MO 63031
$160
Cash flow
5.1%
Cash-on-Cash Return
7.4%
Cap rate
1.1%
Rent to Value Ratio
Active
$287,500
3
bds
|
3
ba
|
1,930
sqft
|
built
1965
11720 Sheffield Dr, Florissant, MO 63033
$156
Cash flow
2.8%
Cash-on-Cash Return
6.9%
Cap rate
1.0%
Rent to Value Ratio
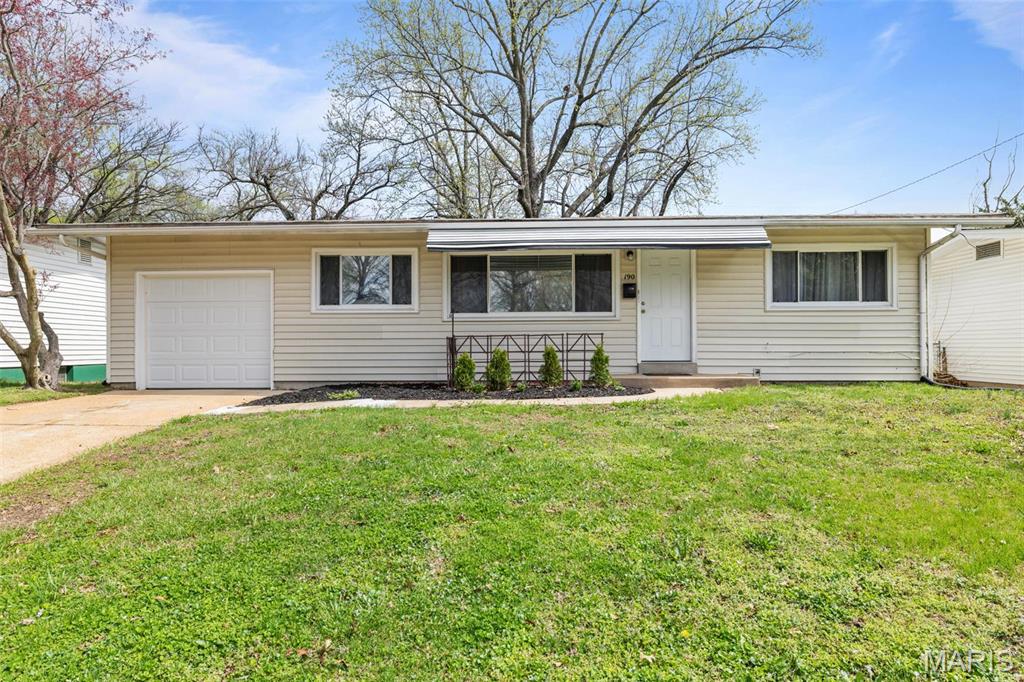
Active
$168,000
3
bds
|
1
ba
|
1,236
sqft
|
built
1957
190 Coteau Ln, Florissant, MO 63033
$95
Cash flow
3.0%
Cash-on-Cash Return
7.0%
Cap rate
1.0%
Rent to Value Ratio
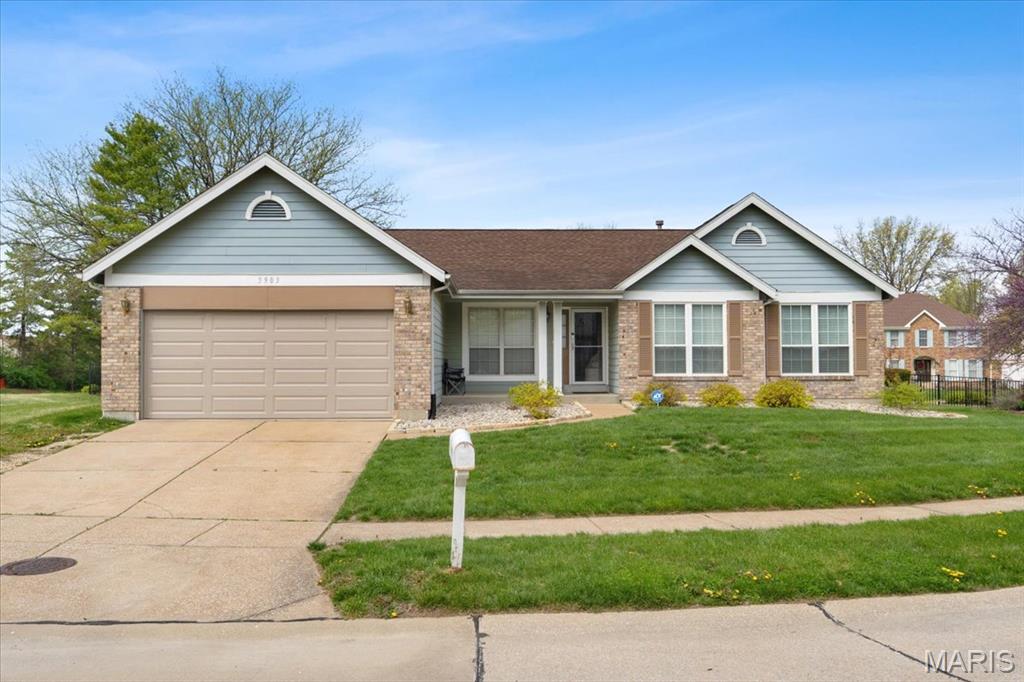
Pending
$300,000
3
bds
|
2
ba
|
2,050
sqft
|
built
1992
3903 Triple Crown Dr, Florissant, MO 63034
$-375
Cash flow
-6.5%
Cash-on-Cash Return
4.8%
Cap rate
0.8%
Rent to Value Ratio
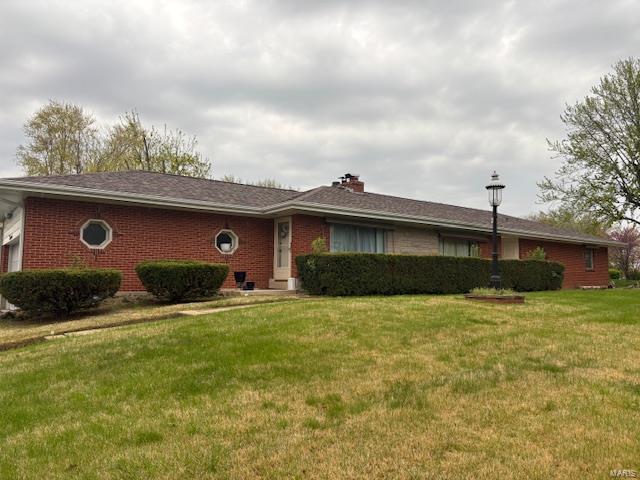
Pending
$225,000
bds
|
0
ba
|
2,366
sqft
|
built
1958
26 Ranchview Dr, Florissant, MO 63033
$-37
Cash flow
-0.9%
Cash-on-Cash Return
6.1%
Cap rate
0.9%
Rent to Value Ratio
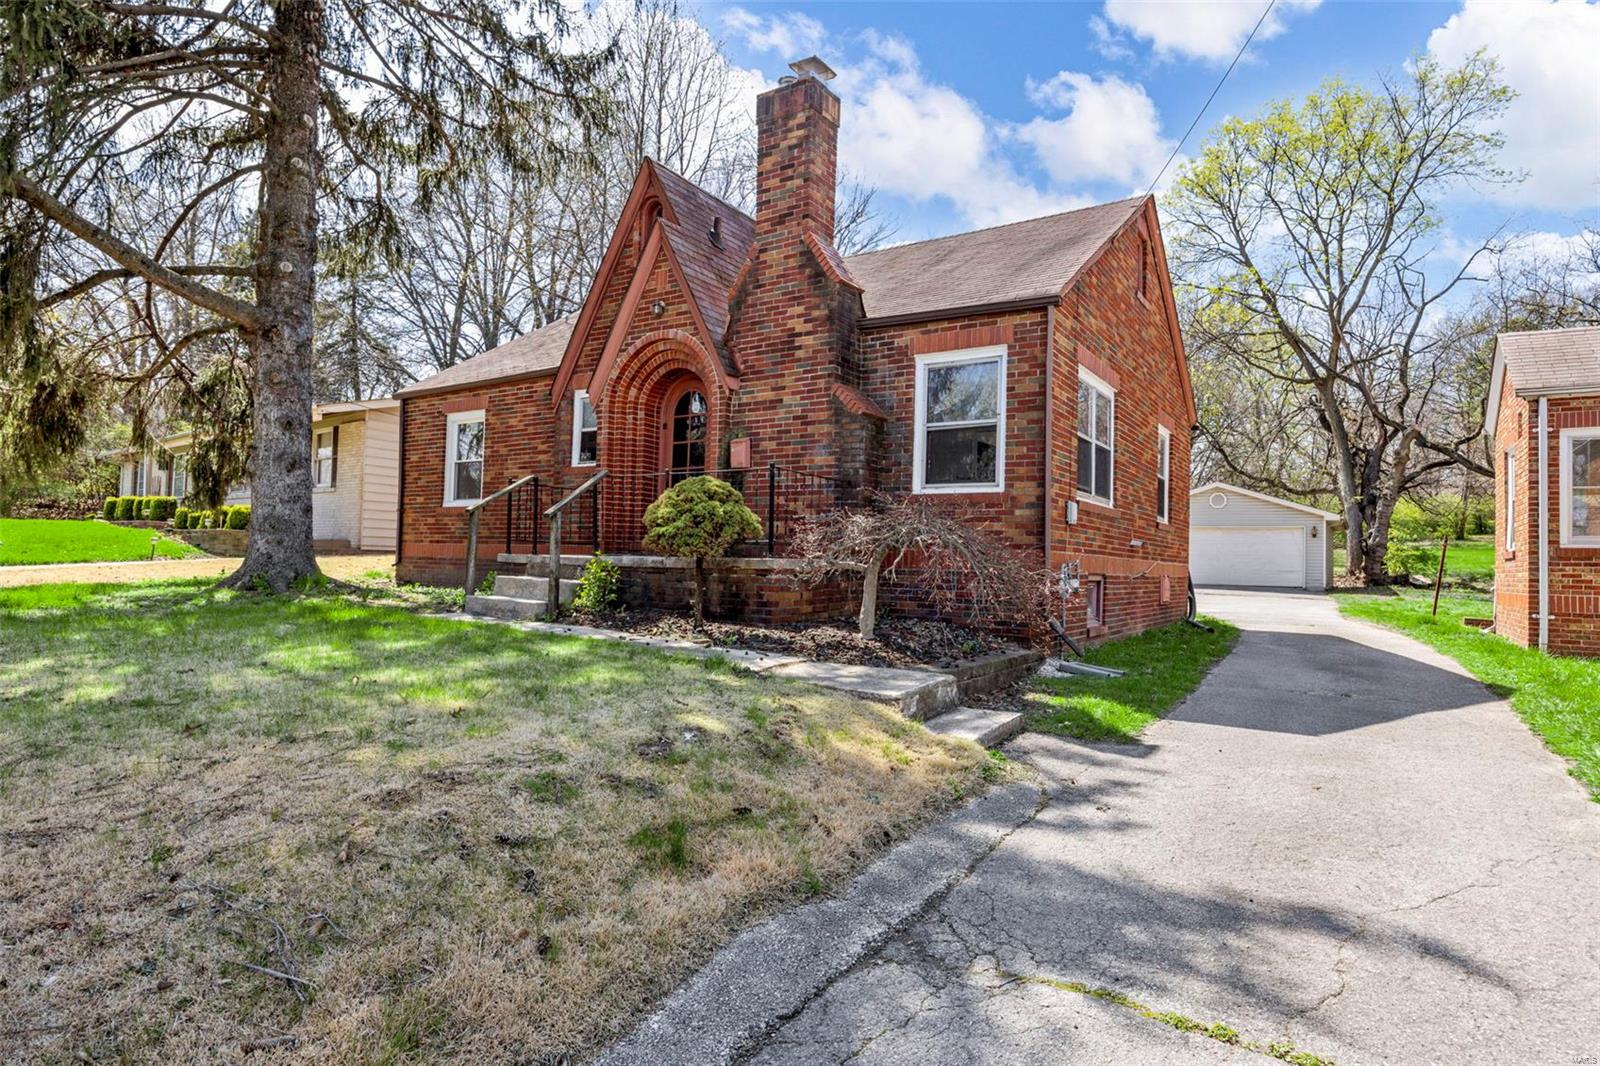
Active
$130,000
2
bds
|
1
ba
|
1,029
sqft
|
built
1938
1825 S New Florissant Rd, Florissant, MO 63031
$167
Cash flow
6.7%
Cash-on-Cash Return
7.8%
Cap rate
1.1%
Rent to Value Ratio
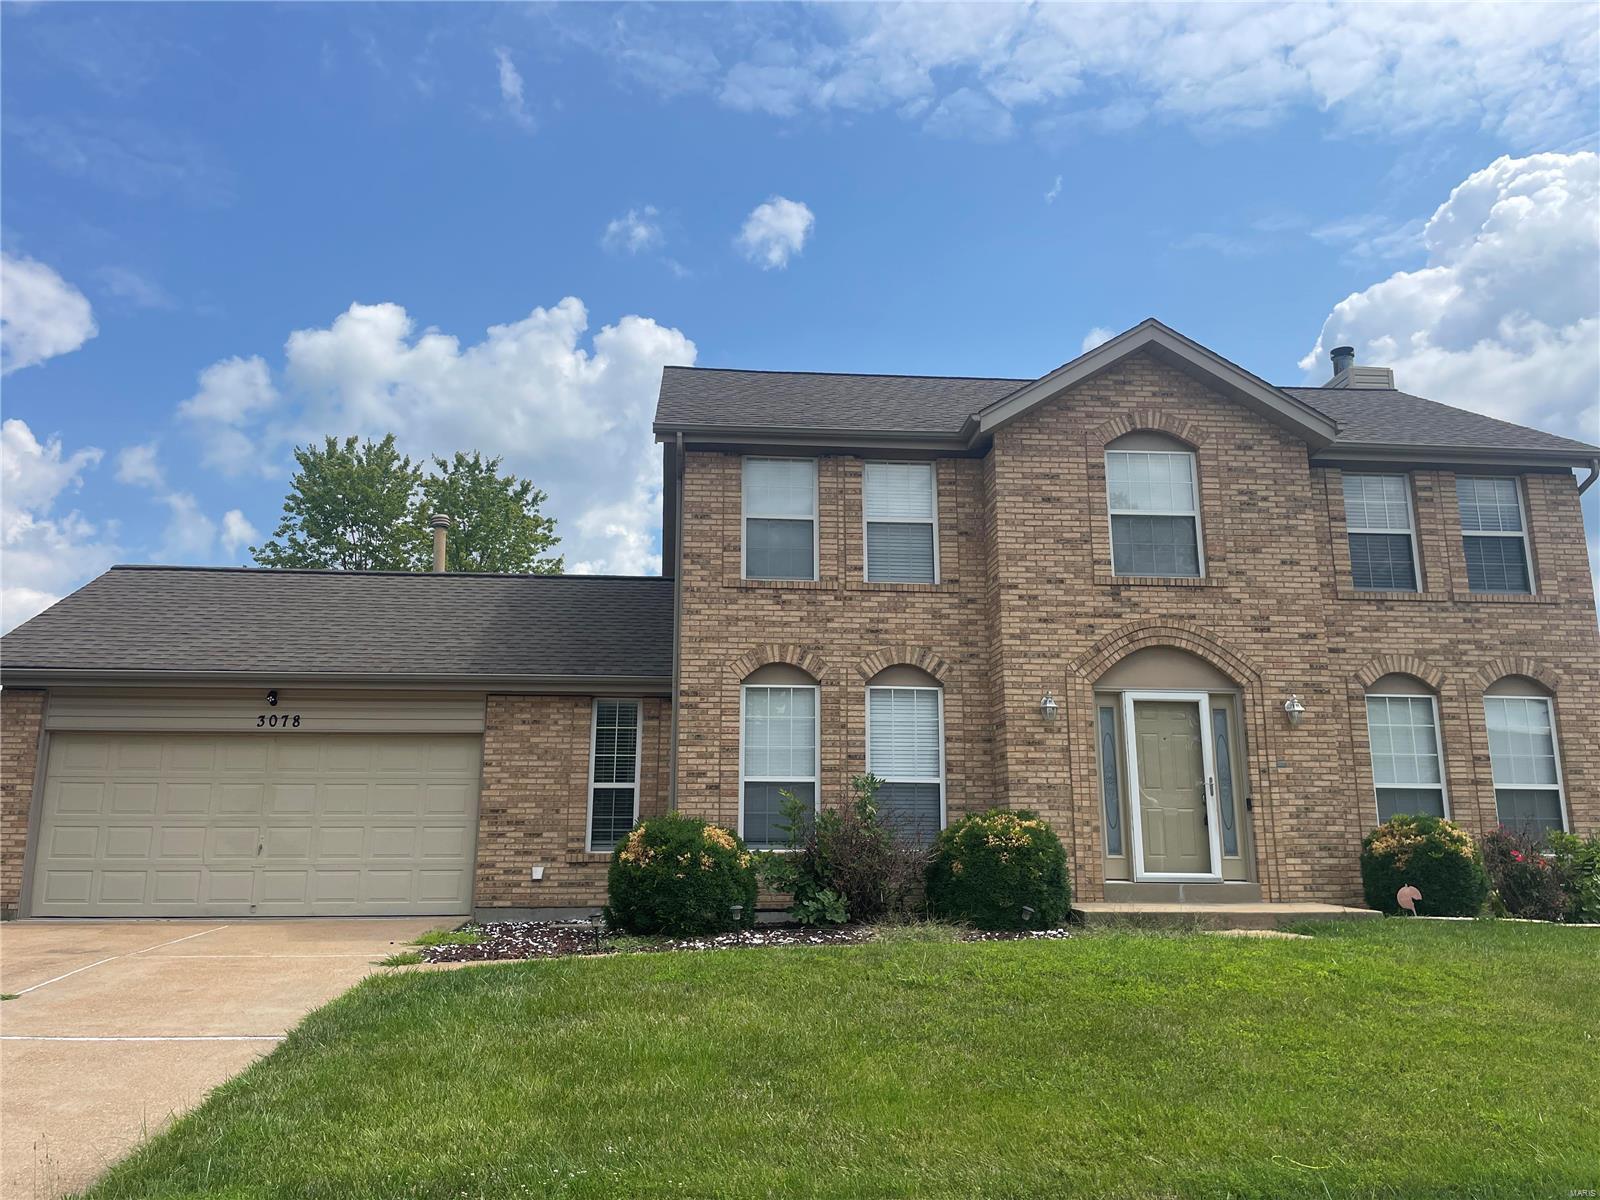
Active
$299,900
4
bds
|
3
ba
|
2,032
sqft
|
built
1987
3078 Willow Creek Estates Dr, Florissant, MO 63031
$-396
Cash flow
-6.9%
Cash-on-Cash Return
4.7%
Cap rate
0.7%
Rent to Value Ratio
Active
$229,900
3
bds
|
2
ba
|
1,008
sqft
|
built
1961
4410 Robbins Mill Rd, Florissant, MO 63034
$-359
Cash flow
-8.1%
Cash-on-Cash Return
4.4%
Cap rate
0.7%
Rent to Value Ratio
Pending
$120,000
3
bds
|
1
ba
|
1,044
sqft
|
built
1972
6081 Silver Fox Dr, Florissant, MO 63034
$301
Cash flow
13.1%
Cash-on-Cash Return
9.3%
Cap rate
1.3%
Rent to Value Ratio
Active
$99,000
3
bds
|
4
ba
|
1,296
sqft
|
built
1974
12435 Sea Lane Dr, Florissant, MO 63033
$470
Cash flow
24.8%
Cash-on-Cash Return
12.0%
Cap rate
1.6%
Rent to Value Ratio