Fort Lauderdale, FL Investment Properties for Sale
Browse homes for sale and investment properties in Fort Lauderdale, FL. Refine your search by price, property type, or more.
Best cash flowing properties in Fort Lauderdale, FL

Active
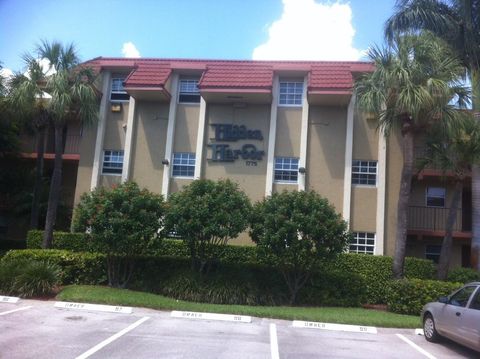
$195,000
2
bds
|
1
ba
|
875
sqft
|
built
1970
2171 NE 66th St, Fort Lauderdale, FL 33308
$-447
Cash flow
-12.0%
Cash-on-Cash Return
3.4%
Cap rate
0.9%
Rent to Value Ratio
Active
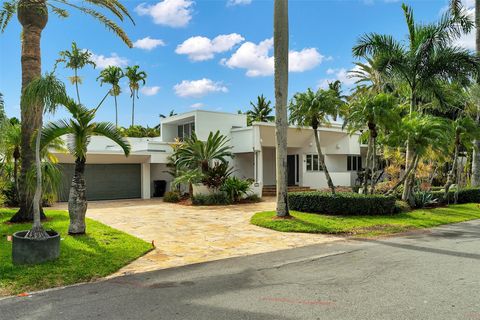
$440,000
3
bds
|
2
ba
|
1,565
sqft
|
built
1979
6101 NW 33rd Ter, Fort Lauderdale, FL 33309
$-505
Cash flow
-6.0%
Cash-on-Cash Return
4.8%
Cap rate
0.7%
Rent to Value Ratio
2,192 out of 2,568 properties for sale in Fort Lauderdale, FL
Limited Results Shown
Create a free account, or log in to reveal all property listings and enjoy the complete experience.
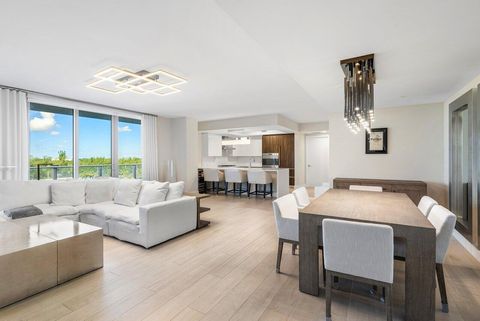
Active
$199,000
1
bds
|
1
ba
|
710
sqft
|
built
1965
2555 NE 11th St, Fort Lauderdale, FL 33304
$-700
Cash flow
-18.4%
Cash-on-Cash Return
1.9%
Cap rate
1.0%
Rent to Value Ratio

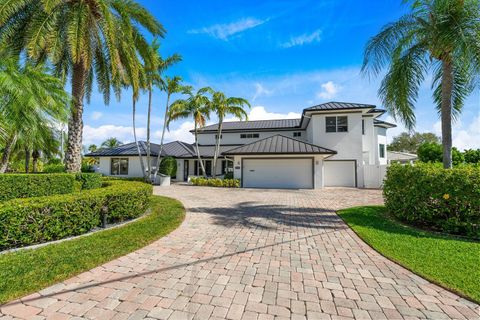
Active
$474,000
1
bds
|
1
ba
|
900
sqft
|
built
1964
2100 S Ocean Dr, Fort Lauderdale, FL 33316
$-1,902
Cash flow
-20.9%
Cash-on-Cash Return
1.3%
Cap rate
0.7%
Rent to Value Ratio
Active
$775,000
2
bds
|
2
ba
|
1,662
sqft
|
built
1974
3400 Galt Ocean Dr, Fort Lauderdale, FL 33308
$-3,429
Cash flow
-23.1%
Cash-on-Cash Return
0.8%
Cap rate
0.5%
Rent to Value Ratio

Active
$850,000
3
bds
|
2
ba
|
1,725
sqft
|
built
1956
1621 N Victoria Park Rd, Fort Lauderdale, FL 33305
$-1,549
Cash flow
-9.5%
Cash-on-Cash Return
4.0%
Cap rate
0.7%
Rent to Value Ratio

Active
$990,000
5
bds
|
3
ba
|
2,223
sqft
|
built
1966
1418 NE 57th Ct, Fort Lauderdale, FL 33334
$-744
Cash flow
-3.9%
Cash-on-Cash Return
5.2%
Cap rate
0.8%
Rent to Value Ratio
Active
$449,000
2
bds
|
2
ba
|
1,146
sqft
|
built
2005
313 NE 2nd St, Fort Lauderdale, FL 33301
$-1,593
Cash flow
-18.5%
Cash-on-Cash Return
1.9%
Cap rate
0.8%
Rent to Value Ratio
Active
$700,000
2
bds
|
2
ba
|
1,580
sqft
|
built
1969
3850 Galt Ocean Dr, Fort Lauderdale, FL 33308
$-2,556
Cash flow
-19.1%
Cash-on-Cash Return
1.8%
Cap rate
0.6%
Rent to Value Ratio
Active
$1,199,900
3
bds
|
3
ba
|
1,562
sqft
|
built
1936
800 SE 11th Ct, Fort Lauderdale, FL 33316
$-3,343
Cash flow
-14.5%
Cash-on-Cash Return
2.8%
Cap rate
0.5%
Rent to Value Ratio
Active
$363,000
2
bds
|
2
ba
|
1,344
sqft
|
built
1973
1170 N Federal Hwy, Fort Lauderdale, FL 33304
$-1,941
Cash flow
-27.9%
Cash-on-Cash Return
-0.3%
Cap rate
0.8%
Rent to Value Ratio
Active
$1,499,000
3
bds
|
2
ba
|
1,891
sqft
|
built
1949
1004 SE 11th St, Fort Lauderdale, FL 33316
$-3,680
Cash flow
-12.8%
Cash-on-Cash Return
3.2%
Cap rate
0.4%
Rent to Value Ratio

Active
$775,000
3
bds
|
2
ba
|
1,730
sqft
|
built
1952
1912 NE 16th Ter, Fort Lauderdale, FL 33305
$-1,457
Cash flow
-9.8%
Cash-on-Cash Return
3.9%
Cap rate
0.6%
Rent to Value Ratio
Active
$290,000
2
bds
|
2
ba
|
975
sqft
|
built
1973
333 NW 17th Ct, Fort Lauderdale, FL 33311
$-956
Cash flow
-17.2%
Cash-on-Cash Return
2.2%
Cap rate
0.8%
Rent to Value Ratio
Active
$5,699,000
4
bds
|
5
ba
|
3,529
sqft
|
built
1962
18 Nurmi Dr, Fort Lauderdale, FL 33301
$-26,769
Cash flow
-24.5%
Cash-on-Cash Return
0.5%
Cap rate
0.2%
Rent to Value Ratio
Active
$1,195,000
2
bds
|
3
ba
|
1,780
sqft
|
built
2018
1180 N Federal Hwy, Fort Lauderdale, FL 33304
$-3,900
Cash flow
-17.0%
Cash-on-Cash Return
2.2%
Cap rate
0.6%
Rent to Value Ratio
Active
$3,795,000
5
bds
|
5
ba
|
4,180
sqft
|
built
2017
5500 NE 31st Ave, Fort Lauderdale, FL 33308
$-15,476
Cash flow
-21.3%
Cash-on-Cash Return
1.3%
Cap rate
0.3%
Rent to Value Ratio
Active
$385,000
2
bds
|
2
ba
|
792
sqft
|
built
1965
1187 NW 29th Ter, Fort Lauderdale, FL 33311
$-837
Cash flow
-11.3%
Cash-on-Cash Return
3.5%
Cap rate
0.6%
Rent to Value Ratio
Active
$1,500,000
3
bds
|
4
ba
|
2,097
sqft
|
built
2020
3040 N Ocean Blvd, Fort Lauderdale, FL 33308
$-4,998
Cash flow
-17.4%
Cash-on-Cash Return
2.1%
Cap rate
0.7%
Rent to Value Ratio
Active
$359,900
1
bds
|
1
ba
|
850
sqft
|
built
1966
4010 Galt Ocean Dr, Fort Lauderdale, FL 33308
$-1,246
Cash flow
-18.1%
Cash-on-Cash Return
2.0%
Cap rate
0.8%
Rent to Value Ratio
Active
$1,250,000
3
bds
|
2
ba
|
2,000
sqft
|
built
1958
2117 NE 29th St, Fort Lauderdale, FL 33306
$-2,659
Cash flow
-11.1%
Cash-on-Cash Return
3.6%
Cap rate
0.5%
Rent to Value Ratio
Active
$1,349,000
3
bds
|
2
ba
|
2,084
sqft
|
built
1962
4731 NE 29th Ave, Fort Lauderdale, FL 33308
$-2,450
Cash flow
-9.5%
Cash-on-Cash Return
4.0%
Cap rate
0.5%
Rent to Value Ratio
Active
$755,000
2
bds
|
2
ba
|
1,640
sqft
|
built
1974
3400 Galt Ocean Dr, Fort Lauderdale, FL 33308
$-3,083
Cash flow
-21.3%
Cash-on-Cash Return
1.2%
Cap rate
0.6%
Rent to Value Ratio
Active
$195,000
2
bds
|
1
ba
|
875
sqft
|
built
1970
2171 NE 66th St, Fort Lauderdale, FL 33308
$-447
Cash flow
-12.0%
Cash-on-Cash Return
3.4%
Cap rate
0.9%
Rent to Value Ratio
Active
$450,000
1
bds
|
1
ba
|
900
sqft
|
built
1965
2100 S Ocean Dr, Fort Lauderdale, FL 33316
$-1,383
Cash flow
-16.0%
Cash-on-Cash Return
2.5%
Cap rate
0.7%
Rent to Value Ratio
Active
$779,000
3
bds
|
2
ba
|
1,494
sqft
|
built
1965
204 SW 19th Ave, Fort Lauderdale, FL 33312
$-1,375
Cash flow
-9.2%
Cash-on-Cash Return
4.0%
Cap rate
0.7%
Rent to Value Ratio
Active
$510,000
2
bds
|
2
ba
|
1,266
sqft
|
built
1985
520 Orton Ave, Fort Lauderdale, FL 33304
$-1,845
Cash flow
-18.9%
Cash-on-Cash Return
1.8%
Cap rate
0.5%
Rent to Value Ratio
Active
$440,000
3
bds
|
2
ba
|
1,565
sqft
|
built
1979
6101 NW 33rd Ter, Fort Lauderdale, FL 33309
$-505
Cash flow
-6.0%
Cash-on-Cash Return
4.8%
Cap rate
0.7%
Rent to Value Ratio

Active
$1,099,000
3
bds
|
2
ba
|
1,814
sqft
|
built
1997
5312 SW 34th Way, Fort Lauderdale, FL 33312
$-1,492
Cash flow
-7.1%
Cash-on-Cash Return
4.5%
Cap rate
0.7%
Rent to Value Ratio
Active
$325,000
1
bds
|
2
ba
|
900
sqft
|
built
1974
1301 River Reach Dr, Fort Lauderdale, FL 33315
$-1,188
Cash flow
-19.1%
Cash-on-Cash Return
1.8%
Cap rate
0.7%
Rent to Value Ratio
Active
$3,000,000
3
bds
|
3
ba
|
1,847
sqft
|
built
1960
1321 Mandarin Isle, Fort Lauderdale, FL 33315
$-11,982
Cash flow
-20.8%
Cash-on-Cash Return
1.4%
Cap rate
0.3%
Rent to Value Ratio

Active
$699,000
3
bds
|
2
ba
|
1,438
sqft
|
built
1961
2720 SW 19th St, Fort Lauderdale, FL 33312
$-1,344
Cash flow
-10.0%
Cash-on-Cash Return
3.8%
Cap rate
0.6%
Rent to Value Ratio
Active
$2,999,000
4
bds
|
3
ba
|
2,070
sqft
|
built
1956
1700 Marietta Dr, Fort Lauderdale, FL 33316
$-9,210
Cash flow
-16.0%
Cash-on-Cash Return
2.5%
Cap rate
0.4%
Rent to Value Ratio
Active
$449,000
2
bds
|
2
ba
|
1,136
sqft
|
built
2001
520 SE 5th Ave, Fort Lauderdale, FL 33301
$-1,526
Cash flow
-17.7%
Cash-on-Cash Return
2.1%
Cap rate
0.8%
Rent to Value Ratio

Active
$525,000
bds
|
0
ba
|
1,350
sqft
|
built
1986
1018 NW 6th Ave, Fort Lauderdale, FL 33311
$-1,878
Cash flow
-18.7%
Cash-on-Cash Return
1.9%
Cap rate
0.4%
Rent to Value Ratio
Active
$407,500
2
bds
|
2
ba
|
1,209
sqft
|
built
1969
2424 NE 9th St, Fort Lauderdale, FL 33304
$-2,371
Cash flow
-30.4%
Cash-on-Cash Return
-0.8%
Cap rate
0.3%
Rent to Value Ratio
Active
$339,000
1
bds
|
2
ba
|
950
sqft
|
built
1967
3209 NE 36th St, Fort Lauderdale, FL 33308
$-1,197
Cash flow
-18.4%
Cash-on-Cash Return
1.9%
Cap rate
0.8%
Rent to Value Ratio
Active
$5,950,000
4
bds
|
6
ba
|
3,422
sqft
|
built
2018
2200 N Ocean Blvd, Fort Lauderdale, FL 33305
$-38,206
Cash flow
-33.5%
Cash-on-Cash Return
-1.6%
Cap rate
0.2%
Rent to Value Ratio
Active
$830,000
3
bds
|
2
ba
|
1,510
sqft
|
built
2002
3020 NE 32nd Ave, Fort Lauderdale, FL 33308
$-3,187
Cash flow
-20.0%
Cash-on-Cash Return
1.5%
Cap rate
0.7%
Rent to Value Ratio
Active
$630,000
3
bds
|
2
ba
|
1,302
sqft
|
built
1969
5801 NE 17th Ave, Fort Lauderdale, FL 33334
$-1,526
Cash flow
-12.6%
Cash-on-Cash Return
3.2%
Cap rate
0.6%
Rent to Value Ratio
Active
$1,795,000
4
bds
|
4
ba
|
3,011
sqft
|
built
2008
736 NE 17th Way, Fort Lauderdale, FL 33304
$-3,070
Cash flow
-8.9%
Cash-on-Cash Return
4.1%
Cap rate
0.6%
Rent to Value Ratio

Active
$850,000
1
bds
|
2
ba
|
910
sqft
|
built
1981
209 N Fort Lauderdale Beach Blvd, Fort Lauderdale, FL 33304
$-3,159
Cash flow
-19.4%
Cash-on-Cash Return
1.7%
Cap rate
0.5%
Rent to Value Ratio