Fort Lauderdale, FL Investment Properties for Sale
Browse homes for sale and investment properties in Fort Lauderdale, FL. Refine your search by price, property type, or more.
Best cash flowing properties in Fort Lauderdale, FL
Active
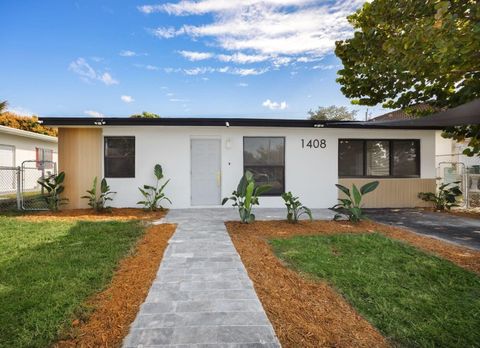
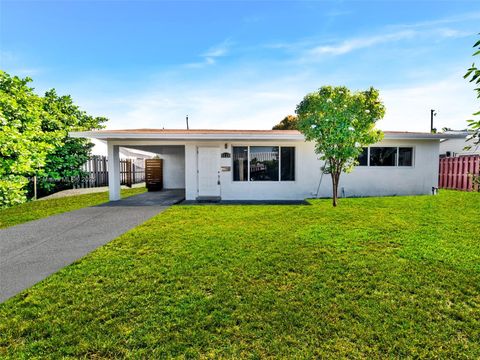
$374,500
3
bds
|
1
ba
|
1,132
sqft
|
built
1960
1408 NW 24th Ter, Fort Lauderdale, FL 33311
$-89
Cash flow
-1.2%
Cash-on-Cash Return
5.9%
Cap rate
0.8%
Rent to Value Ratio
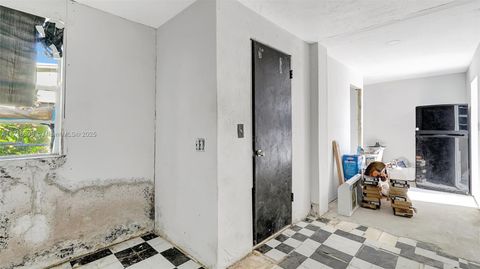
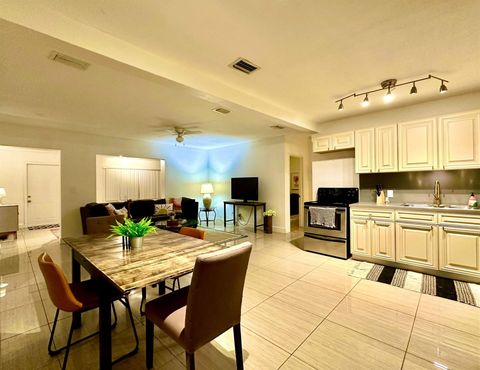
Active
$349,998
3
bds
|
1
ba
|
912
sqft
|
built
1957
1240 SW 32nd Ave, Fort Lauderdale, FL 33312
$-275
Cash flow
-4.1%
Cash-on-Cash Return
5.2%
Cap rate
0.8%
Rent to Value Ratio
2,200 out of 2,578 properties for sale in Fort Lauderdale, FL
Limited Results Shown
Create a free account, or log in to reveal all property listings and enjoy the complete experience.
Active
$374,500
3
bds
|
1
ba
|
1,132
sqft
|
built
1960
1408 NW 24th Ter, Fort Lauderdale, FL 33311
$-89
Cash flow
-1.2%
Cash-on-Cash Return
5.9%
Cap rate
0.8%
Rent to Value Ratio
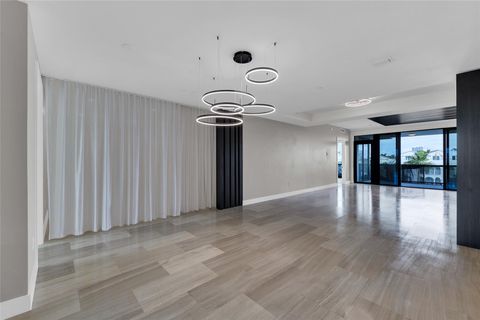
Active
$455,000
3
bds
|
2
ba
|
1,127
sqft
|
built
1972
1800 NW 14th Ave, Fort Lauderdale, FL 33311
$-748
Cash flow
-8.6%
Cash-on-Cash Return
4.2%
Cap rate
0.7%
Rent to Value Ratio
Active
$460,000
3
bds
|
2
ba
|
1,440
sqft
|
built
2005
533 NE 3rd Ave, Fort Lauderdale, FL 33301
$-1,906
Cash flow
-21.6%
Cash-on-Cash Return
1.2%
Cap rate
0.7%
Rent to Value Ratio
Active
$3,850,000
3
bds
|
4
ba
|
2,312
sqft
|
built
1956
3018 NE 26th St, Fort Lauderdale, FL 33305
$-14,687
Cash flow
-19.9%
Cash-on-Cash Return
1.6%
Cap rate
0.3%
Rent to Value Ratio

Active
$1,350,000
4
bds
|
3
ba
|
1,565
sqft
|
built
1975
5131 NE 26th Ave, Fort Lauderdale, FL 33308
$-2,110
Cash flow
-8.2%
Cash-on-Cash Return
4.3%
Cap rate
0.7%
Rent to Value Ratio
Active
$450,000
2
bds
|
2
ba
|
1,657
sqft
|
built
1966
3430 Galt Ocean Dr, Fort Lauderdale, FL 33308
$-2,239
Cash flow
-26.0%
Cash-on-Cash Return
0.2%
Cap rate
0.8%
Rent to Value Ratio
Active
$1,150,000
3
bds
|
2
ba
|
1,636
sqft
|
built
1955
833 NE 17th Ct, Fort Lauderdale, FL 33305
$-3,380
Cash flow
-15.3%
Cash-on-Cash Return
2.6%
Cap rate
0.4%
Rent to Value Ratio
Active
$9,450,000
4
bds
|
5
ba
|
3,767
sqft
|
built
2018
2200 N Ocean Blvd, Fort Lauderdale, FL 33305
$-56,816
Cash flow
-31.4%
Cash-on-Cash Return
-1.1%
Cap rate
0.1%
Rent to Value Ratio
Active
$295,000
2
bds
|
2
ba
|
1,144
sqft
|
built
1974
3015 N Ocean Blvd, Fort Lauderdale, FL 33308
$-900
Cash flow
-15.9%
Cash-on-Cash Return
2.5%
Cap rate
1.2%
Rent to Value Ratio
Active
$265,000
2
bds
|
2
ba
|
1,102
sqft
|
built
1976
6000 NE 22nd Way, Fort Lauderdale, FL 33308
$-570
Cash flow
-11.2%
Cash-on-Cash Return
3.6%
Cap rate
0.9%
Rent to Value Ratio
Active
$595,000
2
bds
|
2
ba
|
1,250
sqft
|
built
1972
1350 River Reach Dr, Fort Lauderdale, FL 33315
$-2,020
Cash flow
-17.7%
Cash-on-Cash Return
2.1%
Cap rate
0.7%
Rent to Value Ratio
Active
$4,280,000
4
bds
|
5
ba
|
3,896
sqft
|
built
2020
100 E Las Olas Blvd, Fort Lauderdale, FL 33301
$-23,202
Cash flow
-28.3%
Cash-on-Cash Return
-0.4%
Cap rate
0.2%
Rent to Value Ratio
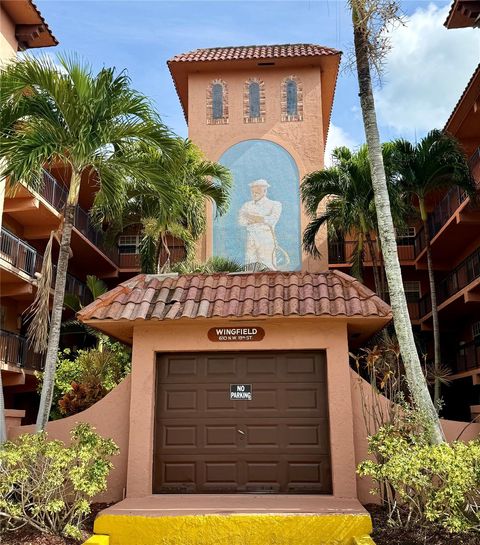
Active
$279,500
2
bds
|
2
ba
|
1,008
sqft
|
built
1971
610 Tennis Club Dr, Fort Lauderdale, FL 33311
$-949
Cash flow
-17.7%
Cash-on-Cash Return
2.1%
Cap rate
0.8%
Rent to Value Ratio
Active
$3,950,000
4
bds
|
4
ba
|
2,734
sqft
|
built
1966
3061 NE 42nd St, Fort Lauderdale, FL 33308
$-15,483
Cash flow
-20.5%
Cash-on-Cash Return
1.4%
Cap rate
0.3%
Rent to Value Ratio
Active
$999,000
3
bds
|
2
ba
|
1,273
sqft
|
built
1973
1662 S Ocean Ln, Fort Lauderdale, FL 33316
$-3,319
Cash flow
-17.3%
Cash-on-Cash Return
2.2%
Cap rate
0.6%
Rent to Value Ratio

Active
$334,000
2
bds
|
2
ba
|
1,054
sqft
|
built
2007
2009 SE 10th Ave, Fort Lauderdale, FL 33316
$-1,214
Cash flow
-19.0%
Cash-on-Cash Return
1.8%
Cap rate
0.7%
Rent to Value Ratio
Active
$2,300,000
1
bds
|
2
ba
|
1,355
sqft
|
built
2018
2200 N Ocean Blvd, Fort Lauderdale, FL 33305
$-10,165
Cash flow
-23.1%
Cash-on-Cash Return
0.8%
Cap rate
0.4%
Rent to Value Ratio
Active
$349,998
3
bds
|
1
ba
|
912
sqft
|
built
1957
1240 SW 32nd Ave, Fort Lauderdale, FL 33312
$-275
Cash flow
-4.1%
Cash-on-Cash Return
5.2%
Cap rate
0.8%
Rent to Value Ratio

Active
$15,650,000
5
bds
|
9
ba
|
5,822
sqft
|
built
2018
2200 N Ocean Blvd, Fort Lauderdale, FL 33305
$-100,191
Cash flow
-33.4%
Cash-on-Cash Return
-1.5%
Cap rate
0.1%
Rent to Value Ratio
Active
$435,000
3
bds
|
2
ba
|
984
sqft
|
built
1954
939 NW 12th St, Fort Lauderdale, FL 33311
$-408
Cash flow
-4.9%
Cash-on-Cash Return
5.0%
Cap rate
0.7%
Rent to Value Ratio
Active
$1,490,000
bds
|
0
ba
|
2,474
sqft
|
built
1951
2904 N Ocean Blvd, Fort Lauderdale, FL 33308
$-6,018
Cash flow
-21.1%
Cash-on-Cash Return
1.3%
Cap rate
0.3%
Rent to Value Ratio
Active
$229,500
1
bds
|
1
ba
|
568
sqft
|
built
1960
401 NE 16th Ave, Fort Lauderdale, FL 33301
$-727
Cash flow
-16.5%
Cash-on-Cash Return
2.3%
Cap rate
0.9%
Rent to Value Ratio
Active
$475,000
2
bds
|
2
ba
|
1,225
sqft
|
built
2005
110 N Federal Hwy, Fort Lauderdale, FL 33301
$-1,415
Cash flow
-15.5%
Cash-on-Cash Return
2.6%
Cap rate
0.7%
Rent to Value Ratio
Active
$538,000
2
bds
|
2
ba
|
1,787
sqft
|
built
1970
3750 Galt Ocean Dr, Fort Lauderdale, FL 33308
$-2,393
Cash flow
-23.2%
Cash-on-Cash Return
0.8%
Cap rate
0.7%
Rent to Value Ratio
Active
$555,000
2
bds
|
2
ba
|
1,400
sqft
|
built
1970
3100 NE 49th St, Fort Lauderdale, FL 33308
$-2,829
Cash flow
-26.6%
Cash-on-Cash Return
0.0%
Cap rate
0.5%
Rent to Value Ratio
Active
$1,586,000
3
bds
|
4
ba
|
2,130
sqft
|
built
2001
2110 N Ocean Blvd, Fort Lauderdale, FL 33305
$-6,081
Cash flow
-20.0%
Cash-on-Cash Return
1.5%
Cap rate
0.6%
Rent to Value Ratio
Active
$199,900
2
bds
|
2
ba
|
1,000
sqft
|
built
1976
1400 NE 54th St, Fort Lauderdale, FL 33334
$-532
Cash flow
-13.9%
Cash-on-Cash Return
3.0%
Cap rate
1.1%
Rent to Value Ratio
Active
$350,000
2
bds
|
2
ba
|
1,200
sqft
|
built
1974
6397 Bay Club Dr, Fort Lauderdale, FL 33308
$-1,198
Cash flow
-17.9%
Cash-on-Cash Return
2.0%
Cap rate
0.7%
Rent to Value Ratio

Active
$625,000
1
bds
|
2
ba
|
641
sqft
|
built
2009
551 N Fort Lauderdale Beach Blvd, Fort Lauderdale, FL 33304
$-2,566
Cash flow
-21.4%
Cash-on-Cash Return
1.2%
Cap rate
0.7%
Rent to Value Ratio
Active
$175,000
2
bds
|
2
ba
|
1,100
sqft
|
built
1969
2151 NE 68th St, Fort Lauderdale, FL 33308
$-586
Cash flow
-17.5%
Cash-on-Cash Return
2.1%
Cap rate
1.0%
Rent to Value Ratio
Active
$465,000
1
bds
|
2
ba
|
1,320
sqft
|
built
1967
4100 Galt Ocean Dr, Fort Lauderdale, FL 33308
$-1,252
Cash flow
-14.0%
Cash-on-Cash Return
2.9%
Cap rate
0.8%
Rent to Value Ratio

Active
$799,000
2
bds
|
2
ba
|
1,450
sqft
|
built
1967
4300 N Ocean Blvd, Fort Lauderdale, FL 33308
$-2,900
Cash flow
-18.9%
Cash-on-Cash Return
1.8%
Cap rate
0.7%
Rent to Value Ratio
Active
$2,200,000
3
bds
|
4
ba
|
3,910
sqft
|
built
2001
209 N Birch Rd, Fort Lauderdale, FL 33304
$-10,878
Cash flow
-25.8%
Cash-on-Cash Return
0.2%
Cap rate
0.4%
Rent to Value Ratio
Active
$3,100,000
4
bds
|
4
ba
|
2,832
sqft
|
built
1967
41 Castle Harbor Is, Fort Lauderdale, FL 33308
$-11,890
Cash flow
-20.0%
Cash-on-Cash Return
1.5%
Cap rate
0.4%
Rent to Value Ratio
Active
$5,275,000
4
bds
|
5
ba
|
3,100
sqft
|
built
2023
3230 NE 59th St, Fort Lauderdale, FL 33308
$-24,342
Cash flow
-24.1%
Cash-on-Cash Return
0.6%
Cap rate
0.2%
Rent to Value Ratio
Active
$589,000
2
bds
|
2
ba
|
1,559
sqft
|
built
1977
3100 NE 48th St, Fort Lauderdale, FL 33308
$-2,580
Cash flow
-22.9%
Cash-on-Cash Return
0.9%
Cap rate
0.6%
Rent to Value Ratio
Active
$1,045,000
2
bds
|
2
ba
|
1,182
sqft
|
built
1956
1208 Guava Isle, Fort Lauderdale, FL 33315
$-3,001
Cash flow
-15.0%
Cash-on-Cash Return
2.7%
Cap rate
0.5%
Rent to Value Ratio
Active
$950,000
3
bds
|
2
ba
|
1,000
sqft
|
built
2000
1520 NE 14th Ter, Fort Lauderdale, FL 33304
$-2,931
Cash flow
-16.1%
Cash-on-Cash Return
2.4%
Cap rate
0.4%
Rent to Value Ratio
Active
$719,000
5
bds
|
3
ba
|
2,016
sqft
|
built
1950
1501 NE 3rd Ave, Fort Lauderdale, FL 33304
$-1,330
Cash flow
-9.7%
Cash-on-Cash Return
3.9%
Cap rate
0.6%
Rent to Value Ratio
Active
$1,999,000
2
bds
|
2
ba
|
2,321
sqft
|
built
2015
60 Hendricks Isle, Fort Lauderdale, FL 33301
$-9,286
Cash flow
-24.2%
Cash-on-Cash Return
0.6%
Cap rate
0.4%
Rent to Value Ratio