Fort Lauderdale, FL Investment Properties for Sale
Browse homes for sale and investment properties in Fort Lauderdale, FL. Refine your search by price, property type, or more.
Best cash flowing properties in Fort Lauderdale, FL

Active
$160,000
1
bds
|
1
ba
|
690
sqft
|
built
1968
2101 NE 68th St, Fort Lauderdale, FL 33308
$-123
Cash flow
-4.0%
Cash-on-Cash Return
5.2%
Cap rate
1.1%
Rent to Value Ratio
Active
$225,000
1
bds
|
1
ba
|
702
sqft
|
built
1987
5200 NW 31st Ave, Fort Lauderdale, FL 33309
$-428
Cash flow
-9.9%
Cash-on-Cash Return
3.9%
Cap rate
0.8%
Rent to Value Ratio
2,096 out of 2,470 properties for sale in Fort Lauderdale, FL
Limited Results Shown
Create a free account, or log in to reveal all property listings and enjoy the complete experience.

Active
$185,000
1
bds
|
1
ba
|
581
sqft
|
built
1974
1470 N Dixie Hwy, Fort Lauderdale, FL 33304
$-454
Cash flow
-12.8%
Cash-on-Cash Return
3.2%
Cap rate
0.9%
Rent to Value Ratio
Active
$400,000
1
bds
|
1
ba
|
801
sqft
|
built
2006
511 SE 5th Ave, Fort Lauderdale, FL 33301
$-1,245
Cash flow
-16.2%
Cash-on-Cash Return
2.4%
Cap rate
0.7%
Rent to Value Ratio
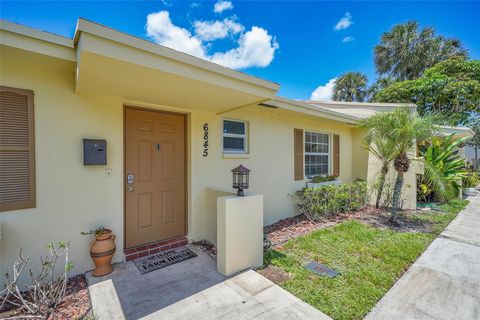
Active
$249,000
2
bds
|
1
ba
|
1,000
sqft
|
built
1972
6845 NW 30th Ave, Fort Lauderdale, FL 33309
$-785
Cash flow
-16.4%
Cash-on-Cash Return
2.4%
Cap rate
0.8%
Rent to Value Ratio
Active
$679,000
2
bds
|
2
ba
|
1,275
sqft
|
built
2004
401 SW 4th Ave, Fort Lauderdale, FL 33315
$-1,638
Cash flow
-12.6%
Cash-on-Cash Return
3.3%
Cap rate
0.5%
Rent to Value Ratio
Active
$585,000
4
bds
|
2
ba
|
1,856
sqft
|
built
1953
3101 SW 16th St, Fort Lauderdale, FL 33312
$-434
Cash flow
-3.9%
Cash-on-Cash Return
5.3%
Cap rate
0.8%
Rent to Value Ratio

Active
$998,500
3
bds
|
3
ba
|
1,686
sqft
|
built
2005
2001 N Ocean Blvd, Fort Lauderdale, FL 33305
$-4,866
Cash flow
-25.4%
Cash-on-Cash Return
0.3%
Cap rate
0.5%
Rent to Value Ratio
Active
$775,000
3
bds
|
2
ba
|
1,222
sqft
|
built
1956
5189 SW 28th Ave, Fort Lauderdale, FL 33312
$-1,113
Cash flow
-7.5%
Cash-on-Cash Return
4.4%
Cap rate
0.6%
Rent to Value Ratio

Pending
$170,000
1
bds
|
1
ba
|
580
sqft
|
built
1966
5050 Bayview Dr, Fort Lauderdale, FL 33308
$-433
Cash flow
-13.3%
Cash-on-Cash Return
3.1%
Cap rate
0.9%
Rent to Value Ratio

Active
$629,900
3
bds
|
2
ba
|
1,255
sqft
|
built
1961
928 NE 18th Ct, Fort Lauderdale, FL 33305
$-1,248
Cash flow
-10.3%
Cash-on-Cash Return
3.8%
Cap rate
0.6%
Rent to Value Ratio

Active
$630,000
bds
|
0
ba
|
1,642
sqft
|
built
1957
1309 NE 3rd Ave, Fort Lauderdale, FL 33304
$-1,945
Cash flow
-16.1%
Cash-on-Cash Return
2.4%
Cap rate
0.4%
Rent to Value Ratio

Active
$459,000
2
bds
|
2
ba
|
1,072
sqft
|
built
2007
315 NE 3rd Ave, Fort Lauderdale, FL 33301
$-2,190
Cash flow
-24.9%
Cash-on-Cash Return
0.4%
Cap rate
0.7%
Rent to Value Ratio

Active
$539,000
2
bds
|
2
ba
|
1,300
sqft
|
built
1963
818 SE 4th St, Fort Lauderdale, FL 33301
$-1,687
Cash flow
-16.3%
Cash-on-Cash Return
2.4%
Cap rate
0.7%
Rent to Value Ratio

Active under contract
$1,395,000
4
bds
|
0
ba
|
1,755
sqft
|
built
1954
16 SE 9th Ave, Fort Lauderdale, FL 33301
$-4,892
Cash flow
-18.3%
Cash-on-Cash Return
1.9%
Cap rate
0.4%
Rent to Value Ratio
Active
$489,900
2
bds
|
2
ba
|
1,220
sqft
|
built
2005
110 N Federal Hwy, Fort Lauderdale, FL 33301
$-2,081
Cash flow
-22.2%
Cash-on-Cash Return
1.1%
Cap rate
0.7%
Rent to Value Ratio

Active
$1,690,000
3
bds
|
3
ba
|
1,900
sqft
|
built
2015
151 Isle Of Venice Dr, Fort Lauderdale, FL 33301
$-7,012
Cash flow
-21.6%
Cash-on-Cash Return
1.2%
Cap rate
0.5%
Rent to Value Ratio

Active
$425,000
3
bds
|
2
ba
|
1,450
sqft
|
built
1961
4460 NW 59th Ct, Fort Lauderdale, FL 33319
$-605
Cash flow
-7.4%
Cash-on-Cash Return
4.4%
Cap rate
0.7%
Rent to Value Ratio
Active
$299,900
1
bds
|
2
ba
|
900
sqft
|
built
1972
1350 River Reach Dr, Fort Lauderdale, FL 33315
$-1,195
Cash flow
-20.8%
Cash-on-Cash Return
1.4%
Cap rate
0.7%
Rent to Value Ratio

Active
$584,900
2
bds
|
1
ba
|
1,072
sqft
|
built
1956
1032 SW 15th Ter, Fort Lauderdale, FL 33312
$-1,224
Cash flow
-10.9%
Cash-on-Cash Return
3.6%
Cap rate
0.5%
Rent to Value Ratio

Active
$575,000
2
bds
|
2
ba
|
1,585
sqft
|
built
1959
333 Sunset Dr, Fort Lauderdale, FL 33301
$-2,619
Cash flow
-23.8%
Cash-on-Cash Return
0.7%
Cap rate
0.7%
Rent to Value Ratio

Active
$1,499,000
6
bds
|
4
ba
|
3,087
sqft
|
built
1968
1820 NE 59th Ct, Fort Lauderdale, FL 33308
$-4,189
Cash flow
-14.6%
Cash-on-Cash Return
2.8%
Cap rate
0.5%
Rent to Value Ratio

Active
$1,250,000
bds
|
0
ba
|
2,167
sqft
|
built
1954
843 NE 17th Ave, Fort Lauderdale, FL 33304
$-5,548
Cash flow
-23.2%
Cash-on-Cash Return
0.8%
Cap rate
0.3%
Rent to Value Ratio
Active
$570,000
2
bds
|
2
ba
|
1,100
sqft
|
built
1976
2841 N Ocean Blvd, Fort Lauderdale, FL 33308
$-2,438
Cash flow
-22.3%
Cash-on-Cash Return
1.0%
Cap rate
0.6%
Rent to Value Ratio
Active
$12,995,000
6
bds
|
8
ba
|
7,190
sqft
|
built
2020
2519 Lucille Dr, Fort Lauderdale, FL 33316
$-75,352
Cash flow
-30.3%
Cash-on-Cash Return
-0.8%
Cap rate
0.1%
Rent to Value Ratio
Active
$160,000
1
bds
|
1
ba
|
690
sqft
|
built
1968
2101 NE 68th St, Fort Lauderdale, FL 33308
$-123
Cash flow
-4.0%
Cash-on-Cash Return
5.2%
Cap rate
1.1%
Rent to Value Ratio

Active
$230,000
2
bds
|
2
ba
|
1,056
sqft
|
built
1973
670 Tennis Club Dr, Fort Lauderdale, FL 33311
$-693
Cash flow
-15.7%
Cash-on-Cash Return
2.5%
Cap rate
1.0%
Rent to Value Ratio

Active
$295,000
1
bds
|
1
ba
|
840
sqft
|
built
1979
6160 NW 31st Ter, Fort Lauderdale, FL 33309
$-609
Cash flow
-10.8%
Cash-on-Cash Return
3.7%
Cap rate
0.7%
Rent to Value Ratio

Active
$235,000
2
bds
|
2
ba
|
900
sqft
|
built
1968
1400 NE 57th Ct, Fort Lauderdale, FL 33334
$-770
Cash flow
-17.1%
Cash-on-Cash Return
2.2%
Cap rate
0.9%
Rent to Value Ratio

Active
$525,500
1
bds
|
1
ba
|
820
sqft
|
built
2004
347 N New River Dr E, Fort Lauderdale, FL 33301
$-1,569
Cash flow
-15.6%
Cash-on-Cash Return
2.6%
Cap rate
0.7%
Rent to Value Ratio
Active
$1,495,003
5
bds
|
4
ba
|
3,148
sqft
|
built
1979
5790 SW 37th Ter, Fort Lauderdale, FL 33312
$-4,814
Cash flow
-16.8%
Cash-on-Cash Return
2.3%
Cap rate
0.3%
Rent to Value Ratio

Active
$350,000
2
bds
|
2
ba
|
1,400
sqft
|
built
1970
3100 NE 49th St, Fort Lauderdale, FL 33308
$-1,664
Cash flow
-24.8%
Cash-on-Cash Return
0.4%
Cap rate
0.8%
Rent to Value Ratio

Active
$640,000
2
bds
|
2
ba
|
1,200
sqft
|
built
1976
2841 N Ocean Blvd, Fort Lauderdale, FL 33308
$-2,832
Cash flow
-23.1%
Cash-on-Cash Return
0.8%
Cap rate
0.6%
Rent to Value Ratio

Active
$470,000
2
bds
|
2
ba
|
1,344
sqft
|
built
1973
1170 N Federal Hwy, Fort Lauderdale, FL 33304
$-1,810
Cash flow
-20.1%
Cash-on-Cash Return
1.5%
Cap rate
0.7%
Rent to Value Ratio

Active
$595,000
bds
|
0
ba
|
1,029
sqft
|
built
1951
341 SW 21st St, Fort Lauderdale, FL 33315
$-2,248
Cash flow
-19.7%
Cash-on-Cash Return
1.6%
Cap rate
0.4%
Rent to Value Ratio

Active
$400,000
3
bds
|
2
ba
|
1,212
sqft
|
built
1965
1021 NW 25th Way, Fort Lauderdale, FL 33311
$-690
Cash flow
-9.0%
Cash-on-Cash Return
4.1%
Cap rate
0.7%
Rent to Value Ratio

Active
$2,250,000
3
bds
|
3
ba
|
3,368
sqft
|
built
1998
3055 Harbor Dr, Fort Lauderdale, FL 33316
$-12,796
Cash flow
-29.7%
Cash-on-Cash Return
-0.7%
Cap rate
0.4%
Rent to Value Ratio
Active
$399,000
2
bds
|
3
ba
|
1,369
sqft
|
built
1986
2300 NE 33rd Ave, Fort Lauderdale, FL 33305
$-1,139
Cash flow
-14.9%
Cash-on-Cash Return
2.7%
Cap rate
0.9%
Rent to Value Ratio

Active
$350,000
2
bds
|
1
ba
|
1,300
sqft
|
built
1947
1341 SW 25th Ave, Fort Lauderdale, FL 33312
$-447
Cash flow
-6.7%
Cash-on-Cash Return
4.6%
Cap rate
0.6%
Rent to Value Ratio

Active
$449,000
2
bds
|
2
ba
|
1,083
sqft
|
built
2001
520 SE 5th Ave, Fort Lauderdale, FL 33301
$-1,845
Cash flow
-21.4%
Cash-on-Cash Return
1.2%
Cap rate
0.7%
Rent to Value Ratio

Active
$309,990
2
bds
|
1
ba
|
625
sqft
|
built
1953
1708 NW 7th Pl, Fort Lauderdale, FL 33311
$-597
Cash flow
-10.0%
Cash-on-Cash Return
3.8%
Cap rate
0.6%
Rent to Value Ratio
Active
$225,000
1
bds
|
1
ba
|
702
sqft
|
built
1987
5200 NW 31st Ave, Fort Lauderdale, FL 33309
$-428
Cash flow
-9.9%
Cash-on-Cash Return
3.9%
Cap rate
0.8%
Rent to Value Ratio