Fort Lauderdale, FL Investment Properties for Sale
Browse homes for sale and investment properties in Fort Lauderdale, FL. Refine your search by price, property type, or more.
Best cash flowing properties in Fort Lauderdale, FL
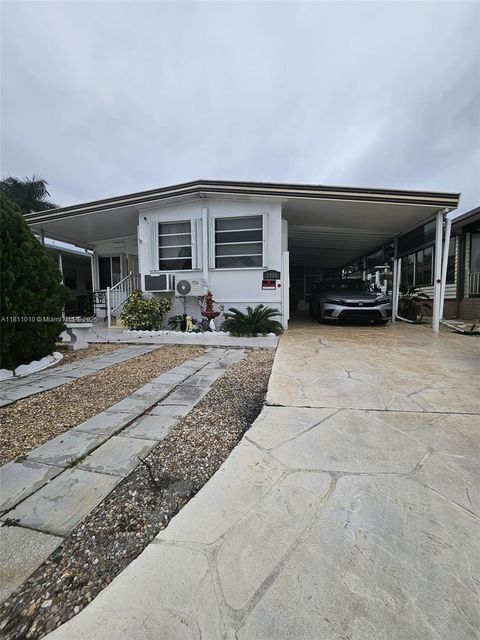
Active
$205,000
3
bds
|
3
ba
|
954
sqft
|
built
1972
2848 W Marina Dr, Fort Lauderdale, FL 33312
$327
Cash flow
8.3%
Cash-on-Cash Return
8.1%
Cap rate
1.1%
Rent to Value Ratio
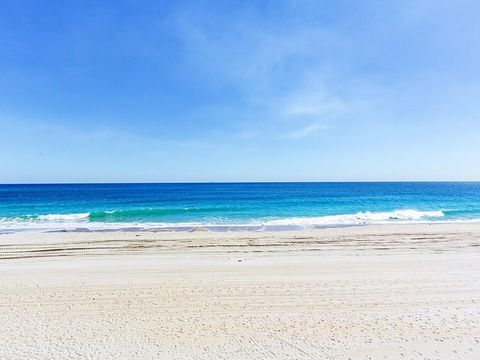
Active
$185,000
1
bds
|
1
ba
|
956
sqft
|
built
1965
2555 NE 11th St, Fort Lauderdale, FL 33304
$37
Cash flow
1.0%
Cash-on-Cash Return
6.4%
Cap rate
1.1%
Rent to Value Ratio
2,096 out of 2,470 properties for sale in Fort Lauderdale, FL
Limited Results Shown
Create a free account, or log in to reveal all property listings and enjoy the complete experience.

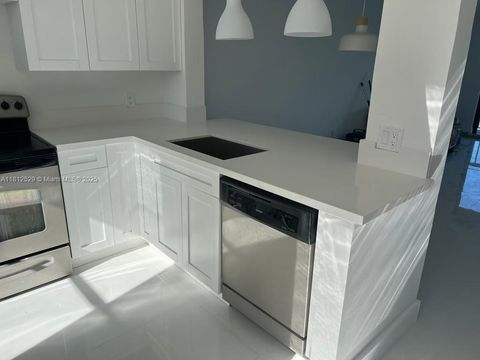
Active
$375,000
1
bds
|
1
ba
|
780
sqft
|
built
2005
100 N Federal Hwy, Fort Lauderdale, FL 33301
$-487
Cash flow
-6.8%
Cash-on-Cash Return
4.6%
Cap rate
0.7%
Rent to Value Ratio
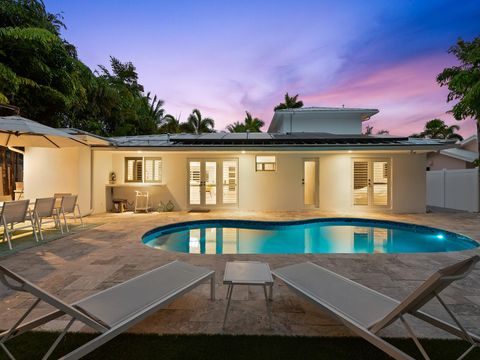
Active
$225,000
1
bds
|
1
ba
|
702
sqft
|
built
1987
5200 NW 31st Ave, Fort Lauderdale, FL 33309
$-428
Cash flow
-9.9%
Cash-on-Cash Return
3.9%
Cap rate
0.8%
Rent to Value Ratio

Active
$679,000
2
bds
|
2
ba
|
1,700
sqft
|
built
1966
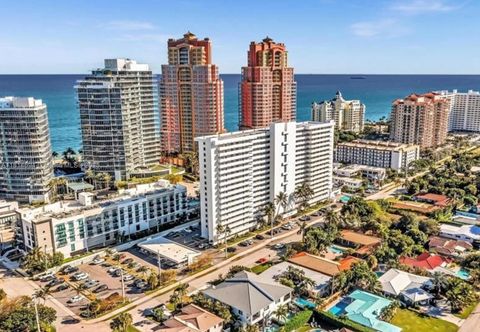
1151 N Fort Lauderdale Beach Blvd, Fort Lauderdale, FL 33304
$-3,143
Cash flow
-24.2%
Cash-on-Cash Return
0.6%
Cap rate
0.6%
Rent to Value Ratio

Active under contract
$440,000
4
bds
|
3
ba
|
1,600
sqft
|
built
1962
1731 NW 27th Ter, Fort Lauderdale, FL 33311
$-448
Cash flow
-5.3%
Cash-on-Cash Return
4.9%
Cap rate
0.7%
Rent to Value Ratio

Active
$575,000
3
bds
|
2
ba
|
1,350
sqft
|
built
1988
1580 SW 28th Ter, Fort Lauderdale, FL 33312
$-1,483
Cash flow
-13.5%
Cash-on-Cash Return
3.1%
Cap rate
0.5%
Rent to Value Ratio

Active
$485,000
3
bds
|
2
ba
|
1,348
sqft
|
built
1960
2770 NW 25th St, Fort Lauderdale, FL 33311
$-1,177
Cash flow
-12.7%
Cash-on-Cash Return
3.2%
Cap rate
0.5%
Rent to Value Ratio

Active
$439,000
3
bds
|
1
ba
|
1,122
sqft
|
built
1952
113 SW 22nd Ave, Fort Lauderdale, FL 33312
$-1,068
Cash flow
-12.7%
Cash-on-Cash Return
3.2%
Cap rate
0.5%
Rent to Value Ratio
Active
$1,450,000
4
bds
|
3
ba
|
2,349
sqft
|
built
1967
2147 NE 65th St, Fort Lauderdale, FL 33308
$-4,617
Cash flow
-16.6%
Cash-on-Cash Return
2.3%
Cap rate
0.4%
Rent to Value Ratio

Active
$999,000
2
bds
|
2
ba
|
1,214
sqft
|
built
2011
3101 Bayshore Dr, Fort Lauderdale, FL 33304
$-3,200
Cash flow
-16.7%
Cash-on-Cash Return
2.3%
Cap rate
0.8%
Rent to Value Ratio
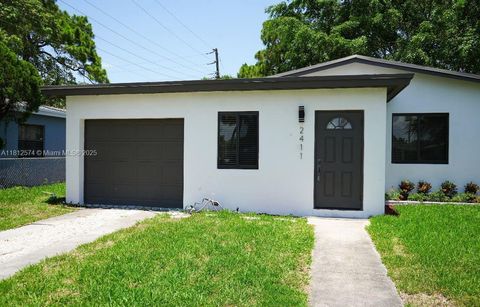
Active
$445,000
4
bds
|
2
ba
|
955
sqft
|
built
1960
2411 NW 9th St, Fort Lauderdale, FL 33311
$-939
Cash flow
-11.0%
Cash-on-Cash Return
3.6%
Cap rate
0.5%
Rent to Value Ratio
Active
$1,045,000
2
bds
|
2
ba
|
1,189
sqft
|
built
1954
2807 Coral Shores Dr, Fort Lauderdale, FL 33306
$-2,489
Cash flow
-12.4%
Cash-on-Cash Return
3.3%
Cap rate
0.6%
Rent to Value Ratio

Active under contract
$229,000
2
bds
|
2
ba
|
975
sqft
|
built
1972
1775 N Andrews Sq, Fort Lauderdale, FL 33311
$-560
Cash flow
-12.8%
Cash-on-Cash Return
3.2%
Cap rate
1.0%
Rent to Value Ratio

Pending
$365,000
3
bds
|
2
ba
|
1,104
sqft
|
built
1975
2910 NW 26th St, Fort Lauderdale, FL 33311
$-627
Cash flow
-9.0%
Cash-on-Cash Return
4.1%
Cap rate
0.7%
Rent to Value Ratio
Active
$529,900
3
bds
|
2
ba
|
1,122
sqft
|
built
1954
1530 NW 18th Ct, Fort Lauderdale, FL 33311
$-986
Cash flow
-9.7%
Cash-on-Cash Return
3.9%
Cap rate
0.6%
Rent to Value Ratio

Active
$339,900
3
bds
|
2
ba
|
1,091
sqft
|
built
1955
2316 NW 13th Ct, Fort Lauderdale, FL 33311
$-338
Cash flow
-5.2%
Cash-on-Cash Return
5.0%
Cap rate
0.7%
Rent to Value Ratio
Active
$185,000
1
bds
|
1
ba
|
956
sqft
|
built
1965
2555 NE 11th St, Fort Lauderdale, FL 33304
$37
Cash flow
1.0%
Cash-on-Cash Return
6.4%
Cap rate
1.1%
Rent to Value Ratio
Active
$1,299,000
3
bds
|
3
ba
|
2,030
sqft
|
built
1967
4300 N Ocean Blvd, Fort Lauderdale, FL 33308
$-4,275
Cash flow
-17.2%
Cash-on-Cash Return
2.2%
Cap rate
0.7%
Rent to Value Ratio

Active
$148,500
1
bds
|
2
ba
|
756
sqft
|
built
1970
2181 NE 67th St, Fort Lauderdale, FL 33308
$-287
Cash flow
-10.1%
Cash-on-Cash Return
3.8%
Cap rate
1.2%
Rent to Value Ratio
Active
$299,000
1
bds
|
2
ba
|
1,103
sqft
|
built
1971
2200 NE 33rd Ave, Fort Lauderdale, FL 33305
$-944
Cash flow
-16.5%
Cash-on-Cash Return
2.4%
Cap rate
0.8%
Rent to Value Ratio
Active
$411,000
3
bds
|
2
ba
|
1,000
sqft
|
built
1952
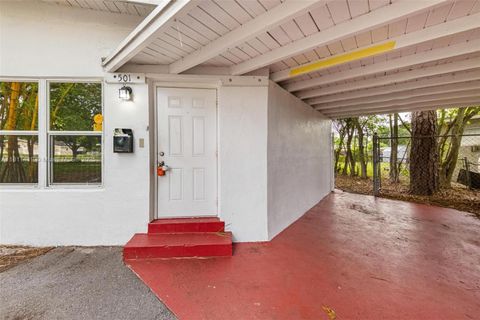
501 Carolina Ave, Fort Lauderdale, FL 33312
$-801
Cash flow
-10.2%
Cash-on-Cash Return
3.8%
Cap rate
0.7%
Rent to Value Ratio
Active
$1,995,000
4
bds
|
4
ba
|
2,878
sqft
|
built
1961
2108 NE 63rd St, Fort Lauderdale, FL 33308
$-7,222
Cash flow
-18.9%
Cash-on-Cash Return
1.8%
Cap rate
0.3%
Rent to Value Ratio
Active
$535,000
3
bds
|
2
ba
|
1,553
sqft
|
built
1956
3600 SW 2nd St, Fort Lauderdale, FL 33312
$-1,286
Cash flow
-12.5%
Cash-on-Cash Return
3.3%
Cap rate
0.5%
Rent to Value Ratio
Active
$925,000
2
bds
|
2
ba
|
1,200
sqft
|
built
1969
2200 S Ocean Ln, Fort Lauderdale, FL 33316
$-3,558
Cash flow
-20.1%
Cash-on-Cash Return
1.5%
Cap rate
0.6%
Rent to Value Ratio
Active
$1,370,000
3
bds
|
3
ba
|
2,650
sqft
|
built
1965
2000 S Ocean Dr, Fort Lauderdale, FL 33316
$-6,011
Cash flow
-22.9%
Cash-on-Cash Return
0.9%
Cap rate
0.5%
Rent to Value Ratio
Active
$968,000
5
bds
|
3
ba
|
1,341
sqft
|
built
1957
3472 SW 44th St, Fort Lauderdale, FL 33312
$-1,559
Cash flow
-8.4%
Cash-on-Cash Return
4.2%
Cap rate
0.7%
Rent to Value Ratio

Active
$265,000
2
bds
|
2
ba
|
1,280
sqft
|
built
1974
5911 NE 14th Ln, Fort Lauderdale, FL 33334
$-773
Cash flow
-15.2%
Cash-on-Cash Return
2.6%
Cap rate
0.8%
Rent to Value Ratio

Active
$6,995,000
6
bds
|
6
ba
|
5,526
sqft
|
built
2003
324 Coconut Isle Dr, Fort Lauderdale, FL 33301
$-34,488
Cash flow
-25.7%
Cash-on-Cash Return
0.2%
Cap rate
0.1%
Rent to Value Ratio
Active
$205,000
3
bds
|
3
ba
|
954
sqft
|
built
1972
2848 W Marina Dr, Fort Lauderdale, FL 33312
$327
Cash flow
8.3%
Cash-on-Cash Return
8.1%
Cap rate
1.1%
Rent to Value Ratio

Active
$639,000
3
bds
|
3
ba
|
1,342
sqft
|
built
1957
4697 SW 35th Ave, Fort Lauderdale, FL 33312
$-907
Cash flow
-7.4%
Cash-on-Cash Return
4.4%
Cap rate
0.6%
Rent to Value Ratio
Active
$185,000
2
bds
|
2
ba
|
875
sqft
|
built
1971
5720 NE 22nd Way, Fort Lauderdale, FL 33308
$-524
Cash flow
-14.8%
Cash-on-Cash Return
2.8%
Cap rate
1.1%
Rent to Value Ratio
Active
$2,000,000
5
bds
|
4
ba
|
2,985
sqft
|
built
1957
2001 SW 23rd Ave, Fort Lauderdale, FL 33312
$-7,038
Cash flow
-18.4%
Cash-on-Cash Return
1.9%
Cap rate
0.3%
Rent to Value Ratio
Active
$429,000
2
bds
|
2
ba
|
1,200
sqft
|
built
1974
6309 Bay Club Dr, Fort Lauderdale, FL 33308
$-1,701
Cash flow
-20.7%
Cash-on-Cash Return
1.4%
Cap rate
0.6%
Rent to Value Ratio

Active
$389,000
1
bds
|
1
ba
|
647
sqft
|
built
1970
200 S Birch Rd, Fort Lauderdale, FL 33316
$-1,466
Cash flow
-19.7%
Cash-on-Cash Return
1.6%
Cap rate
0.6%
Rent to Value Ratio
Active
$2,000,000
2
bds
|
3
ba
|
2,372
sqft
|
built
2022
1507 SE 15th St, Fort Lauderdale, FL 33316
$-7,597
Cash flow
-19.8%
Cash-on-Cash Return
1.6%
Cap rate
0.5%
Rent to Value Ratio

Active
$1,250,000
bds
|
0
ba
|
1,484
sqft
|
built
1939
648 NE 16th Ter, Fort Lauderdale, FL 33304
$-5,764
Cash flow
-24.1%
Cash-on-Cash Return
0.6%
Cap rate
0.2%
Rent to Value Ratio
Active
$2,390,000
4
bds
|
4
ba
|
2,882
sqft
|
built
1957
2908 Bayview Dr, Fort Lauderdale, FL 33306
$-8,152
Cash flow
-17.8%
Cash-on-Cash Return
2.1%
Cap rate
0.4%
Rent to Value Ratio
Active
$2,950,000
4
bds
|
3
ba
|
2,767
sqft
|
built
1983
635 SE 25th Ave, Fort Lauderdale, FL 33301
$-11,889
Cash flow
-21.0%
Cash-on-Cash Return
1.3%
Cap rate
0.3%
Rent to Value Ratio

Active
$465,000
3
bds
|
2
ba
|
1,459
sqft
|
built
1956
1090 SW 31st St, Fort Lauderdale, FL 33315
$-543
Cash flow
-6.1%
Cash-on-Cash Return
4.7%
Cap rate
0.7%
Rent to Value Ratio
Active
$369,999
2
bds
|
1
ba
|
720
sqft
|
built
1950
412 NW 19th Ave, Fort Lauderdale, FL 33311
$-668
Cash flow
-9.4%
Cash-on-Cash Return
4.0%
Cap rate
0.6%
Rent to Value Ratio

Active
$715,000
bds
|
0
ba
|
1,353
sqft
|
built
1942
218 SW 10th St, Fort Lauderdale, FL 33315
$-2,885
Cash flow
-21.1%
Cash-on-Cash Return
1.3%
Cap rate
0.3%
Rent to Value Ratio