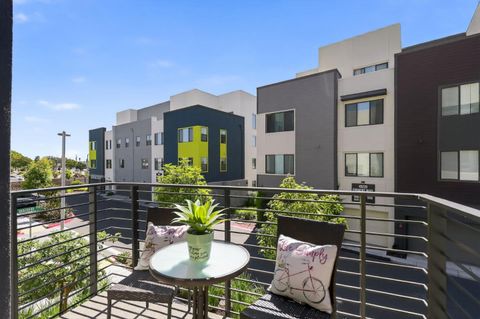
Fremont, CA Investment Properties for Sale
Browse homes for sale and investment properties in Fremont, CA. Refine your search by price, property type, or more.
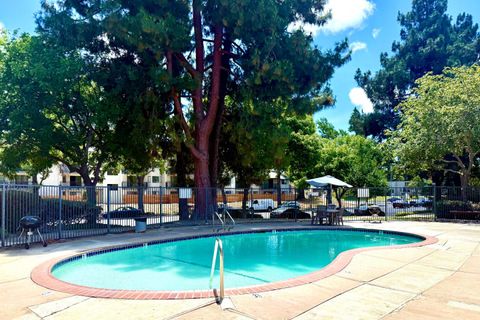
Best cash flowing properties in Fremont, CA
Active
$385,000
1
bds
|
1
ba
|
750
sqft
|
built
1970
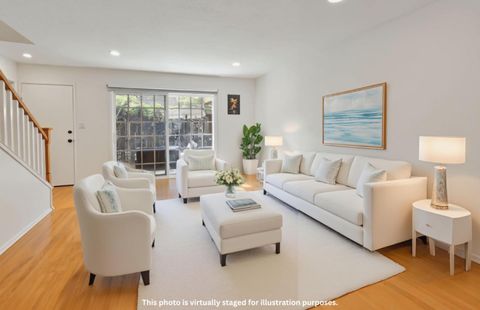
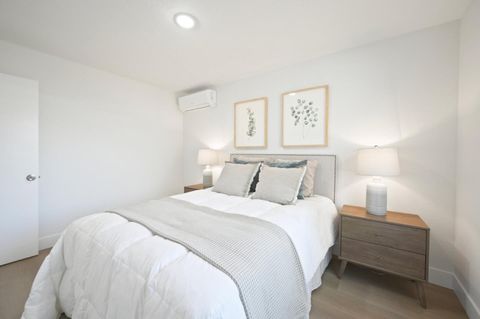
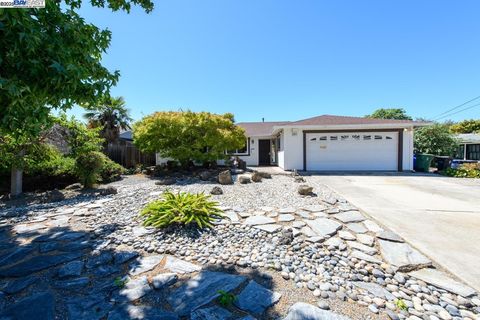
38455 Bronson St, Fremont, CA 94536
$-910
Cash flow
-12.3%
Cash-on-Cash Return
3.2%
Cap rate
0.6%
Rent to Value Ratio
Active
$480,000
2
bds
|
2
ba
|
990
sqft
|
built
1986
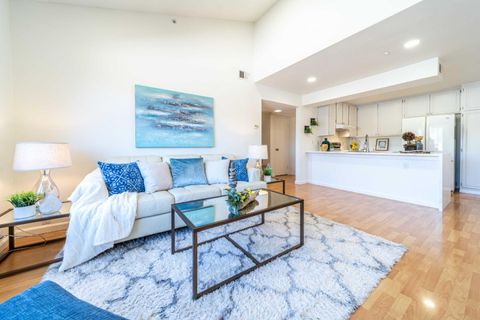
3416 Deerwood Ter, Fremont, CA 94536
$-1,402
Cash flow
-15.2%
Cash-on-Cash Return
2.6%
Cap rate
0.5%
Rent to Value Ratio
31 out of 140 properties for sale in Fremont, CA
Limited Results Shown
Create a free account, or log in to reveal all property listings and enjoy the complete experience.
Active
$1,799,000
4
bds
|
3
ba
|
2,240
sqft
|
built
1994
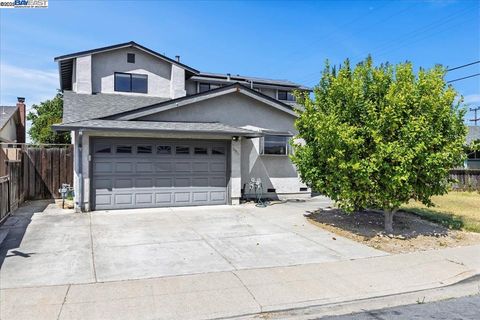
38101 Cambridge Ct, Fremont, CA 94536
$-5,578
Cash flow
-16.2%
Cash-on-Cash Return
2.3%
Cap rate
0.3%
Rent to Value Ratio
Active
$850,000
2
bds
|
2
ba
|
1,229
sqft
|
built
2009
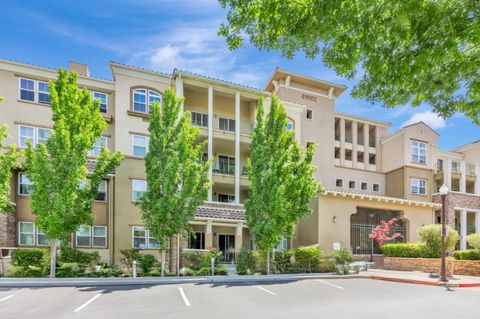
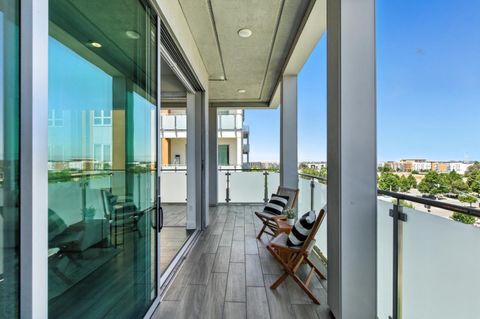
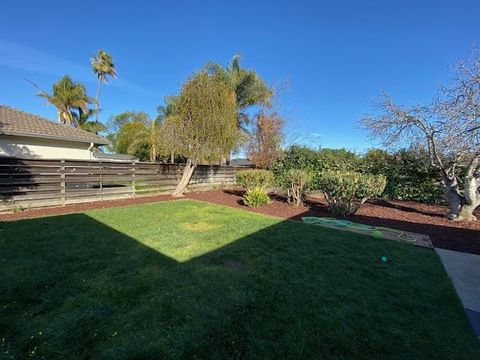
49002 Cinnamon Fern Cmn, Fremont, CA 94539
$-2,306
Cash flow
-14.2%
Cash-on-Cash Return
2.8%
Cap rate
0.4%
Rent to Value Ratio
Active
$1,049,888
3
bds
|
2
ba
|
1,242
sqft
|
built
1970
42930 Corte Habana, Fremont, CA 94539
$-3,008
Cash flow
-14.9%
Cash-on-Cash Return
2.6%
Cap rate
0.4%
Rent to Value Ratio
Active
$849,000
2
bds
|
2
ba
|
1,168
sqft
|
built
1987
874 Cherry Glen Cir, Fremont, CA 94536
$-2,393
Cash flow
-14.7%
Cash-on-Cash Return
2.7%
Cap rate
0.4%
Rent to Value Ratio
Active
$669,000
2
bds
|
2
ba
|
1,125
sqft
|
built
1984
3663 Oakwood Ter, Fremont, CA 94536
$-2,102
Cash flow
-16.4%
Cash-on-Cash Return
2.3%
Cap rate
0.4%
Rent to Value Ratio
Active
$905,000
2
bds
|
2
ba
|
1,295
sqft
|
built
2020
45128 Warm Springs Blvd, Fremont, CA 94539
$-1,736
Cash flow
-10.0%
Cash-on-Cash Return
3.8%
Cap rate
0.6%
Rent to Value Ratio

Active
$1,699,999
5
bds
|
2
ba
|
1,938
sqft
|
built
1962
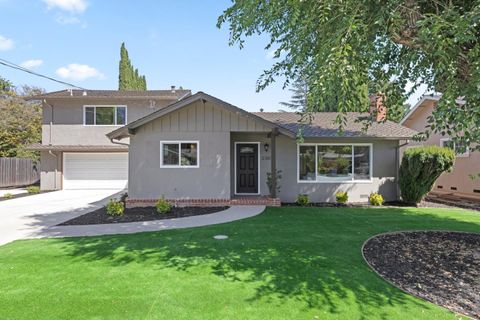
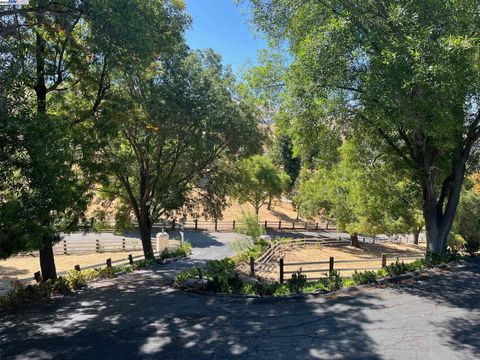
4307 Bidwell Dr, Fremont, CA 94538
$-5,491
Cash flow
-16.9%
Cash-on-Cash Return
2.2%
Cap rate
0.3%
Rent to Value Ratio
Active
$950,000
3
bds
|
2
ba
|
1,242
sqft
|
built
1971
42955 Corte Verde, Fremont, CA 94539
$-2,641
Cash flow
-14.5%
Cash-on-Cash Return
2.7%
Cap rate
0.4%
Rent to Value Ratio
Active
$2,390,000
5
bds
|
5
ba
|
2,234
sqft
|
built
1957
230 D St, Fremont, CA 94536
$-9,325
Cash flow
-20.4%
Cash-on-Cash Return
1.4%
Cap rate
0.2%
Rent to Value Ratio
Active
$1,269,000
3
bds
|
2
ba
|
1,748
sqft
|
built
2019
45128 Warm Springs Blvd, Fremont, CA 94539
$-4,288
Cash flow
-17.6%
Cash-on-Cash Return
2.0%
Cap rate
0.3%
Rent to Value Ratio
Active
$770,000
3
bds
|
2
ba
|
1,204
sqft
|
built
1984
281 Hackamore Cmn, Fremont, CA 94539
$-1,974
Cash flow
-13.4%
Cash-on-Cash Return
3.0%
Cap rate
0.5%
Rent to Value Ratio
Active
$1,498,000
4
bds
|
3
ba
|
1,624
sqft
|
built
1958
42758 Charleston Way, Fremont, CA 94538
$-4,815
Cash flow
-16.8%
Cash-on-Cash Return
2.2%
Cap rate
0.3%
Rent to Value Ratio
Active
$3,100,000
4
bds
|
3
ba
|
3,221
sqft
|
built
1971
41660 Vargas Rd, Fremont, CA 94539
$-10,293
Cash flow
-17.3%
Cash-on-Cash Return
2.1%
Cap rate
0.3%
Rent to Value Ratio
Active
$1,450,000
3
bds
|
2
ba
|
1,198
sqft
|
built
1953
38324 Blacow Rd, Fremont, CA 94536
$-4,608
Cash flow
-16.6%
Cash-on-Cash Return
2.3%
Cap rate
0.3%
Rent to Value Ratio
Active
$1,449,000
5
bds
|
3
ba
|
2,211
sqft
|
built
1962
5533 Fiesta Rd, Fremont, CA 94538
$-3,877
Cash flow
-14.0%
Cash-on-Cash Return
2.9%
Cap rate
0.3%
Rent to Value Ratio
Active
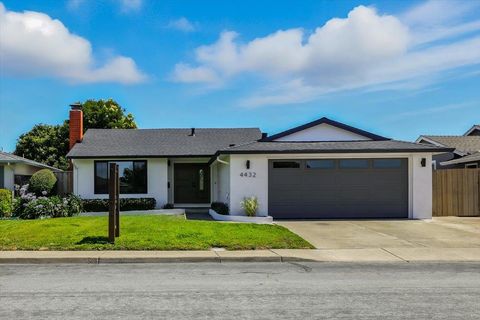
$1,688,000
3
bds
|
2
ba
|
1,256
sqft
|
built
1967
4432 Dali St, Fremont, CA 94536
$-5,775
Cash flow
-17.8%
Cash-on-Cash Return
2.0%
Cap rate
0.2%
Rent to Value Ratio
Active
$1,148,000
2
bds
|
3
ba
|
1,326
sqft
|
built
2017
3858 Development Ter, Fremont, CA 94538
$-2,823
Cash flow
-12.8%
Cash-on-Cash Return
3.1%
Cap rate
0.4%
Rent to Value Ratio

Active
$1,399,800
3
bds
|
3
ba
|
2,169
sqft
|
built
2021
45139 Challenge Cmn, Fremont, CA 94538
$-3,973
Cash flow
-14.8%
Cash-on-Cash Return
2.7%
Cap rate
0.3%
Rent to Value Ratio

Active
$1,024,000
4
bds
|
1
ba
|
1,177
sqft
|
built
1952
37114 Dondero Way, Fremont, CA 94536
$-2,487
Cash flow
-12.7%
Cash-on-Cash Return
3.2%
Cap rate
0.4%
Rent to Value Ratio
Active
$650,000
2
bds
|
2
ba
|
874
sqft
|
built
2022
42111 Osgood Rd, Fremont, CA 94539
$-1,642
Cash flow
-13.2%
Cash-on-Cash Return
3.0%
Cap rate
0.5%
Rent to Value Ratio
Active
$935,000
4
bds
|
3
ba
|
1,474
sqft
|
built
1970
34512 Nantucket Cmn, Fremont, CA 94555
$-2,412
Cash flow
-13.5%
Cash-on-Cash Return
3.0%
Cap rate
0.4%
Rent to Value Ratio
Active
$1,595,000
3
bds
|
2
ba
|
1,813
sqft
|
built
1977
38071 3rd St, Fremont, CA 94536
$-5,029
Cash flow
-16.5%
Cash-on-Cash Return
2.3%
Cap rate
0.3%
Rent to Value Ratio
Active
$1,458,000
4
bds
|
3
ba
|
1,281
sqft
|
built
1976
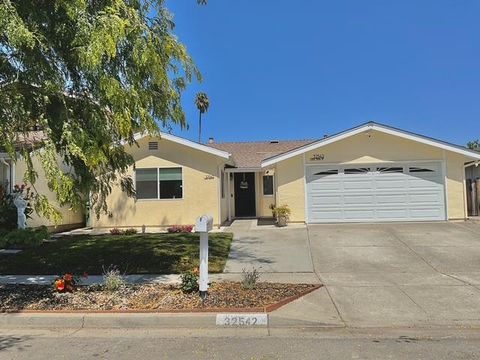
32542 Lake Tana St, Fremont, CA 94555
$-4,888
Cash flow
-17.5%
Cash-on-Cash Return
2.0%
Cap rate
0.2%
Rent to Value Ratio
Active
$1,119,000
3
bds
|
2
ba
|
1,524
sqft
|
built
2019
45128 Warm Springs Blvd, Fremont, CA 94539
$-2,563
Cash flow
-12.0%
Cash-on-Cash Return
3.3%
Cap rate
0.5%
Rent to Value Ratio
Active
$1,349,888
4
bds
|
4
ba
|
1,801
sqft
|
built
2020
39193 State St, Fremont, CA 94538
$-4,146
Cash flow
-16.0%
Cash-on-Cash Return
2.4%
Cap rate
0.3%
Rent to Value Ratio
Active
$1,160,000
2
bds
|
3
ba
|
1,326
sqft
|
built
2022
3891 Vanguard Cmn, Fremont, CA 94538
$-3,496
Cash flow
-15.7%
Cash-on-Cash Return
2.5%
Cap rate
0.3%
Rent to Value Ratio
Active
$775,000
1
bds
|
1
ba
|
870
sqft
|
built
2024
3698 Vision Cmn, Fremont, CA 94538
$-2,846
Cash flow
-19.2%
Cash-on-Cash Return
1.7%
Cap rate
0.3%
Rent to Value Ratio
Active
$1,622,222
4
bds
|
3
ba
|
1,811
sqft
|
built
1992
4438 Calypso Ter, Fremont, CA 94555
$-5,184
Cash flow
-16.7%
Cash-on-Cash Return
2.2%
Cap rate
0.3%
Rent to Value Ratio
Active
$1,198,888
3
bds
|
4
ba
|
1,712
sqft
|
built
2013
2973 Pescadero Ter, Fremont, CA 94538
$-3,158
Cash flow
-13.7%
Cash-on-Cash Return
2.9%
Cap rate
0.4%
Rent to Value Ratio