Fulton County Investment Properties for Sale
Browse homes for sale and investment properties in Fulton County. Refine your search by price, property type, or more.
Best cash flowing properties in Fulton County
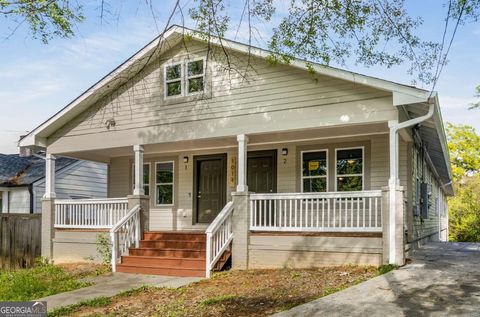
Active
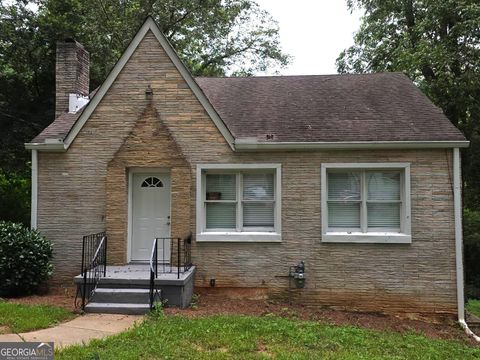
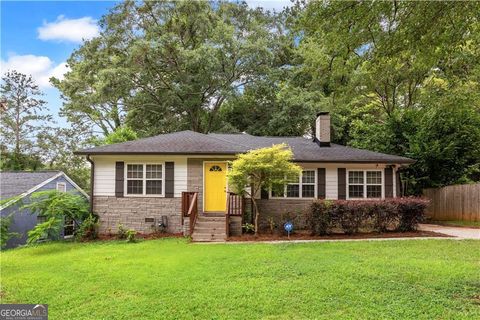
$114,900
2
bds
|
1
ba
|
0
sqft
|
built
1955
1044 Moreland Dr SE, Atlanta, GA 30315
$608
Cash flow
27.6%
Cash-on-Cash Return
12.5%
Cap rate
1.9%
Rent to Value Ratio
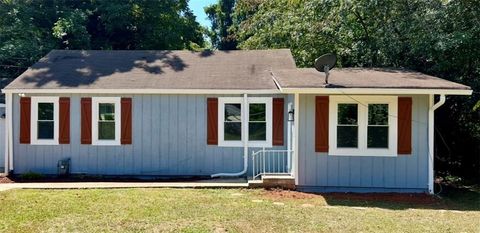
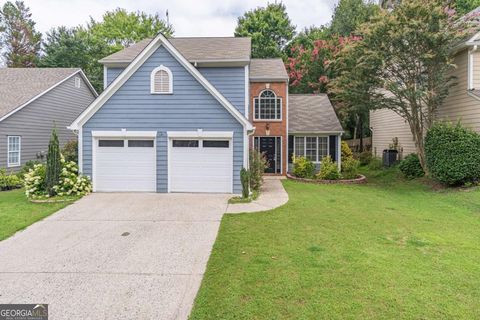
Active
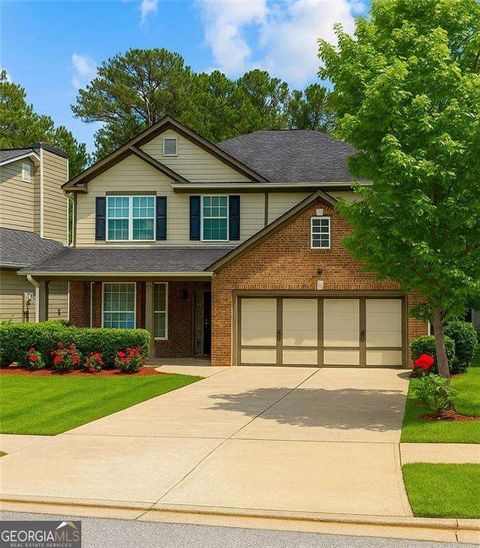
$124,900
4
bds
|
2.5
ba
|
1,150
sqft
|
built
1972
6470 Cedar Hurst Trl, Atlanta, GA 30349
$202
Cash flow
8.4%
Cash-on-Cash Return
8.1%
Cap rate
1.3%
Rent to Value Ratio
3,311 out of 4,001 properties for sale in Fulton County
Limited Results Shown
Create a free account, or log in to reveal all property listings and enjoy the complete experience.
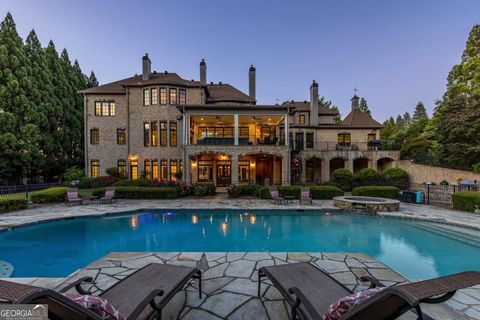
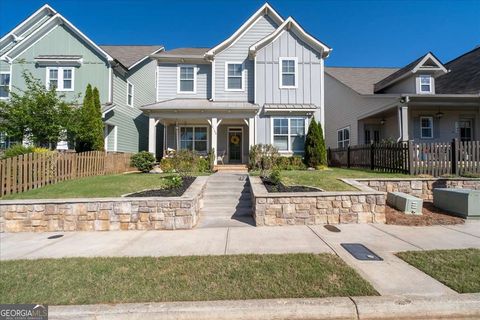
Active
$260,000
1
bds
|
1
ba
|
0
sqft
|
built
2007
400 W Peachtree St NW, Atlanta, GA 30308
$-545
Cash flow
-10.9%
Cash-on-Cash Return
3.6%
Cap rate
0.8%
Rent to Value Ratio
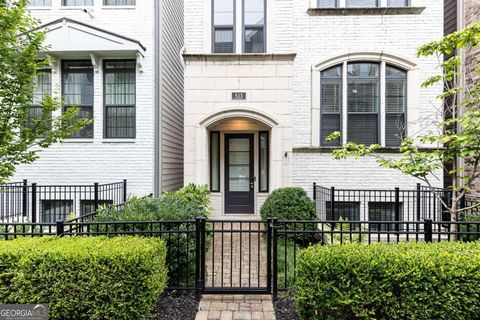
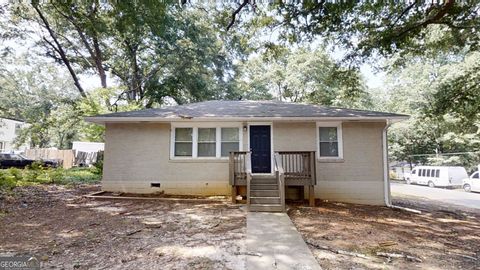
Active
$213,000
1
bds
|
1
ba
|
840
sqft
|
built
1988
970 Sidney Marcus Blvd NE, Atlanta, GA 30324
$-407
Cash flow
-10.0%
Cash-on-Cash Return
3.9%
Cap rate
0.8%
Rent to Value Ratio
Active
$449,000
8
bds
|
0
ba
|
0
sqft
|
built
2004
1014 Oakland Dr SW, Atlanta, GA 30310
$-1,459
Cash flow
-17.0%
Cash-on-Cash Return
2.2%
Cap rate
0.5%
Rent to Value Ratio
Active
$290,000
4
bds
|
2
ba
|
0
sqft
|
built
1945
1766 Venetian Dr SW, Atlanta, GA 30311
$-136
Cash flow
-2.4%
Cash-on-Cash Return
5.6%
Cap rate
0.9%
Rent to Value Ratio
Active
$4,000,000
6
bds
|
9.5
ba
|
10,977
sqft
|
built
2005
170 Autry Trl, Alpharetta, GA 30022
$-18,356
Cash flow
-23.9%
Cash-on-Cash Return
0.6%
Cap rate
0.1%
Rent to Value Ratio
Active
$719,000
4
bds
|
4.5
ba
|
0
sqft
|
built
2017
513 Broadview Ln NE, Atlanta, GA 30324
$-1,670
Cash flow
-12.1%
Cash-on-Cash Return
3.4%
Cap rate
0.6%
Rent to Value Ratio
Active
$959,000
4
bds
|
3
ba
|
0
sqft
|
built
1950
3781 Narmore Dr NE, Atlanta, GA 30319
$-2,363
Cash flow
-12.9%
Cash-on-Cash Return
3.2%
Cap rate
0.5%
Rent to Value Ratio
Active
$479,000
2
bds
|
2
ba
|
0
sqft
|
built
2021
900 Brees Ct, Atlanta, GA 30318
$-1,308
Cash flow
-14.2%
Cash-on-Cash Return
2.9%
Cap rate
0.6%
Rent to Value Ratio
Active
$1,065,000
4
bds
|
3
ba
|
0
sqft
|
built
1958
1356 Peachtree Battle Ave NW, Atlanta, GA 30327
$-3,605
Cash flow
-17.7%
Cash-on-Cash Return
2.1%
Cap rate
0.4%
Rent to Value Ratio
Active
$525,000
3
bds
|
2
ba
|
1,703
sqft
|
built
1930
1660 S Gordon St SW, Atlanta, GA 30310
$-1,684
Cash flow
-16.7%
Cash-on-Cash Return
2.3%
Cap rate
0.5%
Rent to Value Ratio
Active
$515,000
3
bds
|
3
ba
|
0
sqft
|
built
2000
160 Neel Reid Dr, Roswell, GA 30075
$-1,326
Cash flow
-13.4%
Cash-on-Cash Return
3.1%
Cap rate
0.5%
Rent to Value Ratio
Active
$599,900
4
bds
|
2.5
ba
|
2,310
sqft
|
built
1976
11625 Northgate Way, Roswell, GA 30075
$-713
Cash flow
-6.2%
Cash-on-Cash Return
4.7%
Cap rate
0.6%
Rent to Value Ratio
Active
$235,000
2
bds
|
1
ba
|
950
sqft
|
built
1981
6816 Glenridge Dr, Sandy Springs, GA 30328
$-22,570
Cash flow
-501.1%
Cash-on-Cash Return
-109.1%
Cap rate
0.7%
Rent to Value Ratio
Active
$299,000
3
bds
|
2
ba
|
1,367
sqft
|
built
1930
1920 Main St NW, Atlanta, GA 30318
$-231
Cash flow
-4.0%
Cash-on-Cash Return
5.2%
Cap rate
0.9%
Rent to Value Ratio

Active
$154,900
3
bds
|
2
ba
|
0
sqft
|
built
1969
4595 Sahara Dr SW, Atlanta, GA 30331
$100
Cash flow
3.4%
Cash-on-Cash Return
6.9%
Cap rate
1.0%
Rent to Value Ratio
Active
$275,000
4
bds
|
2
ba
|
1,900
sqft
|
built
1946
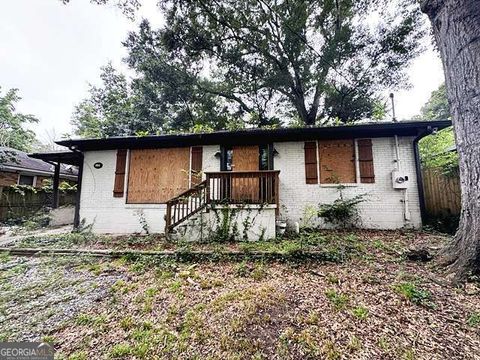
2168 Rhinehill Rd SE, Atlanta, GA 30315
$-177
Cash flow
-3.4%
Cash-on-Cash Return
5.4%
Cap rate
0.7%
Rent to Value Ratio
Active
$510,000
3
bds
|
2.5
ba
|
0
sqft
|
built
1995
1035 Arborhill Ln, Alpharetta, GA 30004
$-1,109
Cash flow
-11.3%
Cash-on-Cash Return
3.5%
Cap rate
0.5%
Rent to Value Ratio
Active
$625,000
4
bds
|
3.5
ba
|
2,820
sqft
|
built
2016
2100 Drew Dr NW, Atlanta, GA 30318
$-1,540
Cash flow
-12.9%
Cash-on-Cash Return
3.2%
Cap rate
0.5%
Rent to Value Ratio
Active
$197,500
3
bds
|
1
ba
|
1,080
sqft
|
built
1954
568 Mc Williams Rd SE, Atlanta, GA 30315
$-90
Cash flow
-2.4%
Cash-on-Cash Return
5.6%
Cap rate
0.9%
Rent to Value Ratio
Active
$599,000
3
bds
|
2
ba
|
2,864
sqft
|
built
1950
15756 Hopewell Rd, Alpharetta, GA 30004
$-1,629
Cash flow
-14.2%
Cash-on-Cash Return
2.9%
Cap rate
0.5%
Rent to Value Ratio
Active
$299,900
2
bds
|
1
ba
|
1,279
sqft
|
built
1940
2431 Sylvan Rd, East Point, GA 30344
$-285
Cash flow
-5.0%
Cash-on-Cash Return
5.0%
Cap rate
0.7%
Rent to Value Ratio
Active
$239,000
2
bds
|
1.5
ba
|
912
sqft
|
built
1985
244 13th St NE, Atlanta, GA 30309
$-34,658
Cash flow
-756.6%
Cash-on-Cash Return
-167.9%
Cap rate
0.9%
Rent to Value Ratio
Active
$279,900
4
bds
|
2.5
ba
|
2,076
sqft
|
built
2006
5951 Westchase St, Atlanta, GA 30336
$-491
Cash flow
-9.2%
Cash-on-Cash Return
4.0%
Cap rate
0.8%
Rent to Value Ratio
Active
$249,900
4
bds
|
2
ba
|
1,885
sqft
|
built
1965
563 Center Hill Ave NW, Atlanta, GA 30318
$-211
Cash flow
-4.4%
Cash-on-Cash Return
5.1%
Cap rate
0.9%
Rent to Value Ratio
Active
$625,000
2
bds
|
2
ba
|
0
sqft
|
built
2008
1080 Peachtree St NE, Atlanta, GA 30309
$-2,060
Cash flow
-17.2%
Cash-on-Cash Return
2.2%
Cap rate
0.6%
Rent to Value Ratio
Active
$230,000
3
bds
|
2
ba
|
0
sqft
|
built
1920
304 Sunset Ave NW, Atlanta, GA 30314
$138
Cash flow
3.1%
Cash-on-Cash Return
6.9%
Cap rate
1.1%
Rent to Value Ratio
Active
$295,900
2
bds
|
2
ba
|
1,598
sqft
|
built
1972
7800 Peters Rd, Fairburn, GA 30213
$-453
Cash flow
-8.0%
Cash-on-Cash Return
4.3%
Cap rate
0.6%
Rent to Value Ratio
Active
$170,000
3
bds
|
3
ba
|
0
sqft
|
built
1972
5430 Old Bill Cook Rd, College Park, GA 30349
$82
Cash flow
2.5%
Cash-on-Cash Return
6.7%
Cap rate
1.0%
Rent to Value Ratio
Active
$615,000
4
bds
|
2.5
ba
|
2,948
sqft
|
built
1986
730 Redlion Run, Alpharetta, GA 30022
$-1,188
Cash flow
-10.1%
Cash-on-Cash Return
3.8%
Cap rate
0.6%
Rent to Value Ratio
Active
$1,349,000
6
bds
|
5
ba
|
0
sqft
|
built
2015
631 Mabry Rd, Sandy Springs, GA 30328
$-3,873
Cash flow
-15.0%
Cash-on-Cash Return
2.7%
Cap rate
0.5%
Rent to Value Ratio
Active
$219,999
2
bds
|
1
ba
|
0
sqft
|
built
1955
8230 Rataree Rd SW, Atlanta, GA 30331
$-198
Cash flow
-4.7%
Cash-on-Cash Return
5.1%
Cap rate
0.7%
Rent to Value Ratio
Active
$245,000
4
bds
|
2.5
ba
|
1,700
sqft
|
built
2006
2164 Crossrail Dr, College Park, GA 30349
$-511
Cash flow
-10.9%
Cash-on-Cash Return
3.6%
Cap rate
0.7%
Rent to Value Ratio
Active
$449,900
2
bds
|
2
ba
|
1,196
sqft
|
built
2006
950 W Peachtree St NW, Atlanta, GA 30309
$-1,036
Cash flow
-12.0%
Cash-on-Cash Return
3.4%
Cap rate
0.7%
Rent to Value Ratio
Active
$2,600,000
5
bds
|
5
ba
|
6,929
sqft
|
built
1925
57 Northwood Ave NE, Atlanta, GA 30309
$-9,511
Cash flow
-19.1%
Cash-on-Cash Return
1.8%
Cap rate
0.4%
Rent to Value Ratio
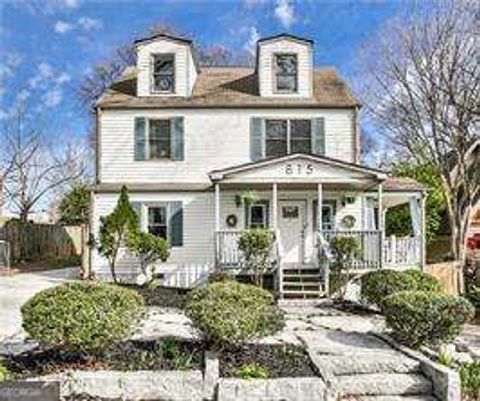
Active
$775,000
4
bds
|
2
ba
|
0
sqft
|
built
1945
815 Verner St NW, Atlanta, GA 30318
$-3,136
Cash flow
-21.1%
Cash-on-Cash Return
1.3%
Cap rate
0.3%
Rent to Value Ratio
Active
$150,000
3
bds
|
2.5
ba
|
1,300
sqft
|
built
1972
4701 Flat Shoals Rd, Union City, GA 30291
$-87
Cash flow
-3.0%
Cash-on-Cash Return
5.4%
Cap rate
1.1%
Rent to Value Ratio
Active
$249,900
3
bds
|
2
ba
|
977
sqft
|
built
1920
1559 Alma St SW, Atlanta, GA 30311
$-149
Cash flow
-3.1%
Cash-on-Cash Return
5.4%
Cap rate
0.7%
Rent to Value Ratio
Active
$325,900
5
bds
|
3
ba
|
2,562
sqft
|
built
2019
5759 Graywind Trl, Atlanta, GA 30349
$-435
Cash flow
-7.0%
Cash-on-Cash Return
4.5%
Cap rate
0.8%
Rent to Value Ratio