Fulton County Investment Properties for Sale
Browse homes for sale and investment properties in Fulton County. Refine your search by price, property type, or more.
Best cash flowing properties in Fulton County
Active
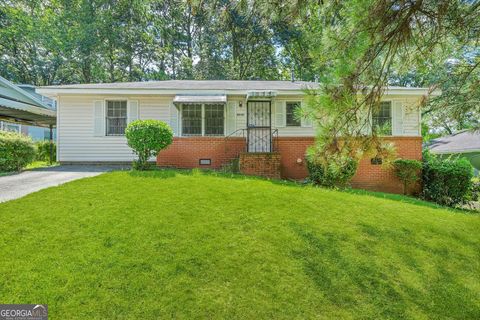
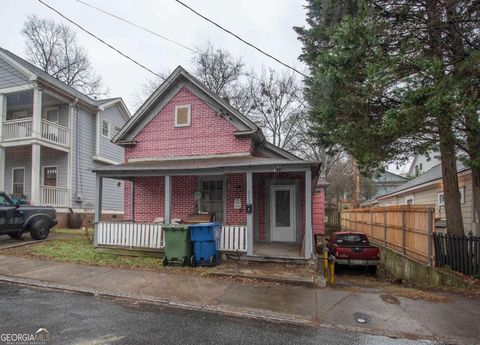
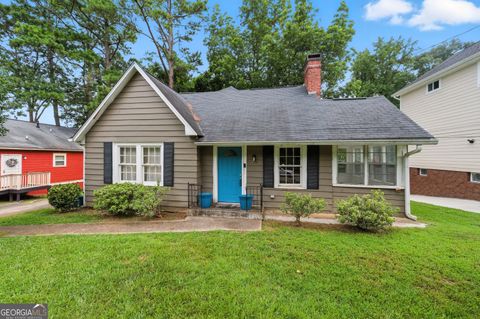
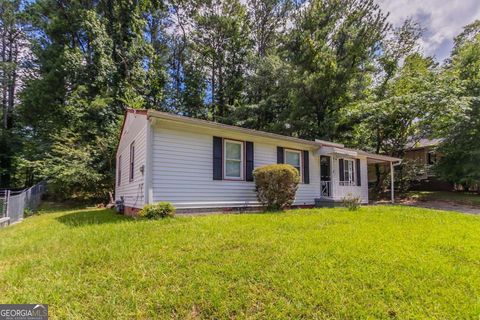
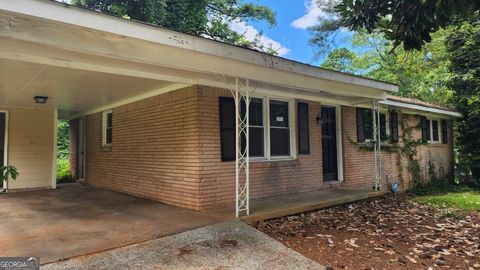
$175,000
3
bds
|
1.5
ba
|
1,164
sqft
|
built
1959
2752 Marco Dr NW, Atlanta, GA 30318
$607
Cash flow
18.1%
Cash-on-Cash Return
10.3%
Cap rate
1.3%
Rent to Value Ratio
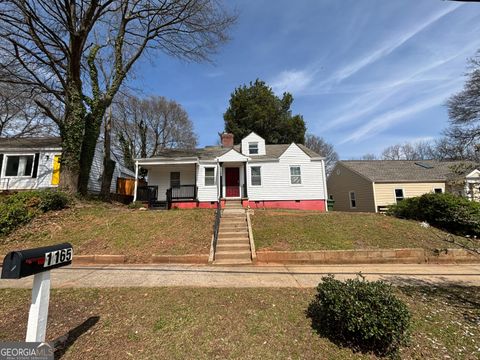
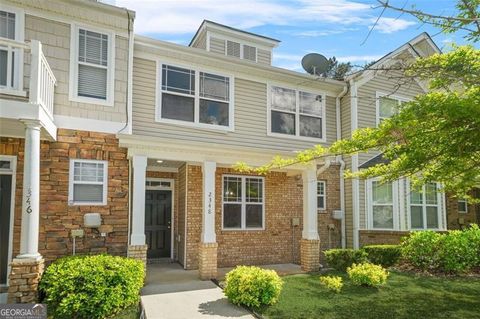
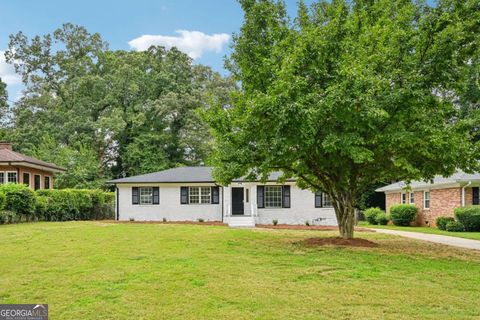
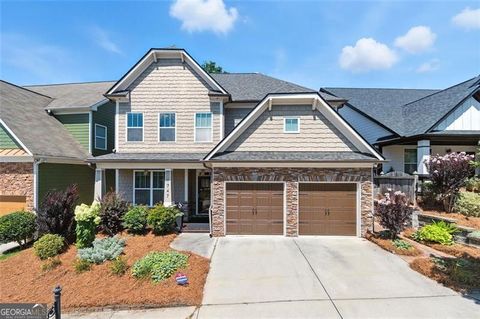
Active
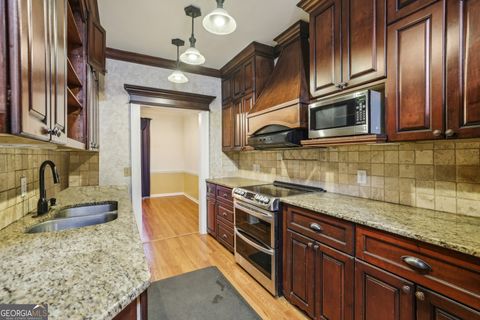
$174,990
3
bds
|
1
ba
|
1,639
sqft
|
built
1942
1165 Fair St SW, Atlanta, GA 30314
$555
Cash flow
16.5%
Cash-on-Cash Return
10.0%
Cap rate
1.3%
Rent to Value Ratio
3,388 out of 4,094 properties for sale in Fulton County
Limited Results Shown
Create a free account, or log in to reveal all property listings and enjoy the complete experience.
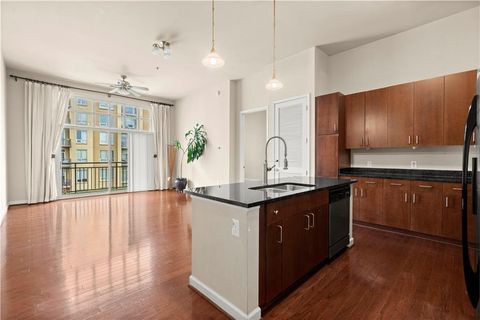
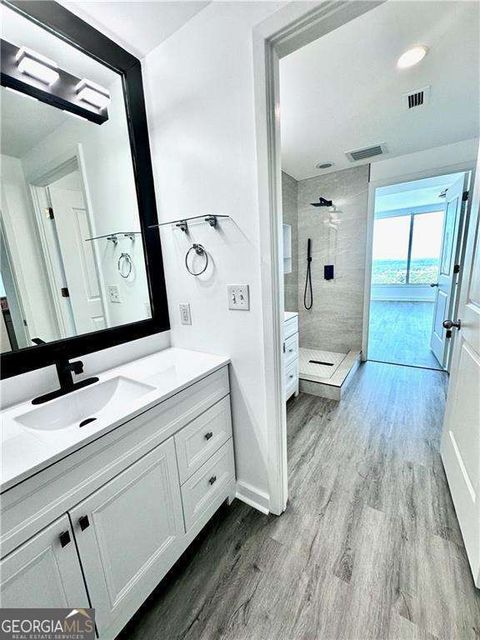
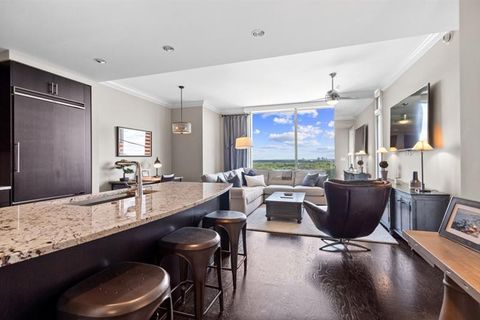
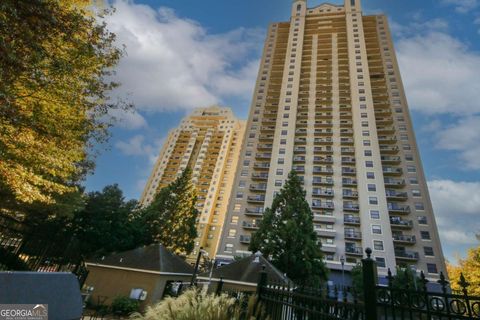
Active
$298,000
2
bds
|
2
ba
|
0
sqft
|
built
2006
711 Cosmopolitan Dr NE, Atlanta, GA 30324
$-840
Cash flow
-14.7%
Cash-on-Cash Return
2.8%
Cap rate
0.8%
Rent to Value Ratio
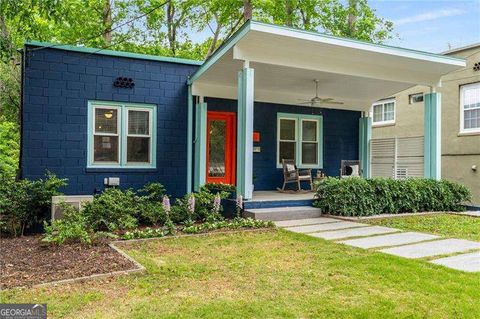
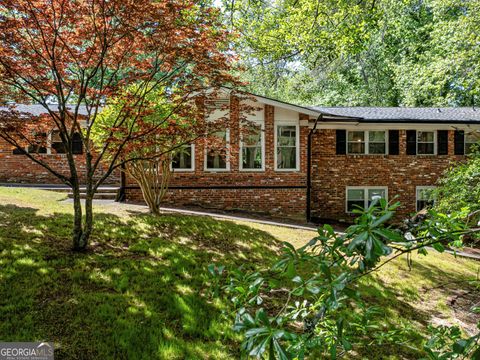
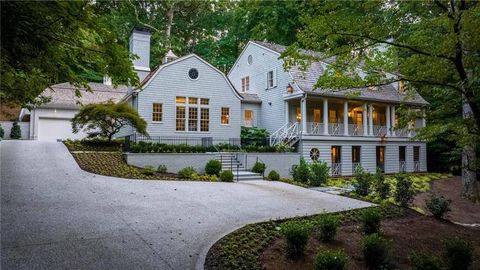
Active
$650,000
2
bds
|
2
ba
|
0
sqft
|
built
1950
830 Belgrade Ave NE, Atlanta, GA 30306
$-1,874
Cash flow
-15.0%
Cash-on-Cash Return
2.7%
Cap rate
0.5%
Rent to Value Ratio
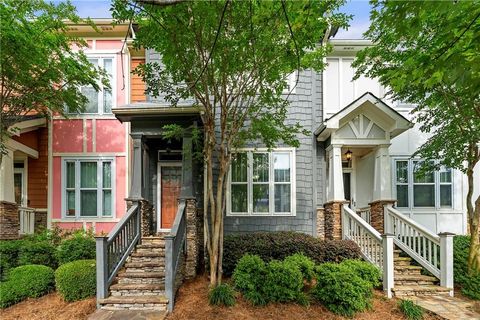
Active
$350,000
3
bds
|
1
ba
|
1,284
sqft
|
built
1920
613 Mc Donald St SE, Atlanta, GA 30312
$-568
Cash flow
-8.5%
Cash-on-Cash Return
4.2%
Cap rate
0.6%
Rent to Value Ratio
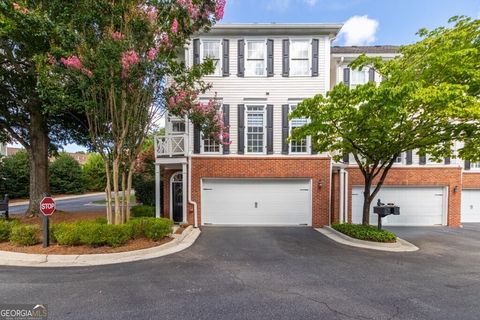
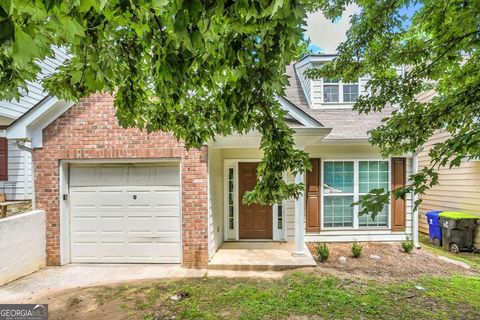
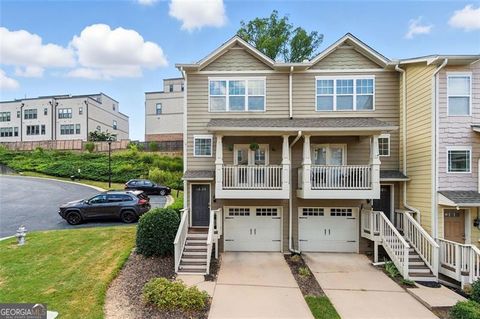
Active
$209,000
3
bds
|
2.5
ba
|
1,856
sqft
|
built
2007
2348 Bigwood Trl, Atlanta, GA 30349
$-155
Cash flow
-3.9%
Cash-on-Cash Return
5.3%
Cap rate
0.9%
Rent to Value Ratio
Active
$499,000
2
bds
|
2
ba
|
0
sqft
|
built
2004
3338 Peachtree Rd NE, Atlanta, GA 30326
$-1,832
Cash flow
-19.2%
Cash-on-Cash Return
1.7%
Cap rate
0.6%
Rent to Value Ratio
Active
$615,000
5
bds
|
3
ba
|
3,676
sqft
|
built
1960
579 Fielding Ln SW, Atlanta, GA 30311
$-1,071
Cash flow
-9.1%
Cash-on-Cash Return
4.1%
Cap rate
0.6%
Rent to Value Ratio
Active
$614,900
1
bds
|
2
ba
|
995
sqft
|
built
2010
3630 Peachtree Rd NE, Atlanta, GA 30326
$-3,142
Cash flow
-26.7%
Cash-on-Cash Return
0.0%
Cap rate
0.5%
Rent to Value Ratio
Active
$408,000
4
bds
|
2
ba
|
2,208
sqft
|
built
1948
1821 Avon Ave SW, Atlanta, GA 30311
$-730
Cash flow
-9.3%
Cash-on-Cash Return
4.0%
Cap rate
0.6%
Rent to Value Ratio
Active
$275,000
1
bds
|
1
ba
|
0
sqft
|
built
1996
955 Juniper St NE, Atlanta, GA 30309
$-640
Cash flow
-12.1%
Cash-on-Cash Return
3.4%
Cap rate
0.7%
Rent to Value Ratio
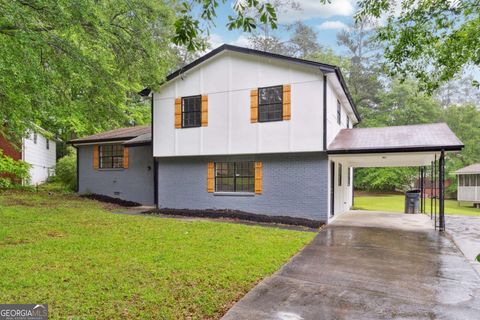
Active
$324,999
3
bds
|
2
ba
|
1,580
sqft
|
built
1955
1343 Downs Dr SW, Atlanta, GA 30311
$-464
Cash flow
-7.4%
Cash-on-Cash Return
4.4%
Cap rate
0.7%
Rent to Value Ratio
Active
$999,000
4
bds
|
3
ba
|
0
sqft
|
built
1920
1448 N Highland Ave NE, Atlanta, GA 30306
$-1,852
Cash flow
-9.7%
Cash-on-Cash Return
3.9%
Cap rate
0.6%
Rent to Value Ratio
Active
$950,000
6
bds
|
5
ba
|
5,398
sqft
|
built
1997
385 Guildhall Grv, Johns Creek, GA 30022
$-2,315
Cash flow
-12.7%
Cash-on-Cash Return
3.2%
Cap rate
0.5%
Rent to Value Ratio
Active
$719,000
4
bds
|
3
ba
|
2,331
sqft
|
built
1998
230 Bluff Oak Dr, Roswell, GA 30076
$-1,775
Cash flow
-12.9%
Cash-on-Cash Return
3.2%
Cap rate
0.5%
Rent to Value Ratio
Active
$475,000
3
bds
|
2
ba
|
0
sqft
|
built
1920
1812 Defoor Ave NW, Atlanta, GA 30318
$-1,019
Cash flow
-11.2%
Cash-on-Cash Return
3.6%
Cap rate
0.5%
Rent to Value Ratio
Active
$315,000
4
bds
|
2.5
ba
|
0
sqft
|
built
2015
5152 Rapahoe Trl, Atlanta, GA 30349
$-128
Cash flow
-2.1%
Cash-on-Cash Return
5.7%
Cap rate
0.7%
Rent to Value Ratio
Active
$3,800,000
8
bds
|
11
ba
|
11,940
sqft
|
built
2015
13980 Haystack Ln, Alpharetta, GA 30004
$-16,695
Cash flow
-22.9%
Cash-on-Cash Return
0.9%
Cap rate
0.2%
Rent to Value Ratio
Active
$200,000
1
bds
|
1
ba
|
0
sqft
|
built
1940
350 Peters St SW, Atlanta, GA 30313
$-232
Cash flow
-6.1%
Cash-on-Cash Return
4.8%
Cap rate
1.0%
Rent to Value Ratio
Active
$210,000
1
bds
|
1
ba
|
0
sqft
|
built
1991
2310 River Green Dr NW, Atlanta, GA 30327
$-353
Cash flow
-8.8%
Cash-on-Cash Return
4.1%
Cap rate
0.9%
Rent to Value Ratio
Active
$214,900
1
bds
|
1
ba
|
746
sqft
|
built
2004
799 Hammond Dr, Sandy Springs, GA 30328
$-393
Cash flow
-9.5%
Cash-on-Cash Return
4.0%
Cap rate
0.8%
Rent to Value Ratio
Active
$7,250,000
7
bds
|
8
ba
|
0
sqft
|
built
1968
3990 Paces Ferry Rd NW, Atlanta, GA 30327
$-33,441
Cash flow
-24.1%
Cash-on-Cash Return
0.6%
Cap rate
0.1%
Rent to Value Ratio
Active
$535,000
3
bds
|
2.5
ba
|
1,896
sqft
|
built
2000
310 Neel Reid Dr, Roswell, GA 30075
$-1,312
Cash flow
-12.8%
Cash-on-Cash Return
3.2%
Cap rate
0.6%
Rent to Value Ratio
Active
$307,000
2
bds
|
3
ba
|
2,080
sqft
|
built
2007
3642 Princeton Ave, Atlanta, GA 30337
$-428
Cash flow
-7.3%
Cash-on-Cash Return
4.5%
Cap rate
0.8%
Rent to Value Ratio
Active
$709,000
4
bds
|
3
ba
|
2,718
sqft
|
built
1950
151 Rockmart Dr SW, Atlanta, GA 30314
$-2,358
Cash flow
-17.4%
Cash-on-Cash Return
2.2%
Cap rate
0.3%
Rent to Value Ratio
Active
$219,900
3
bds
|
2.5
ba
|
1,620
sqft
|
built
2021
310 Ashigan St, Union City, GA 30291
$-306
Cash flow
-7.3%
Cash-on-Cash Return
4.5%
Cap rate
0.8%
Rent to Value Ratio
Active
$1,600,000
6
bds
|
6.5
ba
|
4,782
sqft
|
built
1988
300 High Bridge Chase, Alpharetta, GA 30022
$-5,262
Cash flow
-17.2%
Cash-on-Cash Return
2.2%
Cap rate
0.4%
Rent to Value Ratio
Active
$650,000
4
bds
|
3
ba
|
2,316
sqft
|
built
1961
190 Azalea Dr, Roswell, GA 30075
$-1,873
Cash flow
-15.0%
Cash-on-Cash Return
2.7%
Cap rate
0.5%
Rent to Value Ratio
Active
$445,000
1
bds
|
1
ba
|
0
sqft
|
built
2008
222 12th St NE, Atlanta, GA 30309
$-1,623
Cash flow
-19.0%
Cash-on-Cash Return
1.8%
Cap rate
0.6%
Rent to Value Ratio
Active
$242,000
4
bds
|
2.5
ba
|
1,053
sqft
|
built
2003
4611 Ravenwood Loop, Union City, GA 30291
$-124
Cash flow
-2.7%
Cash-on-Cash Return
5.5%
Cap rate
0.8%
Rent to Value Ratio
Active
$249,000
3
bds
|
2.5
ba
|
1
sqft
|
built
1976
155 Rockfort Ct, College Park, GA 30349
$-384
Cash flow
-8.0%
Cash-on-Cash Return
4.3%
Cap rate
0.6%
Rent to Value Ratio
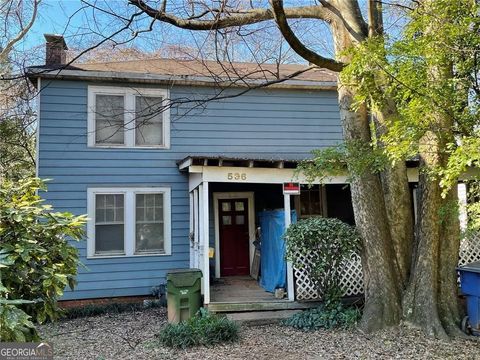
Active
$650,000
3
bds
|
1.5
ba
|
1,554
sqft
|
built
1920
536 Linwood Ave NE, Atlanta, GA 30306
$-1,773
Cash flow
-14.2%
Cash-on-Cash Return
2.9%
Cap rate
0.5%
Rent to Value Ratio
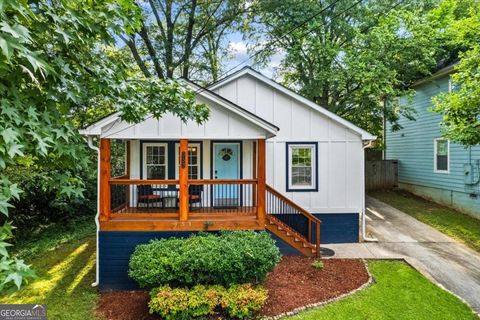
Active
$169,000
3
bds
|
1
ba
|
925
sqft
|
built
1955
3633 Bunker Hill Dr SW, Atlanta, GA 30331
$14
Cash flow
0.4%
Cash-on-Cash Return
6.2%
Cap rate
0.9%
Rent to Value Ratio
Active
$629,900
4
bds
|
3.5
ba
|
2,480
sqft
|
built
2012
1747 Hollingsworth Blvd NW, Atlanta, GA 30318
$-1,296
Cash flow
-10.7%
Cash-on-Cash Return
3.7%
Cap rate
0.6%
Rent to Value Ratio
Active
$280,000
3
bds
|
2
ba
|
1,003
sqft
|
built
1920
953 Garibaldi St SW, Atlanta, GA 30310
$-93
Cash flow
-1.7%
Cash-on-Cash Return
5.7%
Cap rate
0.8%
Rent to Value Ratio
Active
$355,000
3
bds
|
3.5
ba
|
1,972
sqft
|
built
2006
2038 Liberty Ct NW, Atlanta, GA 30318
$-455
Cash flow
-6.7%
Cash-on-Cash Return
4.6%
Cap rate
0.8%
Rent to Value Ratio
Active
$335,000
2
bds
|
1
ba
|
1,221
sqft
|
built
1920
172 Haynes St SW, Atlanta, GA 30313
$-690
Cash flow
-10.7%
Cash-on-Cash Return
3.7%
Cap rate
0.7%
Rent to Value Ratio
Active
$170,000
3
bds
|
2
ba
|
1,188
sqft
|
built
1965
1034 Forest Valley Dr SE, Atlanta, GA 30354
$73
Cash flow
2.2%
Cash-on-Cash Return
6.7%
Cap rate
1.1%
Rent to Value Ratio
Active
$729,000
4
bds
|
2.5
ba
|
3,508
sqft
|
built
1989
300 Farm Trak, Roswell, GA 30075
$-2,077
Cash flow
-14.9%
Cash-on-Cash Return
2.7%
Cap rate
0.4%
Rent to Value Ratio
Active
$449,900
3
bds
|
4
ba
|
3,312
sqft
|
built
1973
45 Willow Gln, Sandy Springs, GA 30342
$-1,067
Cash flow
-12.4%
Cash-on-Cash Return
3.3%
Cap rate
0.8%
Rent to Value Ratio