Fulton County Investment Properties for Sale
Browse homes for sale and investment properties in Fulton County. Refine your search by price, property type, or more.
Best cash flowing properties in Fulton County
Active
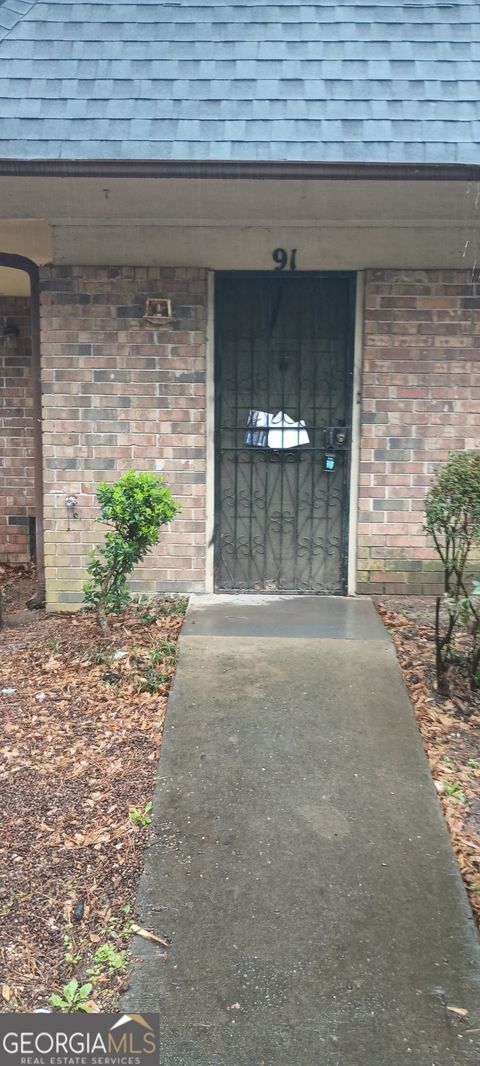
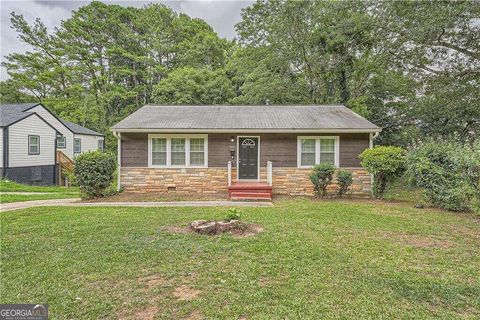
$100,000
3
bds
|
0
ba
|
0
sqft
|
built
1976
91 Peyton Pl SW, Atlanta, GA 30311
$511
Cash flow
26.7%
Cash-on-Cash Return
12.3%
Cap rate
1.6%
Rent to Value Ratio
Active
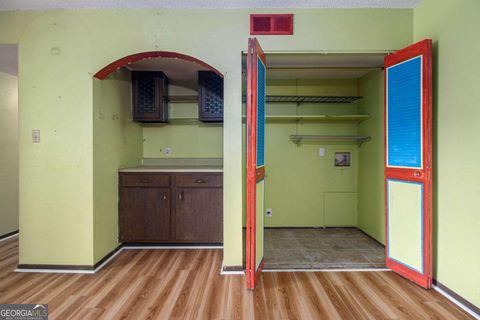
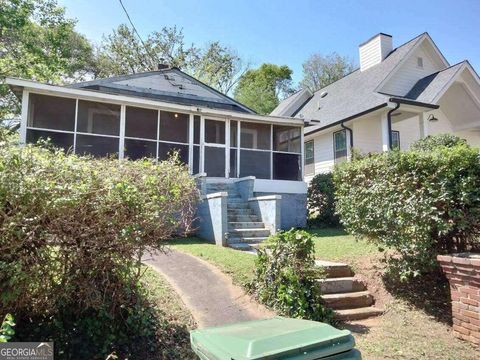
$75,000
3
bds
|
0
ba
|
1,282
sqft
|
built
1970
112 Camelot Dr, Atlanta, GA 30349
$327
Cash flow
22.7%
Cash-on-Cash Return
11.4%
Cap rate
1.9%
Rent to Value Ratio
4,641 out of 5,611 properties for sale in Fulton County
Limited Results Shown
Create a free account, or log in to reveal all property listings and enjoy the complete experience.
Active
$2,300,000
10
bds
|
0
ba
|
0
sqft
|
built
1987
2010 Stonehedge Rd, Roswell, GA 30075
$-6,249
Cash flow
-14.2%
Cash-on-Cash Return
2.9%
Cap rate
0.4%
Rent to Value Ratio
Active
$185,000
1
bds
|
1
ba
|
837
sqft
|
built
1967
2479 Peachtree Rd NE, Atlanta, GA 30305
$-767
Cash flow
-21.6%
Cash-on-Cash Return
1.2%
Cap rate
1.0%
Rent to Value Ratio
Active
$500,000
2
bds
|
1
ba
|
0
sqft
|
built
1949
1003 Edie Ave SE, Atlanta, GA 30312
$-1,481
Cash flow
-15.5%
Cash-on-Cash Return
2.6%
Cap rate
0.4%
Rent to Value Ratio
Active
$385,000
2
bds
|
0
ba
|
1,680
sqft
|
built
1991
3435 Kingsboro Rd NE, Atlanta, GA 30326
$-1,226
Cash flow
-16.6%
Cash-on-Cash Return
2.3%
Cap rate
0.7%
Rent to Value Ratio
Active
$335,000
3
bds
|
0
ba
|
1,553
sqft
|
built
1950
1875 Langston Ave SW, Atlanta, GA 30310
$-364
Cash flow
-5.7%
Cash-on-Cash Return
4.8%
Cap rate
0.8%
Rent to Value Ratio
Active
$224,800
1
bds
|
1
ba
|
0
sqft
|
built
1988
2870 Pharr Court South NW, Atlanta, GA 30305
$-674
Cash flow
-15.6%
Cash-on-Cash Return
2.6%
Cap rate
0.8%
Rent to Value Ratio
Active
$399,500
4
bds
|
4
ba
|
2,300
sqft
|
built
2001
581 Cooper St SW, Atlanta, GA 30312
$-771
Cash flow
-10.1%
Cash-on-Cash Return
3.8%
Cap rate
0.6%
Rent to Value Ratio

Active
$4,990,000
7
bds
|
8
ba
|
0
sqft
|
built
2000
3206 Arden Rd NW, Atlanta, GA 30305
$-26,691
Cash flow
-27.9%
Cash-on-Cash Return
-0.3%
Cap rate
0.1%
Rent to Value Ratio
Active
$285,000
3
bds
|
0
ba
|
0
sqft
|
built
2005
2259 Sisk St NW, Atlanta, GA 30318
$-507
Cash flow
-9.3%
Cash-on-Cash Return
4.0%
Cap rate
0.7%
Rent to Value Ratio

Active
$199,500
2
bds
|
2
ba
|
0
sqft
|
built
2006
898 Oak St SW, Atlanta, GA 30310
$-420
Cash flow
-11.0%
Cash-on-Cash Return
3.6%
Cap rate
1.0%
Rent to Value Ratio
Active
$384,999
4
bds
|
0
ba
|
3,426
sqft
|
built
2007
7495 Saint David St, Fairburn, GA 30213
$-682
Cash flow
-9.2%
Cash-on-Cash Return
4.0%
Cap rate
0.6%
Rent to Value Ratio
Active
$225,000
2
bds
|
0
ba
|
1,130
sqft
|
built
1995
20 Marietta St NW, Atlanta, GA 30303
$-614
Cash flow
-14.2%
Cash-on-Cash Return
2.9%
Cap rate
1.0%
Rent to Value Ratio
Active
$769,900
4
bds
|
0
ba
|
2,395
sqft
|
built
1999
79 Hammock Pl SE, Atlanta, GA 30312
$-1,685
Cash flow
-11.4%
Cash-on-Cash Return
3.5%
Cap rate
0.5%
Rent to Value Ratio
Active
$275,000
3
bds
|
0
ba
|
1,104
sqft
|
built
1958
1650 Bridgeport Dr NW, Atlanta, GA 30318
$-283
Cash flow
-5.4%
Cash-on-Cash Return
4.9%
Cap rate
0.7%
Rent to Value Ratio
Active
$274,000
3
bds
|
0
ba
|
2,115
sqft
|
built
1951
2122 Belhaven Ln SE, Atlanta, GA 30315
$9
Cash flow
0.2%
Cash-on-Cash Return
6.2%
Cap rate
0.8%
Rent to Value Ratio

Active
$1,300,000
5
bds
|
5
ba
|
0
sqft
|
built
2009
1686 Barfield Run NW, Atlanta, GA 30318
$-5,325
Cash flow
-21.4%
Cash-on-Cash Return
1.2%
Cap rate
0.3%
Rent to Value Ratio
Active
$399,900
3
bds
|
0
ba
|
1,198
sqft
|
built
1930
976 Washington St SW, Atlanta, GA 30315
$-426
Cash flow
-5.6%
Cash-on-Cash Return
4.9%
Cap rate
0.7%
Rent to Value Ratio
Active
$250,000
3
bds
|
0
ba
|
0
sqft
|
built
1955
2666 Blount St, East Point, GA 30344
$-172
Cash flow
-3.6%
Cash-on-Cash Return
5.3%
Cap rate
0.7%
Rent to Value Ratio
Active
$289,000
1
bds
|
1
ba
|
972
sqft
|
built
1991
4254 River Green Dr NW, Atlanta, GA 30327
$-414
Cash flow
-7.5%
Cash-on-Cash Return
4.4%
Cap rate
0.8%
Rent to Value Ratio
Active
$245,000
2
bds
|
0
ba
|
1,084
sqft
|
built
1930
988 Herndon St NW, Atlanta, GA 30318
$-316
Cash flow
-6.7%
Cash-on-Cash Return
4.6%
Cap rate
0.7%
Rent to Value Ratio
Active
$455,000
5
bds
|
0
ba
|
3,511
sqft
|
built
2006
2669 Saint Paul Dr SW, Atlanta, GA 30331
$-734
Cash flow
-8.4%
Cash-on-Cash Return
4.2%
Cap rate
0.7%
Rent to Value Ratio

Active
$280,000
2
bds
|
1
ba
|
0
sqft
|
built
1955
939 Beecher Ct SW, Atlanta, GA 30311
$-334
Cash flow
-6.2%
Cash-on-Cash Return
4.7%
Cap rate
0.6%
Rent to Value Ratio

Active
$192,000
3
bds
|
0
ba
|
1,380
sqft
|
built
1999
101 Dodd St, Fairburn, GA 30213
$-25
Cash flow
-0.7%
Cash-on-Cash Return
6.0%
Cap rate
0.8%
Rent to Value Ratio
Active
$1,150,000
4
bds
|
0
ba
|
0
sqft
|
built
1920
71 17th St NE, Atlanta, GA 30309
$-4,811
Cash flow
-21.8%
Cash-on-Cash Return
1.1%
Cap rate
0.4%
Rent to Value Ratio
Active
$75,000
3
bds
|
0
ba
|
1,282
sqft
|
built
1970
112 Camelot Dr, Atlanta, GA 30349
$327
Cash flow
22.7%
Cash-on-Cash Return
11.4%
Cap rate
1.9%
Rent to Value Ratio

Active
$4,250,000
7
bds
|
0
ba
|
12,696
sqft
|
built
2009
56 Mount Paran Rd, Sandy Springs, GA 30327
$-19,218
Cash flow
-23.6%
Cash-on-Cash Return
0.7%
Cap rate
0.2%
Rent to Value Ratio
Active
$259,900
8
bds
|
0
ba
|
2,148
sqft
|
built
1930
1005 Ashby Ter NW, Atlanta, GA 30314
$-357
Cash flow
-7.2%
Cash-on-Cash Return
4.5%
Cap rate
0.7%
Rent to Value Ratio
Active
$80,500
1
bds
|
1
ba
|
0
sqft
|
built
1972
4701 Flat Shoals Rd, Union City, GA 30291
$137
Cash flow
8.9%
Cash-on-Cash Return
8.2%
Cap rate
1.6%
Rent to Value Ratio
Active
$289,000
1
bds
|
1
ba
|
0
sqft
|
built
2005
620 Glen Iris Dr NE, Atlanta, GA 30308
$-812
Cash flow
-14.7%
Cash-on-Cash Return
2.8%
Cap rate
0.6%
Rent to Value Ratio
Active
$280,000
1
bds
|
0
ba
|
821
sqft
|
built
1996
955 Juniper St NE, Atlanta, GA 30309
$-428
Cash flow
-8.0%
Cash-on-Cash Return
4.3%
Cap rate
0.7%
Rent to Value Ratio

Active
$190,000
1
bds
|
0
ba
|
711
sqft
|
built
1989
311 Granville Ct, Sandy Springs, GA 30328
$-23
Cash flow
-0.6%
Cash-on-Cash Return
6.0%
Cap rate
0.8%
Rent to Value Ratio
Active
$2,750,000
2
bds
|
0
ba
|
3,104
sqft
|
built
2008
3344 Peachtree Rd NE, Atlanta, GA 30326
$-14,827
Cash flow
-28.1%
Cash-on-Cash Return
-0.3%
Cap rate
0.3%
Rent to Value Ratio
Active
$350,000
2
bds
|
2
ba
|
1,355
sqft
|
built
2000
1735 Peachtree St NE, Atlanta, GA 30309
$-1,137
Cash flow
-16.9%
Cash-on-Cash Return
2.2%
Cap rate
0.7%
Rent to Value Ratio
Active
$100,000
3
bds
|
0
ba
|
0
sqft
|
built
1976
91 Peyton Pl SW, Atlanta, GA 30311
$511
Cash flow
26.7%
Cash-on-Cash Return
12.3%
Cap rate
1.6%
Rent to Value Ratio

Active
$159,900
3
bds
|
0
ba
|
0
sqft
|
built
1928
781 Peyton Ave NW, Atlanta, GA 30318
$85
Cash flow
2.8%
Cash-on-Cash Return
6.8%
Cap rate
1.0%
Rent to Value Ratio

Active
$209,000
2
bds
|
2
ba
|
1,392
sqft
|
built
1968
6520 Roswell Rd, Atlanta, GA 30328
$-441
Cash flow
-11.0%
Cash-on-Cash Return
3.6%
Cap rate
1.0%
Rent to Value Ratio
Active
$245,900
1
bds
|
1
ba
|
0
sqft
|
built
2004
401 16th St NW, Atlanta, GA 30363
$-148
Cash flow
-3.1%
Cash-on-Cash Return
5.4%
Cap rate
0.8%
Rent to Value Ratio

Active
$199,900
2
bds
|
0
ba
|
0
sqft
|
built
1985
102 Gettysburg Pl, Sandy Springs, GA 30350
$-101
Cash flow
-2.6%
Cash-on-Cash Return
5.5%
Cap rate
0.9%
Rent to Value Ratio

Active
$230,000
3
bds
|
4
ba
|
0
sqft
|
built
1986
42 Belmonte Cir SW, Atlanta, GA 30311
$-491
Cash flow
-11.1%
Cash-on-Cash Return
3.6%
Cap rate
0.8%
Rent to Value Ratio
Active
$281,000
3
bds
|
0
ba
|
1,784
sqft
|
built
1977
2140 Fern Valley Dr SW, Atlanta, GA 30331
$-152
Cash flow
-2.8%
Cash-on-Cash Return
5.5%
Cap rate
0.8%
Rent to Value Ratio