Fulton County Investment Properties for Sale
Browse homes for sale and investment properties in Fulton County. Refine your search by price, property type, or more.
Best cash flowing properties in Fulton County

Active
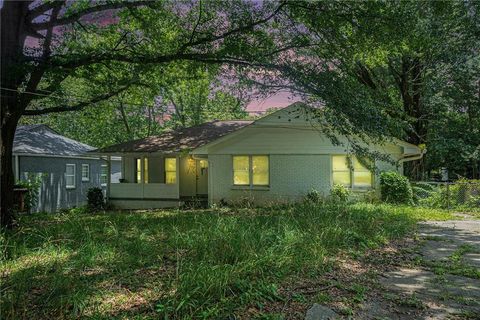
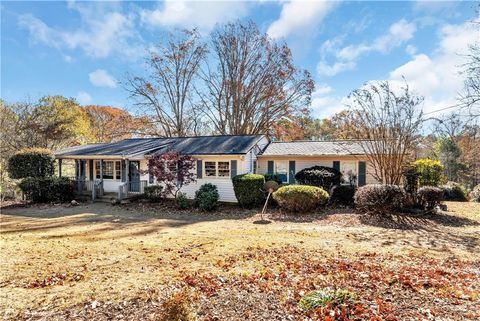
$85,000
4
bds
|
0
ba
|
0
sqft
|
built
1970
124 Camelot Dr, Atlanta, GA 30349
$597
Cash flow
36.6%
Cash-on-Cash Return
14.7%
Cap rate
1.9%
Rent to Value Ratio
Active
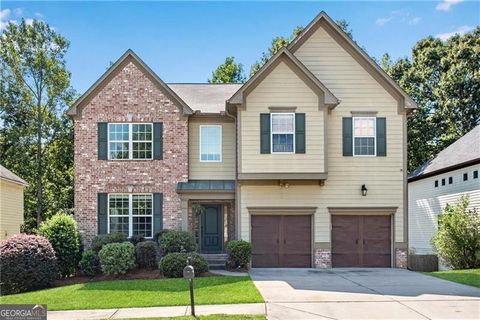
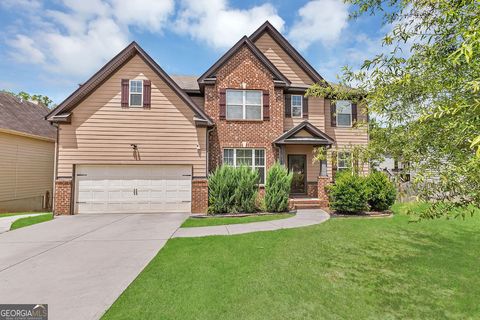
$226,900
5
bds
|
3
ba
|
0
sqft
|
built
1960
1212 Eastridge Rd SW, Atlanta, GA 30311
$268
Cash flow
6.2%
Cash-on-Cash Return
7.7%
Cap rate
1.2%
Rent to Value Ratio
4,727 out of 5,601 properties for sale in Fulton County
Limited Results Shown
Create a free account, or log in to reveal all property listings and enjoy the complete experience.
Active
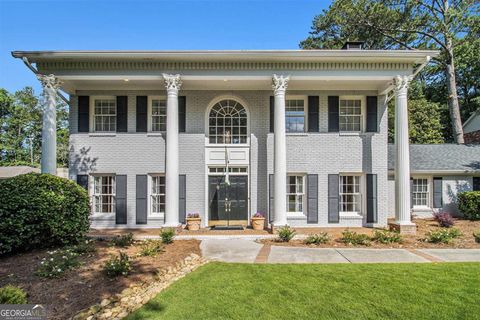
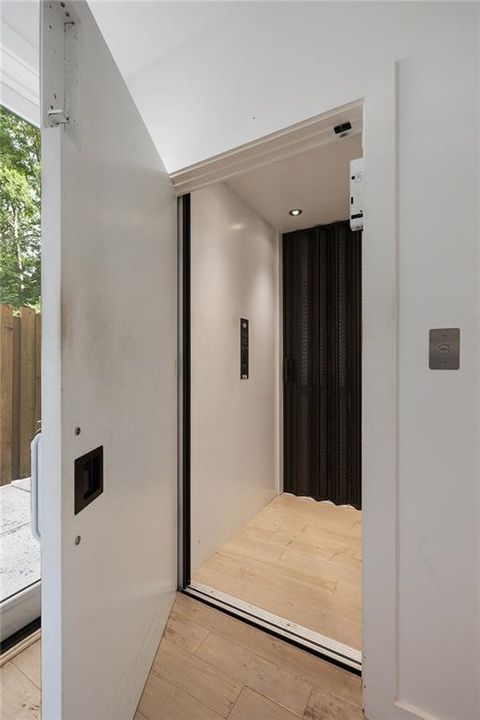
$460,000
4
bds
|
0
ba
|
5,804
sqft
|
built
2007
5688 Baffin Rd, Atlanta, GA 30349
$-836
Cash flow
-9.5%
Cash-on-Cash Return
4.1%
Cap rate
0.6%
Rent to Value Ratio

Active
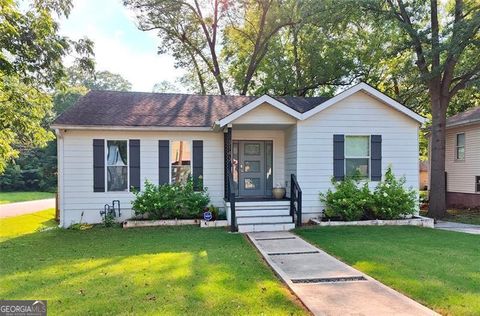
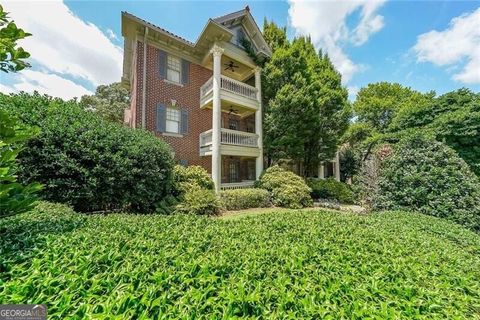
$450,000
4
bds
|
2
ba
|
0
sqft
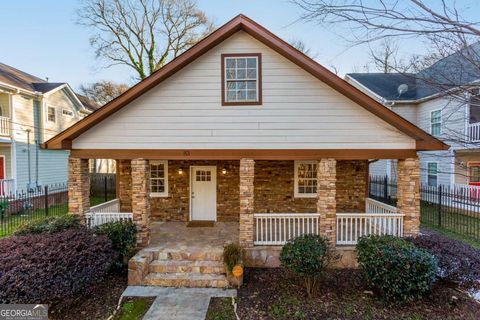
|
built
1930
85 Ollie St NW, Atlanta, GA 30314
$-1,100
Cash flow
-12.8%
Cash-on-Cash Return
3.3%
Cap rate
0.4%
Rent to Value Ratio
Active
$1,095,000
4
bds
|
0
ba
|
3,526
sqft
|
built
1978
6300 Blackwater Trl, Sandy Springs, GA 30328
$-2,727
Cash flow
-13.0%
Cash-on-Cash Return
3.3%
Cap rate
0.5%
Rent to Value Ratio
Active
$226,900
5
bds
|
3
ba
|
0
sqft
|
built
1960
1212 Eastridge Rd SW, Atlanta, GA 30311
$268
Cash flow
6.2%
Cash-on-Cash Return
7.7%
Cap rate
1.2%
Rent to Value Ratio

Active
$174,900
1
bds
|
0
ba
|
0
sqft
|
built
1925
1332 Mc Clelland Ave, East Point, GA 30344
$-446
Cash flow
-13.3%
Cash-on-Cash Return
3.2%
Cap rate
0.5%
Rent to Value Ratio
Active
$399,900
4
bds
|
0
ba
|
2,716
sqft
|
built
1946
3143 Church St, East Point, GA 30344
$-614
Cash flow
-8.0%
Cash-on-Cash Return
4.3%
Cap rate
0.6%
Rent to Value Ratio
Active
$589,000
3
bds
|
2
ba
|
0
sqft
|
built
1950
15756 Hopewell Rd, Alpharetta, GA 30004
$-1,550
Cash flow
-13.7%
Cash-on-Cash Return
3.1%
Cap rate
0.5%
Rent to Value Ratio
Active
$85,000
4
bds
|
0
ba
|
0
sqft
|
built
1970
124 Camelot Dr, Atlanta, GA 30349
$597
Cash flow
36.6%
Cash-on-Cash Return
14.7%
Cap rate
1.9%
Rent to Value Ratio
Active
$475,000
6
bds
|
0
ba
|
4,642
sqft
|
built
2016
2619 Dayview Ln, Atlanta, GA 30331
$-1,032
Cash flow
-11.3%
Cash-on-Cash Return
3.7%
Cap rate
0.6%
Rent to Value Ratio
Active
$1,900,000
4
bds
|
4
ba
|
3,253
sqft
|
built
1930
1656 N Pelham Rd NE, Atlanta, GA 30324
$-7,179
Cash flow
-19.7%
Cash-on-Cash Return
1.7%
Cap rate
0.3%
Rent to Value Ratio
Active
$265,000
1
bds
|
0
ba
|
1,006
sqft
|
built
1925
2 Collier Rd NW, Atlanta, GA 30309
$-584
Cash flow
-11.5%
Cash-on-Cash Return
3.5%
Cap rate
0.8%
Rent to Value Ratio
Active
$145,000
1
bds
|
1
ba
|
0
sqft
|
built
2002
502 Pryor St SW, Atlanta, GA 30312
$-451
Cash flow
-16.2%
Cash-on-Cash Return
2.5%
Cap rate
1.0%
Rent to Value Ratio
Active
$294,900
3
bds
|
0
ba
|
1,680
sqft
|
built
2005
1159 Smith St SW, Atlanta, GA 30310
$-592
Cash flow
-10.5%
Cash-on-Cash Return
3.9%
Cap rate
0.6%
Rent to Value Ratio
Active
$335,000
3
bds
|
0
ba
|
1,936
sqft
|
built
2015
2010 Shortleaf Rd, Fairburn, GA 30213
$-507
Cash flow
-7.9%
Cash-on-Cash Return
4.4%
Cap rate
0.7%
Rent to Value Ratio

Active
$327,500
3
bds
|
0
ba
|
1,344
sqft
|
built
2005
1833 Phillips Ave, East Point, GA 30344
$-507
Cash flow
-8.1%
Cash-on-Cash Return
4.4%
Cap rate
0.7%
Rent to Value Ratio
Active
$309,000
3
bds
|
0
ba
|
1,776
sqft
|
built
2019
5512 Cascade Run SW, Atlanta, GA 30336
$-503
Cash flow
-8.5%
Cash-on-Cash Return
4.2%
Cap rate
0.7%
Rent to Value Ratio

Active
$294,900
5
bds
|
0
ba
|
0
sqft
|
built
2007
2005 Chicago Ave NW, Atlanta, GA 30314
$-286
Cash flow
-5.1%
Cash-on-Cash Return
5.1%
Cap rate
0.8%
Rent to Value Ratio
Active
$640,000
3
bds
|
4
ba
|
0
sqft
|
built
2018
711 Topsail Ln, Alpharetta, GA 30005
$-1,593
Cash flow
-13.0%
Cash-on-Cash Return
3.3%
Cap rate
0.6%
Rent to Value Ratio
Active
$315,000
1
bds
|
1
ba
|
0
sqft
|
built
1975
145 15th St NE, Atlanta, GA 30309
$-1,207
Cash flow
-20.0%
Cash-on-Cash Return
1.7%
Cap rate
0.8%
Rent to Value Ratio
Active
$565,000
4
bds
|
0
ba
|
2,328
sqft
|
built
1996
7000 Foxberry Ln, Roswell, GA 30075
$-999
Cash flow
-9.2%
Cash-on-Cash Return
4.1%
Cap rate
0.6%
Rent to Value Ratio
Active
$1,200,000
4
bds
|
0
ba
|
5,000
sqft
|
built
1988
2885 Coles Way, Sandy Springs, GA 30350
$-2,475
Cash flow
-10.8%
Cash-on-Cash Return
3.7%
Cap rate
0.5%
Rent to Value Ratio

Active
$290,000
4
bds
|
0
ba
|
1,233
sqft
|
built
1988
259 Tarragon Way SW, Atlanta, GA 30331
$-206
Cash flow
-3.7%
Cash-on-Cash Return
5.4%
Cap rate
0.8%
Rent to Value Ratio
Active
$395,000
2
bds
|
0
ba
|
0
sqft
|
built
2004
655 Mead St SE, Atlanta, GA 30312
$-768
Cash flow
-10.1%
Cash-on-Cash Return
3.9%
Cap rate
0.6%
Rent to Value Ratio
Active
$1,995,000
3
bds
|
0
ba
|
3,908
sqft
|
built
1919
16 Walker Ter NE, Atlanta, GA 30309
$-6,547
Cash flow
-17.1%
Cash-on-Cash Return
2.3%
Cap rate
0.4%
Rent to Value Ratio
Active
$229,000
3
bds
|
2
ba
|
0
sqft
|
built
1950
132 Lamar Ave NW, Atlanta, GA 30314
$11
Cash flow
0.3%
Cash-on-Cash Return
6.3%
Cap rate
0.9%
Rent to Value Ratio

Active
$360,000
3
bds
|
0
ba
|
0
sqft
|
built
1989
2720 Thornbury Way, Atlanta, GA 30349
$-876
Cash flow
-12.7%
Cash-on-Cash Return
3.2%
Cap rate
0.5%
Rent to Value Ratio
Active
$290,900
3
bds
|
0
ba
|
1,526
sqft
|
built
2005
7750 Carnegie Dr, Fairburn, GA 30213
$-555
Cash flow
-10.0%
Cash-on-Cash Return
3.9%
Cap rate
0.7%
Rent to Value Ratio
Active
$2,295,000
6
bds
|
8
ba
|
8,759
sqft
|
built
2007
980 Fenimore Cir, Sandy Springs, GA 30350
$-8,761
Cash flow
-19.9%
Cash-on-Cash Return
1.6%
Cap rate
0.3%
Rent to Value Ratio
Active
$399,999
4
bds
|
0
ba
|
3,200
sqft
|
built
2008
3405 Summer Brooke Way, Union City, GA 30291
$-689
Cash flow
-9.0%
Cash-on-Cash Return
4.1%
Cap rate
0.6%
Rent to Value Ratio
Active
$389,000
3
bds
|
4
ba
|
0
sqft
|
built
2010
3014 Liberty Way NW, Atlanta, GA 30318
$-1,071
Cash flow
-14.4%
Cash-on-Cash Return
3.0%
Cap rate
0.6%
Rent to Value Ratio
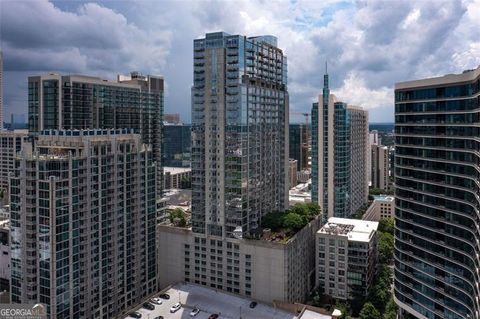
Active
$432,900
2
bds
|
0
ba
|
1,075
sqft
|
built
2007
400 W Peachtree St NW, Atlanta, GA 30308
$-474
Cash flow
-5.7%
Cash-on-Cash Return
5.0%
Cap rate
0.7%
Rent to Value Ratio
Active
$1,250,000
2
bds
|
0
ba
|
2,311
sqft
|
built
2007
2105 Fairhaven Cir NE, Atlanta, GA 30305
$-1,105
Cash flow
-4.6%
Cash-on-Cash Return
5.2%
Cap rate
0.6%
Rent to Value Ratio
Active
$495,000
2
bds
|
0
ba
|
1,201
sqft
|
built
2008
855 Peachtree St NE, Atlanta, GA 30308
$-993
Cash flow
-10.5%
Cash-on-Cash Return
3.9%
Cap rate
0.6%
Rent to Value Ratio
Active
$685,000
5
bds
|
0
ba
|
2,772
sqft
|
built
1920
83 Ormond St SE, Atlanta, GA 30315
$-1,981
Cash flow
-15.1%
Cash-on-Cash Return
2.8%
Cap rate
0.5%
Rent to Value Ratio
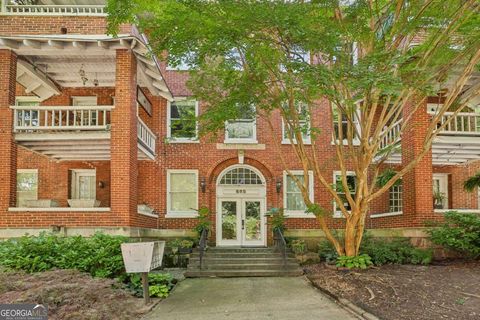
Active
$475,000
2
bds
|
0
ba
|
1,697
sqft
|
built
1917
685 Argonne Ave NE, Atlanta, GA 30308
$-1,090
Cash flow
-12.0%
Cash-on-Cash Return
3.5%
Cap rate
0.5%
Rent to Value Ratio
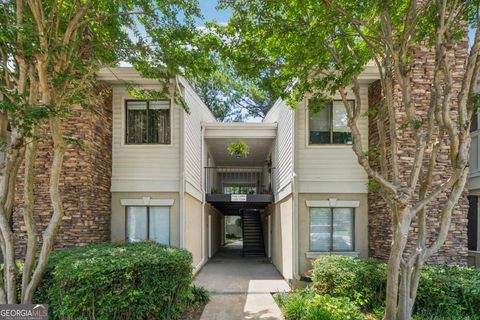
Active
$165,000
1
bds
|
0
ba
|
794
sqft
|
built
1985
1504 Wingate Way, Sandy Springs, GA 30350
$-286
Cash flow
-9.0%
Cash-on-Cash Return
4.2%
Cap rate
0.9%
Rent to Value Ratio
Active
$540,000
3
bds
|
0
ba
|
0
sqft
|
built
2015
3526 Peacock Rd, Alpharetta, GA 30004
$-1,386
Cash flow
-13.4%
Cash-on-Cash Return
3.2%
Cap rate
0.5%
Rent to Value Ratio
Active
$520,000
3
bds
|
0
ba
|
2,252
sqft
|
built
1996
5035 Foxberry Ln, Roswell, GA 30075
$-1,026
Cash flow
-10.3%
Cash-on-Cash Return
3.9%
Cap rate
0.6%
Rent to Value Ratio
Active
$1,100,000
5
bds
|
0
ba
|
0
sqft
|
built
2003
4054 Lyon Blvd SW, Atlanta, GA 30331
$-3,010
Cash flow
-14.3%
Cash-on-Cash Return
3.0%
Cap rate
0.6%
Rent to Value Ratio
Active
$220,000
2
bds
|
0
ba
|
835
sqft
|
built
1950
1 Lamar Ave SW, Atlanta, GA 30310
$-94
Cash flow
-2.2%
Cash-on-Cash Return
5.8%
Cap rate
0.8%
Rent to Value Ratio