Fulton County Investment Properties for Sale
Browse homes for sale and investment properties in Fulton County. Refine your search by price, property type, or more.
Best cash flowing properties in Fulton County
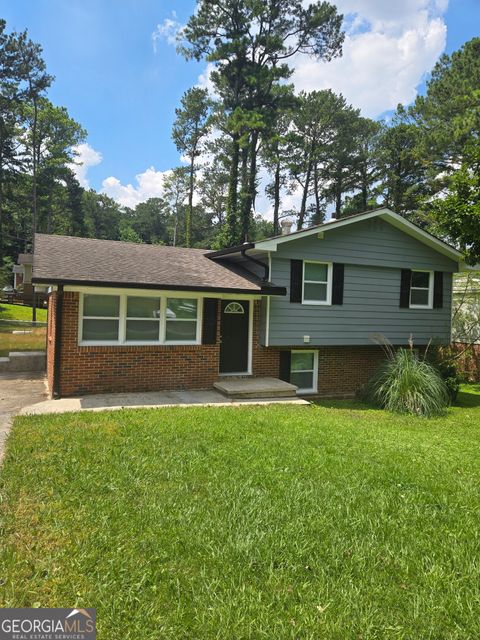
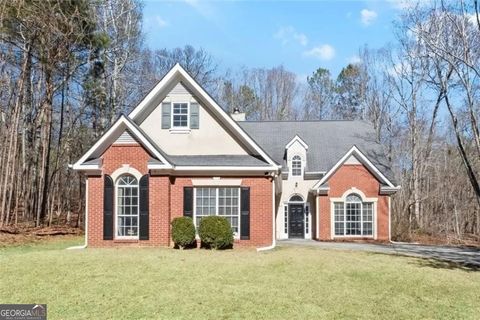
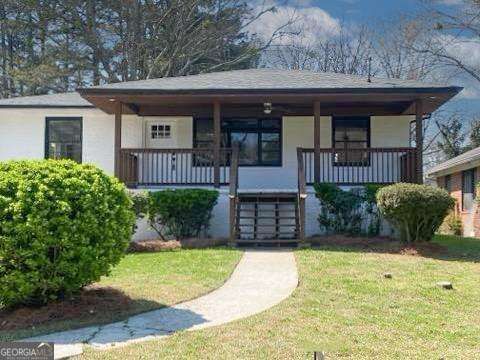
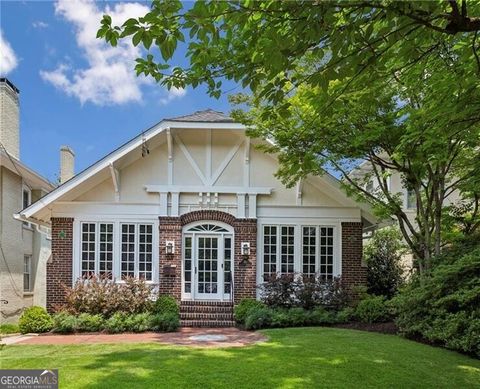
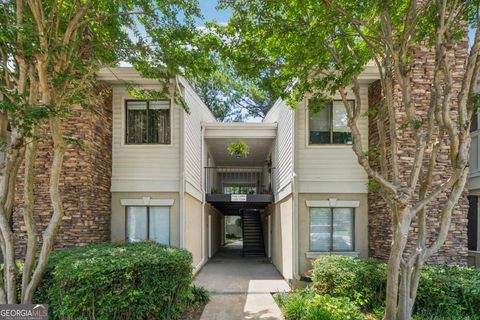
Active
$229,000
4
bds
|
2
ba
|
1,240
sqft
|
built
1967
993 Roosevelt Dr SE, Atlanta, GA 30354
$135
Cash flow
3.1%
Cash-on-Cash Return
6.9%
Cap rate
0.9%
Rent to Value Ratio
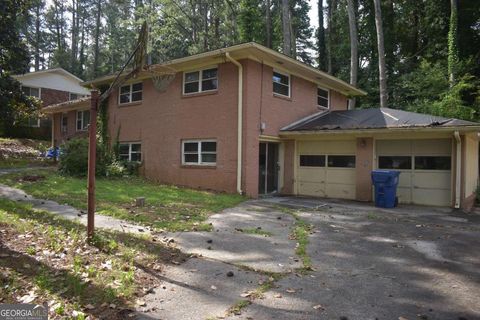
Active
$205,000
3
bds
|
0
ba
|
0
sqft
|
built
1964
3798 King Henry Rd SW, Atlanta, GA 30331
$61
Cash flow
1.6%
Cash-on-Cash Return
6.5%
Cap rate
0.9%
Rent to Value Ratio
2,714 out of 3,335 properties for sale in Fulton County
Limited Results Shown
Create a free account, or log in to reveal all property listings and enjoy the complete experience.

Active
$340,990
5
bds
|
3
ba
|
2,610
sqft
|
built
2006
6432 Polar Fox Ct, Riverdale, GA 30296
$-583
Cash flow
-8.9%
Cash-on-Cash Return
4.1%
Cap rate
0.7%
Rent to Value Ratio
Active
$204,000
3
bds
|
1.5
ba
|
1,269
sqft
|
built
1970
4748 Carson Pass SW, Atlanta, GA 30331
$-126
Cash flow
-3.2%
Cash-on-Cash Return
5.4%
Cap rate
0.8%
Rent to Value Ratio
Active
$749,998
6
bds
|
5.5
ba
|
5,243
sqft
|
built
2006
8260 Equinox Ln, Fairburn, GA 30213
$-2,384
Cash flow
-16.6%
Cash-on-Cash Return
2.3%
Cap rate
0.4%
Rent to Value Ratio

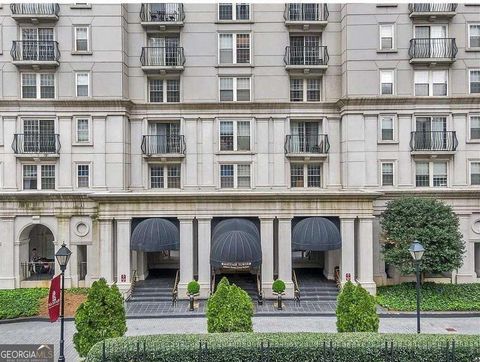
Active
$264,900
1
bds
|
1
ba
|
0
sqft
|
built
2005
620 Glen Iris Dr NE, Atlanta, GA 30308
$-92
Cash flow
-1.8%
Cash-on-Cash Return
5.7%
Cap rate
1.1%
Rent to Value Ratio
Active
$269,900
1
bds
|
0
ba
|
533
sqft
|
built
1992
199 14th St NE, Atlanta, GA 30309
$-828
Cash flow
-16.0%
Cash-on-Cash Return
2.5%
Cap rate
0.7%
Rent to Value Ratio

Active
$2,195,000
5
bds
|
5.5
ba
|
5,216
sqft
|
built
2017
1895 Henley Way, Alpharetta, GA 30009
$-8,625
Cash flow
-20.5%
Cash-on-Cash Return
1.4%
Cap rate
0.2%
Rent to Value Ratio
Active
$295,000
3
bds
|
0
ba
|
1,359
sqft
|
built
1999
4021 Melvin Dr SW, Atlanta, GA 30331
$-514
Cash flow
-9.1%
Cash-on-Cash Return
4.1%
Cap rate
0.7%
Rent to Value Ratio

Active
$510,000
4
bds
|
2.5
ba
|
2,376
sqft
|
built
1981
650 Lake Forest Ct, Roswell, GA 30076
$-1,112
Cash flow
-11.4%
Cash-on-Cash Return
3.5%
Cap rate
0.5%
Rent to Value Ratio
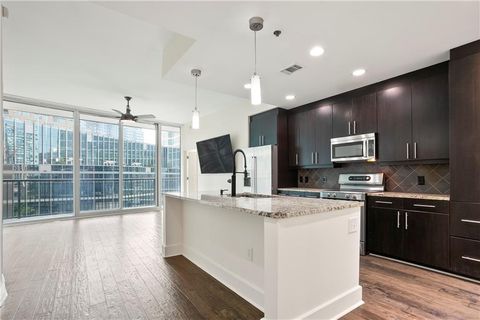
Active
$504,990
2
bds
|
2
ba
|
0
sqft
|
built
2008
1080 Peachtree St NE, Atlanta, GA 30309
$-1,511
Cash flow
-15.6%
Cash-on-Cash Return
2.6%
Cap rate
0.7%
Rent to Value Ratio

Active
$4,250,000
5
bds
|
0
ba
|
0
sqft
|
built
2018
3891 Wieuca Rd NE, Atlanta, GA 30342
$-18,509
Cash flow
-22.7%
Cash-on-Cash Return
0.9%
Cap rate
0.2%
Rent to Value Ratio
Active
$275,000
3
bds
|
0
ba
|
1,336
sqft
|
built
1948
2879 Harlan Dr, East Point, GA 30344
$-214
Cash flow
-4.1%
Cash-on-Cash Return
5.2%
Cap rate
0.7%
Rent to Value Ratio
Active
$380,000
1
bds
|
1
ba
|
1,303
sqft
|
built
2006
3445 Stratford Rd NE, Atlanta, GA 30326
$-1,237
Cash flow
-17.0%
Cash-on-Cash Return
2.2%
Cap rate
0.7%
Rent to Value Ratio
Active
$225,000
2
bds
|
0
ba
|
0
sqft
|
built
1959
3769 Amber Rd NW, Atlanta, GA 30331
$22
Cash flow
0.5%
Cash-on-Cash Return
6.3%
Cap rate
0.8%
Rent to Value Ratio
Active
$245,000
1
bds
|
1.5
ba
|
901
sqft
|
built
2009
711 Cosmopolitan Dr NE, Atlanta, GA 30324
$-791
Cash flow
-16.8%
Cash-on-Cash Return
2.3%
Cap rate
0.7%
Rent to Value Ratio
Active
$249,000
2
bds
|
0
ba
|
1,186
sqft
|
built
1940
1597 Joseph E Boone Blvd NW, Atlanta, GA 30314
$-139
Cash flow
-2.9%
Cash-on-Cash Return
5.5%
Cap rate
0.7%
Rent to Value Ratio

Active
$575,000
3
bds
|
3.5
ba
|
0
sqft
|
built
1925
1530 Niskey Lake Trl SW, Atlanta, GA 30331
$-907
Cash flow
-8.2%
Cash-on-Cash Return
4.3%
Cap rate
0.7%
Rent to Value Ratio
Active
$339,000
3
bds
|
0
ba
|
1,910
sqft
|
built
1965
662 Gary Rd NW, Atlanta, GA 30318
$-99
Cash flow
-1.5%
Cash-on-Cash Return
5.8%
Cap rate
0.8%
Rent to Value Ratio

Active
$349,000
1
bds
|
1
ba
|
805
sqft
|
built
2008
1080 Peachtree St NE, Atlanta, GA 30309
$-623
Cash flow
-9.3%
Cash-on-Cash Return
4.0%
Cap rate
0.7%
Rent to Value Ratio
Active
$355,000
1
bds
|
1
ba
|
972
sqft
|
built
2006
3445 Stratford Rd NE, Atlanta, GA 30326
$-1,005
Cash flow
-14.8%
Cash-on-Cash Return
2.7%
Cap rate
0.6%
Rent to Value Ratio

Active
$335,000
2
bds
|
2
ba
|
1,100
sqft
|
built
2009
1903 Anjaco Rd NW, Atlanta, GA 30309
$-643
Cash flow
-10.0%
Cash-on-Cash Return
3.8%
Cap rate
0.7%
Rent to Value Ratio

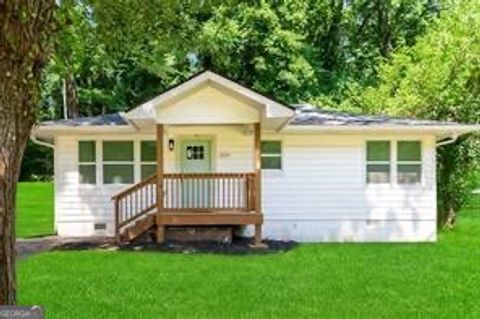
Active
$159,900
1
bds
|
0
ba
|
0
sqft
|
built
1925
1332 Mc Clelland Ave, East Point, GA 30344
$-352
Cash flow
-11.5%
Cash-on-Cash Return
3.5%
Cap rate
0.6%
Rent to Value Ratio
Active
$225,000
1
bds
|
1
ba
|
0
sqft
|
built
2004
401 16th St NW, Atlanta, GA 30363
$-669
Cash flow
-15.5%
Cash-on-Cash Return
2.6%
Cap rate
0.7%
Rent to Value Ratio

Active
$450,000
4
bds
|
2
ba
|
0
sqft
|
built
1930
85 Ollie St NW, Atlanta, GA 30314
$-1,056
Cash flow
-12.2%
Cash-on-Cash Return
3.3%
Cap rate
0.4%
Rent to Value Ratio
Active
$1,795,000
4
bds
|
4
ba
|
3,253
sqft
|
built
1930
1656 N Pelham Rd NE, Atlanta, GA 30324
$-6,455
Cash flow
-18.8%
Cash-on-Cash Return
1.8%
Cap rate
0.3%
Rent to Value Ratio
Active
$1,795,000
3
bds
|
3
ba
|
3,908
sqft
|
built
1919
16 Walker Ter NE, Atlanta, GA 30309
$-5,327
Cash flow
-15.5%
Cash-on-Cash Return
2.6%
Cap rate
0.4%
Rent to Value Ratio

Active
$265,000
2
bds
|
1
ba
|
0
sqft
|
built
1991
1201 River Green Dr NW, Atlanta, GA 30327
$-631
Cash flow
-12.4%
Cash-on-Cash Return
3.3%
Cap rate
0.8%
Rent to Value Ratio
Active
$399,999
4
bds
|
0
ba
|
3,200
sqft
|
built
2008
3405 Summer Brooke Way, Union City, GA 30291
$-689
Cash flow
-9.0%
Cash-on-Cash Return
4.1%
Cap rate
0.6%
Rent to Value Ratio
Active
$2,295,000
6
bds
|
8
ba
|
8,759
sqft
|
built
2007
980 Fenimore Cir, Sandy Springs, GA 30350
$-8,761
Cash flow
-19.9%
Cash-on-Cash Return
1.6%
Cap rate
0.3%
Rent to Value Ratio
Active
$1,189,000
2
bds
|
2
ba
|
2,311
sqft
|
built
2007
2105 Fairhaven Cir NE, Atlanta, GA 30305
$-670
Cash flow
-2.9%
Cash-on-Cash Return
5.5%
Cap rate
0.7%
Rent to Value Ratio
Active
$165,000
1
bds
|
1
ba
|
794
sqft
|
built
1985
1504 Wingate Way, Sandy Springs, GA 30350
$-270
Cash flow
-8.5%
Cash-on-Cash Return
4.2%
Cap rate
0.9%
Rent to Value Ratio
Active
$315,000
1
bds
|
1
ba
|
0
sqft
|
built
1975
145 15th St NE, Atlanta, GA 30309
$-1,176
Cash flow
-19.5%
Cash-on-Cash Return
1.7%
Cap rate
0.8%
Rent to Value Ratio
Active
$1,100,000
5
bds
|
0
ba
|
0
sqft
|
built
2003
4054 Lyon Blvd SW, Atlanta, GA 30331
$-2,902
Cash flow
-13.8%
Cash-on-Cash Return
3.0%
Cap rate
0.6%
Rent to Value Ratio

Active
$585,000
4
bds
|
3
ba
|
2,353
sqft
|
built
1970
970 Pine Grove Pointe Dr, Roswell, GA 30075
$-1,196
Cash flow
-10.7%
Cash-on-Cash Return
3.7%
Cap rate
0.5%
Rent to Value Ratio

Active
$857,900
5
bds
|
4
ba
|
3,360
sqft
|
built
1985
1438 Salem Dr, Alpharetta, GA 30009
$-364
Cash flow
-2.2%
Cash-on-Cash Return
5.6%
Cap rate
0.7%
Rent to Value Ratio

Active
$304,450
1
bds
|
1
ba
|
0
sqft
|
built
1999
1101 Juniper St NE, Atlanta, GA 30309
$-671
Cash flow
-11.5%
Cash-on-Cash Return
3.5%
Cap rate
0.7%
Rent to Value Ratio
Active
$285,000
1
bds
|
1
ba
|
770
sqft
|
built
2006
3040 Peachtree Rd NW, Atlanta, GA 30305
$-678
Cash flow
-12.4%
Cash-on-Cash Return
3.3%
Cap rate
0.8%
Rent to Value Ratio

Active
$1,450,000
3
bds
|
0
ba
|
0
sqft
|
built
1930
1039 Greenwood Ave NE, Atlanta, GA 30306
$-6,726
Cash flow
-24.2%
Cash-on-Cash Return
0.6%
Cap rate
0.2%
Rent to Value Ratio
Active
$475,000
2
bds
|
2
ba
|
1,330
sqft
|
built
1951
805 Peachtree St NE, Atlanta, GA 30308
$-935
Cash flow
-10.3%
Cash-on-Cash Return
3.8%
Cap rate
0.7%
Rent to Value Ratio