Goodland, FL Investment Properties for Sale
Browse homes for sale and investment properties in Goodland, FL. Refine your search by price, property type, or more.
Best cash flowing properties in Goodland, FL
Active
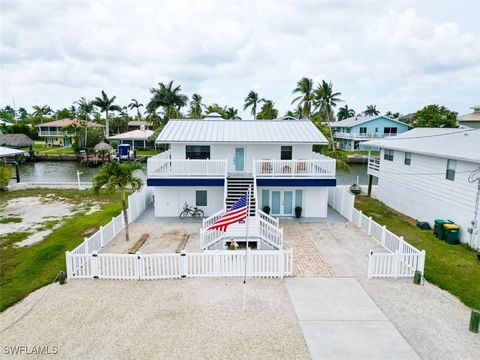
$948,888
3
bds
|
2
ba
|
2,040
sqft
|
built
1965
576 Coconut Ave, Goodland, FL 34140
$-417
Cash flow
-2.3%
Cash-on-Cash Return
5.6%
Cap rate
0.7%
Rent to Value Ratio

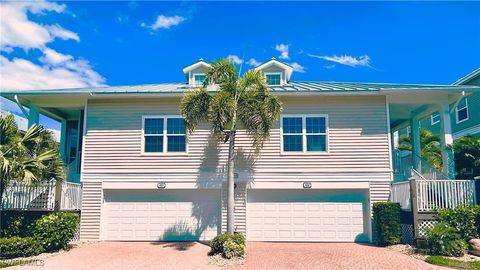
Active
$574,900
2
bds
|
2
ba
|
960
sqft
|
built
2021
340 Pear Tree Ave, Goodland, FL 34140
$-987
Cash flow
-9.0%
Cash-on-Cash Return
4.1%
Cap rate
0.6%
Rent to Value Ratio
9 out of 10 properties for sale in Goodland, FL
Limited Results Shown
Create a free account, or log in to reveal all property listings and enjoy the complete experience.
Active
$2,900,000
6
bds
|
7
ba
|
1,296
sqft
|
built
1969
110 East Ct, Goodland, FL 34140
$-15,161
Cash flow
-27.3%
Cash-on-Cash Return
-0.1%
Cap rate
0.1%
Rent to Value Ratio

Active
$999,000
5
bds
|
4
ba
|
2,319
sqft
|
built
1977
565 Coconut Ave, Goodland, FL 34140
$-1,564
Cash flow
-8.2%
Cash-on-Cash Return
4.3%
Cap rate
0.6%
Rent to Value Ratio

Active
$950,000
2
bds
|
2
ba
|
1,052
sqft
|
built
1958
105 Bayshore Way, Goodland, FL 34140
$-1,893
Cash flow
-10.4%
Cash-on-Cash Return
3.8%
Cap rate
0.5%
Rent to Value Ratio
Active
$889,000
3
bds
|
2
ba
|
1,712
sqft
|
built
2005
318 Angler Dr, Goodland, FL 34140
$-1,277
Cash flow
-7.5%
Cash-on-Cash Return
4.4%
Cap rate
0.6%
Rent to Value Ratio
Active
$1,250,000
4
bds
|
3
ba
|
1,271
sqft
|
built
1977
230 Harbor Pl N, Goodland, FL 34140
$-2,407
Cash flow
-10.0%
Cash-on-Cash Return
3.8%
Cap rate
0.5%
Rent to Value Ratio

Active
$950,000
1
bds
|
1
ba
|
1,060
sqft
|
built
1982
305 Pear Tree Ave, Goodland, FL 34140
$-1,245
Cash flow
-6.8%
Cash-on-Cash Return
4.6%
Cap rate
0.6%
Rent to Value Ratio
Active
$525,000
4
bds
|
3
ba
|
750
sqft
|
built
1964
563 Coconut Ave, Goodland, FL 34140
$-1,635
Cash flow
-16.2%
Cash-on-Cash Return
2.4%
Cap rate
0.4%
Rent to Value Ratio