Grand Rapids, MI Investment Properties for Sale
Browse homes for sale and investment properties in Grand Rapids, MI. Refine your search by price, property type, or more.
Best cash flowing properties in Grand Rapids, MI

Active
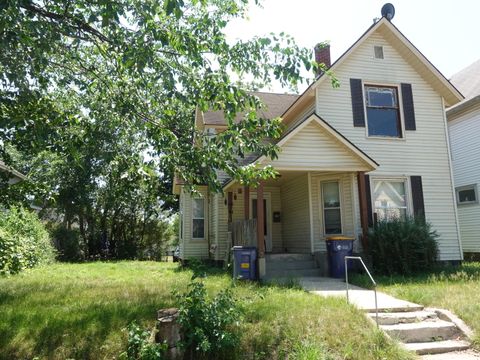
$159,900
2
bds
|
2
ba
|
750
sqft
|
built
1925
1137 Merrifield St SE, Grand Rapids, MI 49507
$314
Cash flow
10.2%
Cash-on-Cash Return
8.6%
Cap rate
1.1%
Rent to Value Ratio
Active
$140,000
bds
|
0
ba
|
0
sqft
|
built
1895
30 La Belle St SW, Grand Rapids, MI 49507
$294
Cash flow
11.0%
Cash-on-Cash Return
8.7%
Cap rate
1.3%
Rent to Value Ratio
234 out of 261 properties for sale in Grand Rapids, MI
Limited Results Shown
Create a free account, or log in to reveal all property listings and enjoy the complete experience.
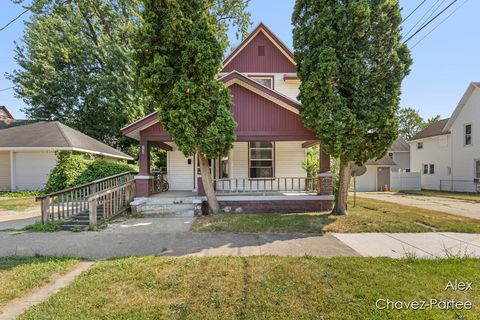
Active
$209,900
6
bds
|
2
ba
|
1,686
sqft
|
built
1908
246 Powell St SE, Grand Rapids, MI 49507
$16
Cash flow
0.4%
Cash-on-Cash Return
6.2%
Cap rate
0.9%
Rent to Value Ratio

Active
$250,000
bds
|
0
ba
|
0
sqft
|
built
1905
318 Diamond Ave SE, Grand Rapids, MI 49506
$-332
Cash flow
-6.9%
Cash-on-Cash Return
4.6%
Cap rate
0.9%
Rent to Value Ratio

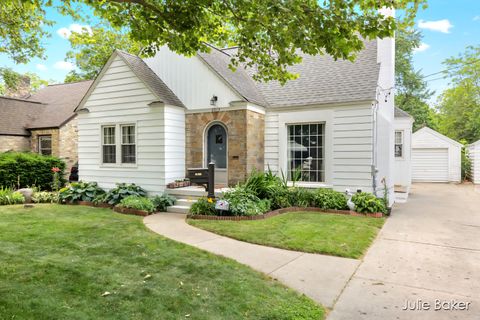
Active
$239,900
4
bds
|
1
ba
|
1,296
sqft
|
built
1900
258 Ann St NE, Grand Rapids, MI 49505
$-88
Cash flow
-1.9%
Cash-on-Cash Return
5.7%
Cap rate
0.8%
Rent to Value Ratio
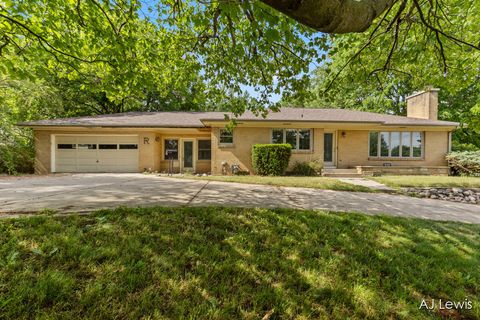
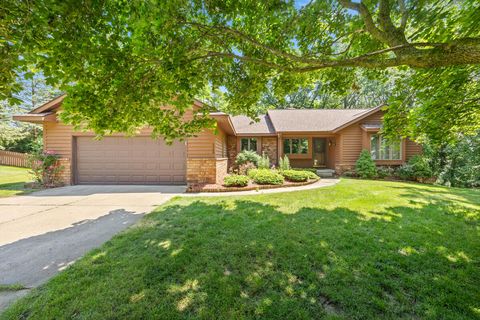
Active
$325,000
3
bds
|
2
ba
|
1,650
sqft
|
built
1952
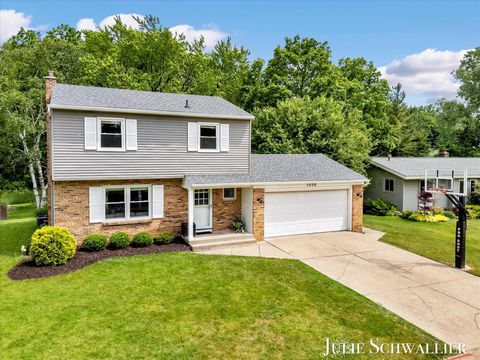
2013 Duiker Ave NE, Grand Rapids, MI 49505
$-364
Cash flow
-5.8%
Cash-on-Cash Return
4.9%
Cap rate
0.7%
Rent to Value Ratio
Active
$299,900
3
bds
|
2
ba
|
2,340
sqft
|
built
1955
2155 Lake Michigan Dr NW, Grand Rapids, MI 49504
$-203
Cash flow
-3.5%
Cash-on-Cash Return
5.5%
Cap rate
0.8%
Rent to Value Ratio
Active
$429,900
4
bds
|
3
ba
|
2,344
sqft
|
built
1985
2360 Montclair Ave NW, Grand Rapids, MI 49544
$-821
Cash flow
-10.0%
Cash-on-Cash Return
4.0%
Cap rate
0.6%
Rent to Value Ratio

Active
$349,900
3
bds
|
2
ba
|
2,073
sqft
|
built
1959
1538 10th St NW, Grand Rapids, MI 49504
$-523
Cash flow
-7.8%
Cash-on-Cash Return
4.5%
Cap rate
0.7%
Rent to Value Ratio

Active
$229,900
4
bds
|
2
ba
|
1,300
sqft
|
built
1900
814 12th St NW, Grand Rapids, MI 49504
$-229
Cash flow
-5.2%
Cash-on-Cash Return
5.1%
Cap rate
0.7%
Rent to Value Ratio
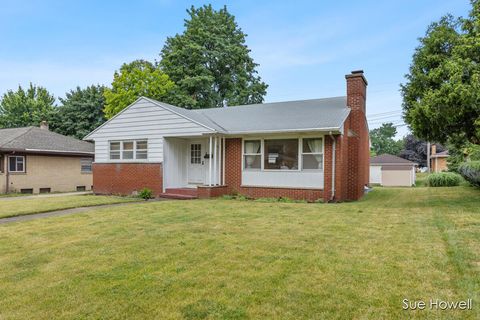
Active
$299,900
3
bds
|
2
ba
|
1,758
sqft
|
built
1956
1547 Edith Ave NE, Grand Rapids, MI 49505
$-380
Cash flow
-6.6%
Cash-on-Cash Return
4.7%
Cap rate
0.7%
Rent to Value Ratio

Active
$389,900
4
bds
|
3
ba
|
2,858
sqft
|
built
1952
630 Westview Ave NW, Grand Rapids, MI 49504
$-724
Cash flow
-9.7%
Cash-on-Cash Return
4.0%
Cap rate
0.6%
Rent to Value Ratio

Active
$599,000
4
bds
|
3
ba
|
2,555
sqft
|
built
2005
2570 Black Horse Ct NE, Grand Rapids, MI 49505
$-1,399
Cash flow
-12.2%
Cash-on-Cash Return
3.5%
Cap rate
0.5%
Rent to Value Ratio
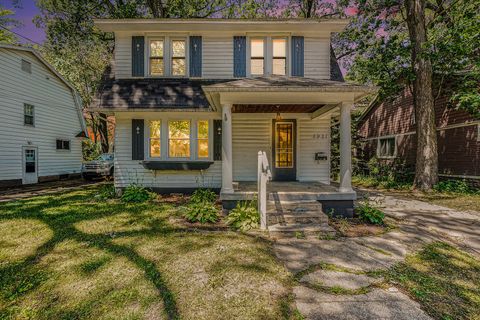
Active
$279,900
4
bds
|
2
ba
|
1,541
sqft
|
built
1927
1921 Cornelius Ave SE, Grand Rapids, MI 49507
$-173
Cash flow
-3.2%
Cash-on-Cash Return
5.5%
Cap rate
0.8%
Rent to Value Ratio

Active
$1,049,000
5
bds
|
4
ba
|
3,900
sqft
|
built
2015
2062 Balsam Waters Ct NE, Grand Rapids, MI 49525
$-3,672
Cash flow
-18.3%
Cash-on-Cash Return
2.1%
Cap rate
0.4%
Rent to Value Ratio
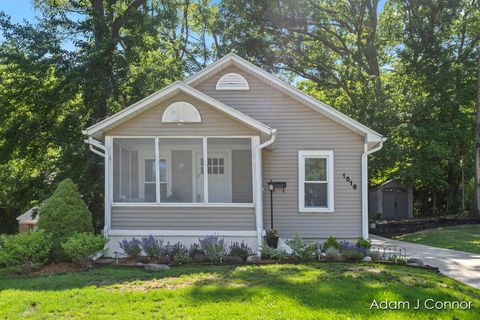
Active
$230,000
2
bds
|
1
ba
|
692
sqft
|
built
1929
1516 Colorado Ave SE, Grand Rapids, MI 49507
$-237
Cash flow
-5.4%
Cash-on-Cash Return
5.0%
Cap rate
0.8%
Rent to Value Ratio

Active
$289,900
3
bds
|
3
ba
|
1,977
sqft
|
built
1987
2149 Ter Van Dr NE, Grand Rapids, MI 49505
$-514
Cash flow
-9.3%
Cash-on-Cash Return
4.1%
Cap rate
0.8%
Rent to Value Ratio
Active
$764,900
4
bds
|
3
ba
|
3,084
sqft
|
built
1950
539 Overbrook Ln SE, Grand Rapids, MI 49507
$-2,162
Cash flow
-14.7%
Cash-on-Cash Return
2.9%
Cap rate
0.4%
Rent to Value Ratio
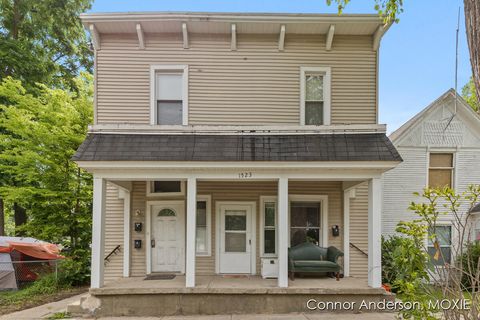
Active
$400,000
bds
|
0
ba
|
0
sqft
|
built
1879
1523 Broadway Ave NW, Grand Rapids, MI 49504
$-773
Cash flow
-10.1%
Cash-on-Cash Return
3.9%
Cap rate
0.5%
Rent to Value Ratio
Active
$306,000
2
bds
|
2
ba
|
1,332
sqft
|
built
2018
2005 Celadon Dr NE, Grand Rapids, MI 49525
$-507
Cash flow
-8.6%
Cash-on-Cash Return
4.2%
Cap rate
0.8%
Rent to Value Ratio

Active
$219,900
2
bds
|
1
ba
|
864
sqft
|
built
1927
1835 Thelma Ave SE, Grand Rapids, MI 49507
$-262
Cash flow
-6.2%
Cash-on-Cash Return
4.8%
Cap rate
0.7%
Rent to Value Ratio
Active
$199,900
3
bds
|
1
ba
|
1,250
sqft
|
built
1922
1101 Bemis St SE, Grand Rapids, MI 49506
$-5,785
Cash flow
-151.0%
Cash-on-Cash Return
-28.5%
Cap rate
0.9%
Rent to Value Ratio
Active
$379,000
3
bds
|
2
ba
|
1,653
sqft
|
built
1968
1038 N Hampton Dr NE, Grand Rapids, MI 49505
$-647
Cash flow
-8.9%
Cash-on-Cash Return
4.2%
Cap rate
0.6%
Rent to Value Ratio

Active
$369,900
4
bds
|
2
ba
|
1,672
sqft
|
built
1971
6094 Del Cano Dr SE, Grand Rapids, MI 49546
$-356
Cash flow
-5.0%
Cash-on-Cash Return
5.0%
Cap rate
0.7%
Rent to Value Ratio

Active
$349,900
3
bds
|
1
ba
|
1,898
sqft
|
built
1960
3435 Newcastle Dr SE, Grand Rapids, MI 49508
$-602
Cash flow
-9.0%
Cash-on-Cash Return
4.2%
Cap rate
0.7%
Rent to Value Ratio

Active
$365,000
4
bds
|
2
ba
|
1,478
sqft
|
built
1985
2698 Dunnigan Ave NE, Grand Rapids, MI 49525
$-450
Cash flow
-6.4%
Cash-on-Cash Return
4.8%
Cap rate
0.7%
Rent to Value Ratio

Active
$299,000
4
bds
|
2
ba
|
1,917
sqft
|
built
1908
109 Fuller Ave SE, Grand Rapids, MI 49506
$-335
Cash flow
-5.8%
Cash-on-Cash Return
4.8%
Cap rate
0.7%
Rent to Value Ratio

Active
$254,900
2
bds
|
2
ba
|
1,458
sqft
|
built
1988
650 Bradford Pl NE, Grand Rapids, MI 49525
$-635
Cash flow
-13.0%
Cash-on-Cash Return
3.3%
Cap rate
0.7%
Rent to Value Ratio
Active
$580,000
4
bds
|
3
ba
|
1,981
sqft
|
built
1926
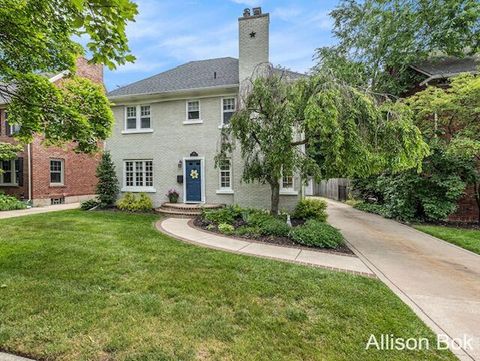
828 Cadillac Dr SE, Grand Rapids, MI 49506
$-1,185
Cash flow
-10.7%
Cash-on-Cash Return
3.8%
Cap rate
0.5%
Rent to Value Ratio

Active
$6,800,000
5
bds
|
9
ba
|
11,652
sqft
|
built
1995
1995 San Lu Rae Dr SE, Grand Rapids, MI 49506
$-39,833
Cash flow
-30.6%
Cash-on-Cash Return
-0.8%
Cap rate
0.1%
Rent to Value Ratio
Active
$374,900
3
bds
|
2
ba
|
2,064
sqft
|
built
1885
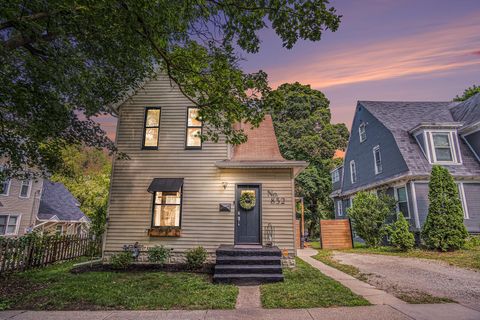
832 Clancy Ave NE, Grand Rapids, MI 49503
$-691
Cash flow
-9.6%
Cash-on-Cash Return
4.1%
Cap rate
0.6%
Rent to Value Ratio

Active
$309,900
1
bds
|
2
ba
|
1,110
sqft
|
built
1880
600 Monroe Ave NW, Grand Rapids, MI 49503
$-979
Cash flow
-16.5%
Cash-on-Cash Return
2.5%
Cap rate
0.7%
Rent to Value Ratio

Active
$564,000
5
bds
|
4
ba
|
3,136
sqft
|
built
1959
1657 W Kentview Dr NE, Grand Rapids, MI 49505
$-1,753
Cash flow
-16.2%
Cash-on-Cash Return
2.5%
Cap rate
0.4%
Rent to Value Ratio
Active
$2,445,000
4
bds
|
5
ba
|
7,228
sqft
|
built
1987
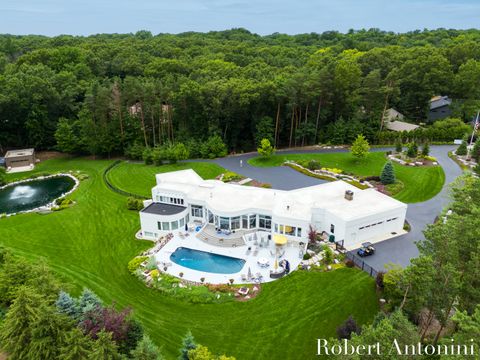
1835 Linson Ct SE, Grand Rapids, MI 49546
$-8,132
Cash flow
-17.4%
Cash-on-Cash Return
2.3%
Cap rate
0.3%
Rent to Value Ratio

Active
$734,900
5
bds
|
4
ba
|
3,729
sqft
|
built
1975
2605 Shadowbrook Dr SE, Grand Rapids, MI 49546
$-1,734
Cash flow
-12.3%
Cash-on-Cash Return
3.4%
Cap rate
0.5%
Rent to Value Ratio
Active
$400,000
3
bds
|
2
ba
|
1,916
sqft
|
built
1955
6449 Wendell St SE, Grand Rapids, MI 49546
$-778
Cash flow
-10.1%
Cash-on-Cash Return
3.9%
Cap rate
0.6%
Rent to Value Ratio
Active
$350,000
3
bds
|
2
ba
|
1,392
sqft
|
built
1950
2036 Dawson Ave NE, Grand Rapids, MI 49505
$-388
Cash flow
-5.8%
Cash-on-Cash Return
4.9%
Cap rate
0.7%
Rent to Value Ratio

Active
$650,000
bds
|
0
ba
|
0
sqft
|
built
1875
345 Paris Ave SE, Grand Rapids, MI 49503
$-1,986
Cash flow
-15.9%
Cash-on-Cash Return
2.6%
Cap rate
0.4%
Rent to Value Ratio

Active
$314,900
4
bds
|
2
ba
|
1,646
sqft
|
built
1890
143 Houseman Ave NE, Grand Rapids, MI 49503
$-486
Cash flow
-8.1%
Cash-on-Cash Return
4.4%
Cap rate
0.7%
Rent to Value Ratio
Active
$899,000
3
bds
|
2
ba
|
1,500
sqft
|
built
1964
2647 Manitoba Ct NE, Grand Rapids, MI 49525
$-3,287
Cash flow
-19.1%
Cash-on-Cash Return
1.9%
Cap rate
0.3%
Rent to Value Ratio