Grand Rapids, MI Investment Properties for Sale
Browse homes for sale and investment properties in Grand Rapids, MI. Refine your search by price, property type, or more.
Best cash flowing properties in Grand Rapids, MI
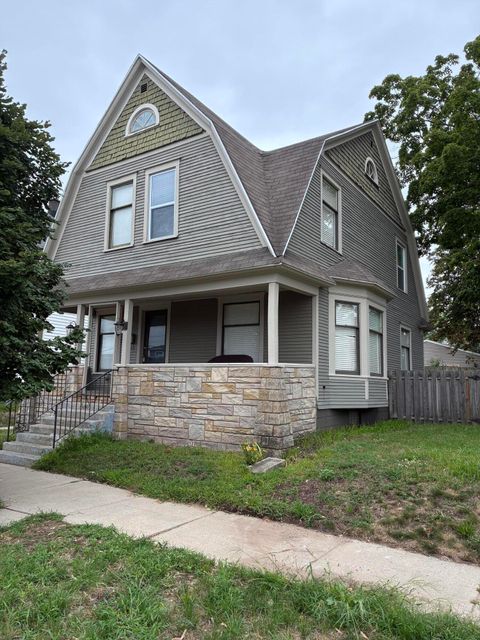
Active
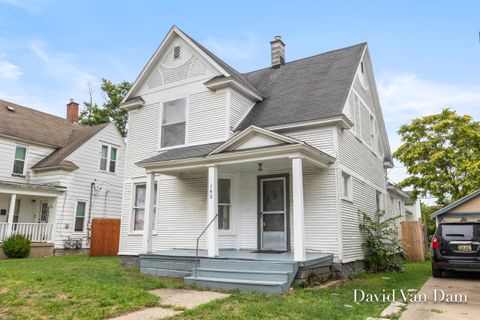
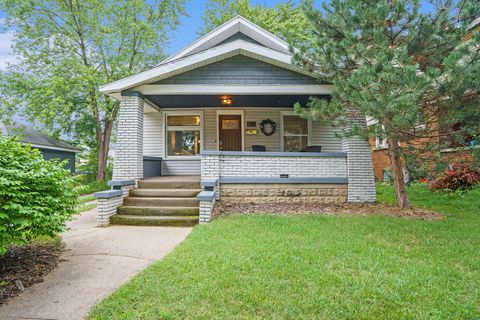
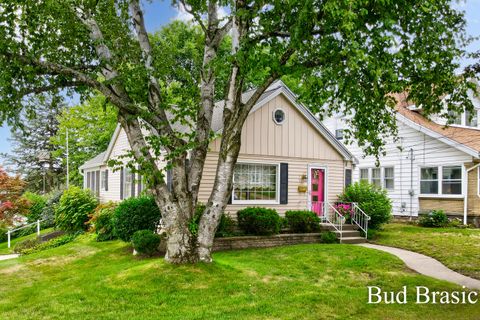
$199,900
4
bds
|
1
ba
|
1,462
sqft
|
built
1895
140 Stewart St SW, Grand Rapids, MI 49507
$101
Cash flow
2.6%
Cash-on-Cash Return
6.8%
Cap rate
0.9%
Rent to Value Ratio
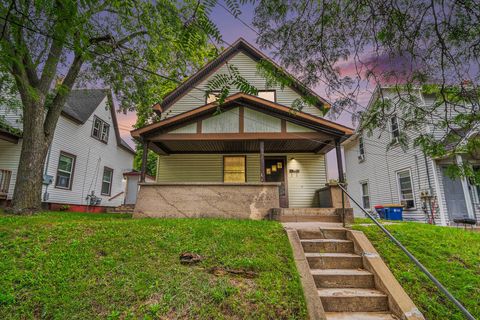
Active
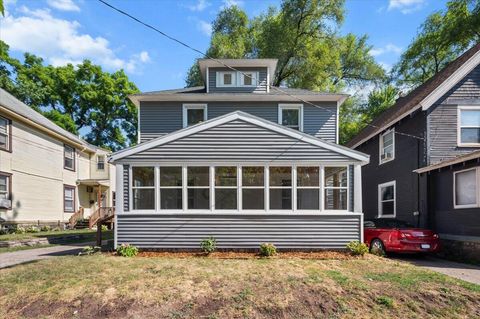
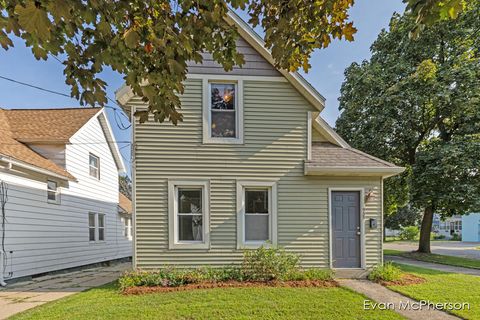
$209,900
3
bds
|
2
ba
|
1,155
sqft
|
built
1910
937 Humbolt St SE, Grand Rapids, MI 49507
$75
Cash flow
1.9%
Cash-on-Cash Return
6.6%
Cap rate
0.9%
Rent to Value Ratio
338 out of 374 properties for sale in Grand Rapids, MI
Limited Results Shown
Create a free account, or log in to reveal all property listings and enjoy the complete experience.
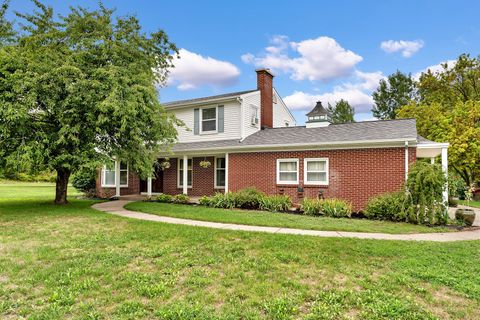
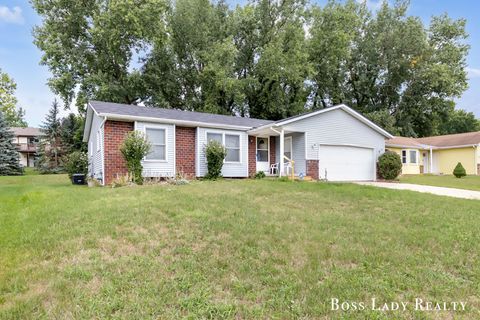
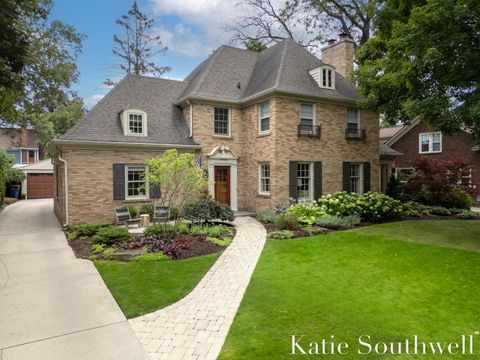
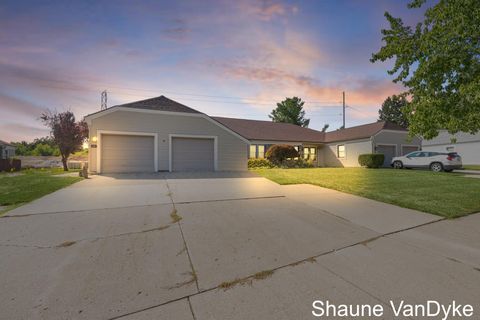
Active
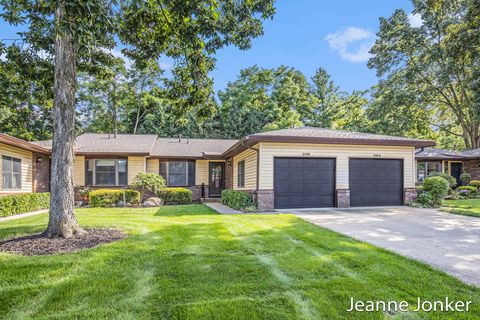
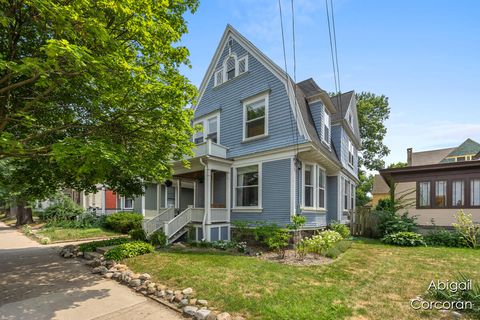
$458,000
4
bds
|
3
ba
|
2,820
sqft
|
built
1961
319 Greenridge Dr NW, Grand Rapids, MI 49544
$-846
Cash flow
-9.6%
Cash-on-Cash Return
3.9%
Cap rate
0.6%
Rent to Value Ratio
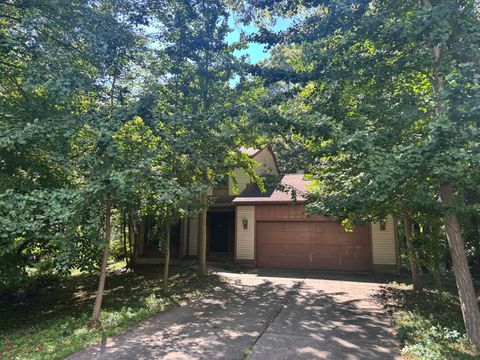
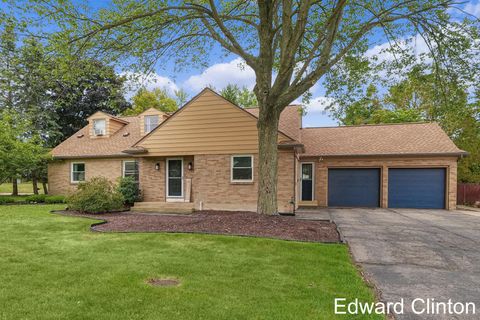
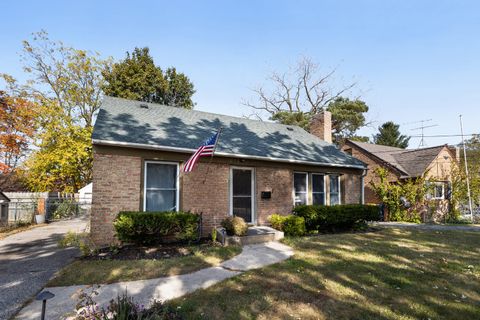
Active
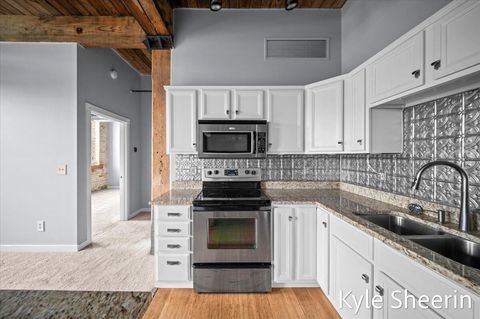
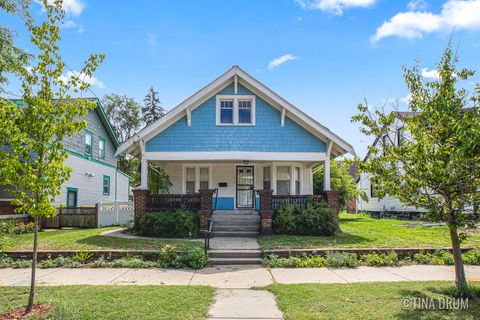
$379,000
3
bds
|
2
ba
|
1,416
sqft
|
built
1987
1131 Fernridge Ave SE, Grand Rapids, MI 49546
$-255
Cash flow
-3.5%
Cash-on-Cash Return
5.3%
Cap rate
0.7%
Rent to Value Ratio

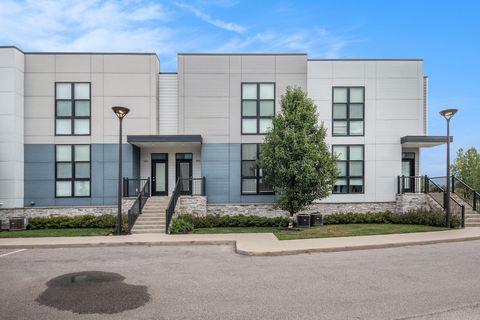
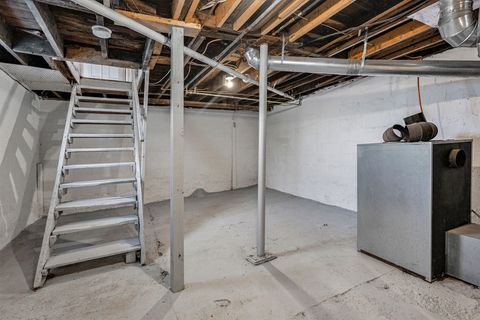
Active
$275,000
3
bds
|
1
ba
|
1,145
sqft
|
built
1952
1659 Mason St NE, Grand Rapids, MI 49503
$-308
Cash flow
-5.8%
Cash-on-Cash Return
4.8%
Cap rate
0.7%
Rent to Value Ratio
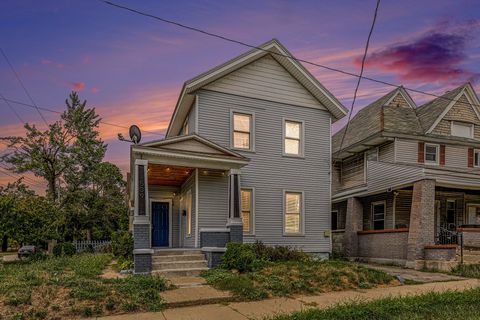
Active
$279,900
3
bds
|
2
ba
|
1,210
sqft
|
built
1983
1821 32nd St SE, Grand Rapids, MI 49508
$-73
Cash flow
-1.4%
Cash-on-Cash Return
5.8%
Cap rate
0.8%
Rent to Value Ratio
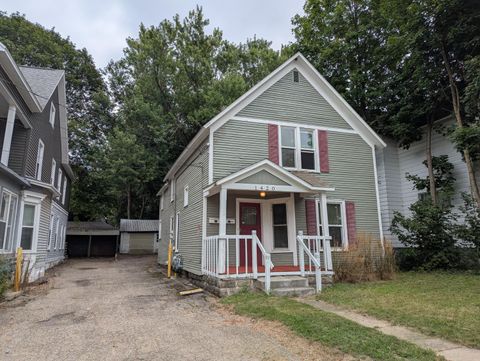
Active
$299,000
bds
|
0
ba
|
0
sqft
|
built
1890
1420 Buffalo Ave NE, Grand Rapids, MI 49505
$-555
Cash flow
-9.7%
Cash-on-Cash Return
3.9%
Cap rate
0.5%
Rent to Value Ratio
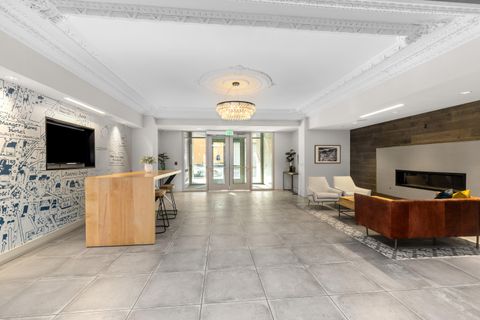
Active
$439,900
2
bds
|
2
ba
|
1,211
sqft
|
built
1921
201 Michigan St NW, Grand Rapids, MI 49503
$-1,326
Cash flow
-15.7%
Cash-on-Cash Return
2.5%
Cap rate
0.8%
Rent to Value Ratio
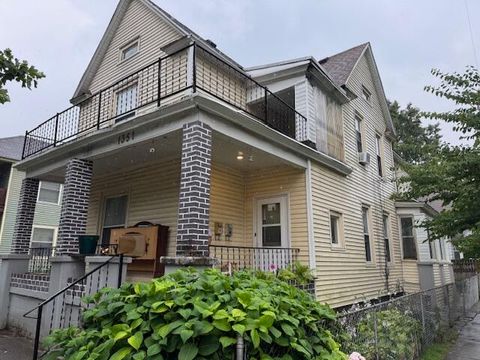
Active
$274,900
bds
|
0
ba
|
0
sqft
|
built
1895
1351 Hamilton Ave NW, Grand Rapids, MI 49504
$-214
Cash flow
-4.1%
Cash-on-Cash Return
5.2%
Cap rate
0.7%
Rent to Value Ratio
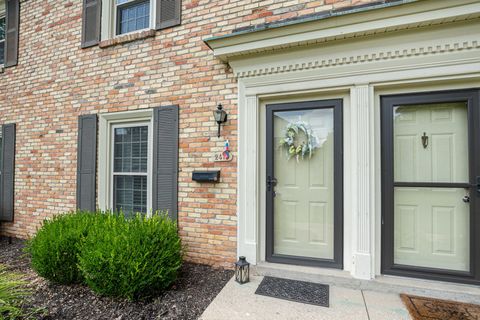
Active
$240,000
2
bds
|
2
ba
|
1,036
sqft
|
built
1967
2470 Abbington Dr SE, Grand Rapids, MI 49506
$-558
Cash flow
-12.1%
Cash-on-Cash Return
3.4%
Cap rate
0.8%
Rent to Value Ratio
Active
$515,000
4
bds
|
4
ba
|
2,196
sqft
|
built
1994
3750 Benjamin Ave NE, Grand Rapids, MI 49525
$-1,806
Cash flow
-18.3%
Cash-on-Cash Return
1.9%
Cap rate
0.3%
Rent to Value Ratio
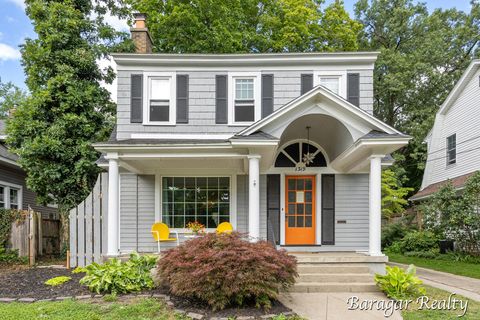
Active
$360,000
3
bds
|
2
ba
|
1,485
sqft
|
built
1934
1319 Allerton Ave SE, Grand Rapids, MI 49506
$-431
Cash flow
-6.2%
Cash-on-Cash Return
4.7%
Cap rate
0.6%
Rent to Value Ratio
Active
$295,000
3
bds
|
3
ba
|
2,214
sqft
|
built
1930
104 Colrain St SE, Grand Rapids, MI 49548
$-127
Cash flow
-2.2%
Cash-on-Cash Return
5.6%
Cap rate
0.8%
Rent to Value Ratio
Active
$270,000
2
bds
|
2
ba
|
1,424
sqft
|
built
1923
941 Arianna St NW, Grand Rapids, MI 49504
$-222
Cash flow
-4.3%
Cash-on-Cash Return
5.2%
Cap rate
0.7%
Rent to Value Ratio
Active
$280,000
4
bds
|
0
ba
|
0
sqft
|
built
1900
1125 Thomas St SE, Grand Rapids, MI 49506
$-408
Cash flow
-7.6%
Cash-on-Cash Return
4.4%
Cap rate
0.8%
Rent to Value Ratio
Active
$279,900
2
bds
|
2
ba
|
1,072
sqft
|
built
1989
2156 Ter Van Dr NE, Grand Rapids, MI 49505
$-1,097
Cash flow
-20.4%
Cash-on-Cash Return
1.4%
Cap rate
0.6%
Rent to Value Ratio

Active
$749,600
6
bds
|
4
ba
|
4,673
sqft
|
built
1990
2331 Westwinde Ct NW, Grand Rapids, MI 49504
$-1,889
Cash flow
-13.1%
Cash-on-Cash Return
3.1%
Cap rate
0.5%
Rent to Value Ratio

Active
$324,000
3
bds
|
2
ba
|
1,919
sqft
|
built
1941
1613 Margaret Ave SE, Grand Rapids, MI 49507
$-389
Cash flow
-6.3%
Cash-on-Cash Return
4.7%
Cap rate
0.7%
Rent to Value Ratio
Active
$349,900
2
bds
|
1
ba
|
1,164
sqft
|
built
1893
940 Monroe Ave NW, Grand Rapids, MI 49503
$-1,367
Cash flow
-20.4%
Cash-on-Cash Return
1.5%
Cap rate
0.6%
Rent to Value Ratio
Active
$319,000
3
bds
|
2
ba
|
1,619
sqft
|
built
1951
952 Frederick Ave NW, Grand Rapids, MI 49504
$-468
Cash flow
-7.7%
Cash-on-Cash Return
4.4%
Cap rate
0.6%
Rent to Value Ratio
Active
$239,900
3
bds
|
1
ba
|
1,155
sqft
|
built
1890
935 Watson St SW, Grand Rapids, MI 49504
$10
Cash flow
0.2%
Cash-on-Cash Return
6.2%
Cap rate
0.8%
Rent to Value Ratio

Active
$227,000
2
bds
|
1
ba
|
936
sqft
|
built
1950
71 Jonquil St SW, Grand Rapids, MI 49548
$-94
Cash flow
-2.2%
Cash-on-Cash Return
5.7%
Cap rate
0.8%
Rent to Value Ratio

Active
$420,000
4
bds
|
3
ba
|
2,510
sqft
|
built
1964
583 Kingsbury St NW, Grand Rapids, MI 49544
$-858
Cash flow
-10.7%
Cash-on-Cash Return
3.7%
Cap rate
0.5%
Rent to Value Ratio

Active
$800,000
4
bds
|
3
ba
|
2,712
sqft
|
built
1956
1825 Meadowfield Dr NE, Grand Rapids, MI 49505
$-2,451
Cash flow
-16.0%
Cash-on-Cash Return
2.5%
Cap rate
0.4%
Rent to Value Ratio
Active
$650,000
4
bds
|
3
ba
|
2,551
sqft
|
built
1900
708 Cherry St SE, Grand Rapids, MI 49503
$-1,667
Cash flow
-13.4%
Cash-on-Cash Return
3.1%
Cap rate
0.5%
Rent to Value Ratio
Active
$225,000
3
bds
|
1
ba
|
986
sqft
|
built
1922
1010 Oakdale St SE, Grand Rapids, MI 49507
$-54
Cash flow
-1.3%
Cash-on-Cash Return
5.9%
Cap rate
0.8%
Rent to Value Ratio
Active
$259,900
3
bds
|
2
ba
|
1,378
sqft
|
built
1905
614 Sheldon Ave SE, Grand Rapids, MI 49503
$-252
Cash flow
-5.1%
Cash-on-Cash Return
5.0%
Cap rate
0.7%
Rent to Value Ratio
Active
$1,585,000
4
bds
|
4
ba
|
3,672
sqft
|
built
1929
958 Pinecrest Ave SE, Grand Rapids, MI 49506
$-6,602
Cash flow
-21.7%
Cash-on-Cash Return
1.1%
Cap rate
0.3%
Rent to Value Ratio
Active
$475,000
5
bds
|
4
ba
|
3,737
sqft
|
built
1954
2024 7th St NW, Grand Rapids, MI 49504
$-871
Cash flow
-9.6%
Cash-on-Cash Return
3.9%
Cap rate
0.6%
Rent to Value Ratio
Active
$324,900
3
bds
|
3
ba
|
1,542
sqft
|
built
2020
6028 Port View Dr SE, Grand Rapids, MI 49512
$-623
Cash flow
-10.0%
Cash-on-Cash Return
3.8%
Cap rate
0.8%
Rent to Value Ratio

Active
$425,000
3
bds
|
2
ba
|
2,904
sqft
|
built
1976
4847 Ridgeline Dr NE, Grand Rapids, MI 49525
$-819
Cash flow
-10.1%
Cash-on-Cash Return
3.8%
Cap rate
0.6%
Rent to Value Ratio
Active
$235,000
1
bds
|
2
ba
|
980
sqft
|
built
1984
331 Rolling Greene Dr NW, Grand Rapids, MI 49534
$-788
Cash flow
-17.5%
Cash-on-Cash Return
2.1%
Cap rate
0.6%
Rent to Value Ratio

Active
$319,900
3
bds
|
2
ba
|
1,685
sqft
|
built
1925
1248 Fisk Rd SE, Grand Rapids, MI 49506
$-289
Cash flow
-4.7%
Cash-on-Cash Return
5.1%
Cap rate
0.8%
Rent to Value Ratio
Active
$349,900
3
bds
|
1
ba
|
1,241
sqft
|
built
1951
1813 Kreiser St SE, Grand Rapids, MI 49506
$-413
Cash flow
-6.2%
Cash-on-Cash Return
4.7%
Cap rate
0.7%
Rent to Value Ratio

Active
$950,000
4
bds
|
4
ba
|
3,589
sqft
|
built
1915
415 Prospect Ave SE, Grand Rapids, MI 49503
$-3,600
Cash flow
-19.8%
Cash-on-Cash Return
1.6%
Cap rate
0.3%
Rent to Value Ratio

Active
$775,000
4
bds
|
3
ba
|
2,693
sqft
|
built
2015
4307 Maybeck Dr NE, Grand Rapids, MI 49525
$-3,218
Cash flow
-21.7%
Cash-on-Cash Return
1.2%
Cap rate
0.4%
Rent to Value Ratio

Active
$349,900
3
bds
|
2
ba
|
1,022
sqft
|
built
1900
656 Gladstone Dr SE, Grand Rapids, MI 49506
$-677
Cash flow
-10.1%
Cash-on-Cash Return
3.8%
Cap rate
0.6%
Rent to Value Ratio
Active
$224,900
5
bds
|
0
ba
|
0
sqft
|
built
1922
26 Hall St SW, Grand Rapids, MI 49507
$-144
Cash flow
-3.3%
Cash-on-Cash Return
5.4%
Cap rate
0.8%
Rent to Value Ratio
Active
$229,000
bds
|
0
ba
|
0
sqft
|
built
1890
539 Pine Ave NW, Grand Rapids, MI 49504
$-154
Cash flow
-3.5%
Cash-on-Cash Return
5.3%
Cap rate
0.8%
Rent to Value Ratio
Active
$449,900
4
bds
|
3
ba
|
2,912
sqft
|
built
1951
1440 Holborn Dr NW, Grand Rapids, MI 49504
$-619
Cash flow
-7.2%
Cash-on-Cash Return
4.5%
Cap rate
0.7%
Rent to Value Ratio