Grand Rapids, MI Investment Properties for Sale
Browse homes for sale and investment properties in Grand Rapids, MI. Refine your search by price, property type, or more.
Best cash flowing properties in Grand Rapids, MI

Active
$129,900
2
bds
|
1
ba
|
806
sqft
|
built
1912
427 Highland St SE, Grand Rapids, MI 49507
$245
Cash flow
9.8%
Cash-on-Cash Return
8.5%
Cap rate
1.1%
Rent to Value Ratio

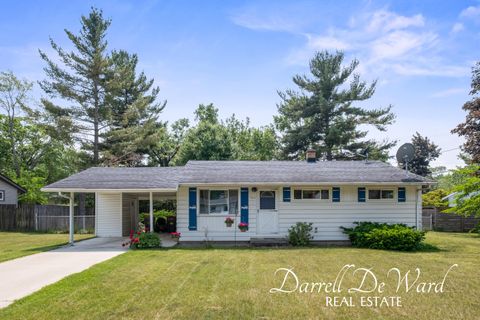
Active
$169,900
3
bds
|
2
ba
|
1,096
sqft
|
built
1910
1228 Quarry Ave NW, Grand Rapids, MI 49504
$125
Cash flow
3.8%
Cash-on-Cash Return
7.1%
Cap rate
0.9%
Rent to Value Ratio
242 out of 270 properties for sale in Grand Rapids, MI
Limited Results Shown
Create a free account, or log in to reveal all property listings and enjoy the complete experience.
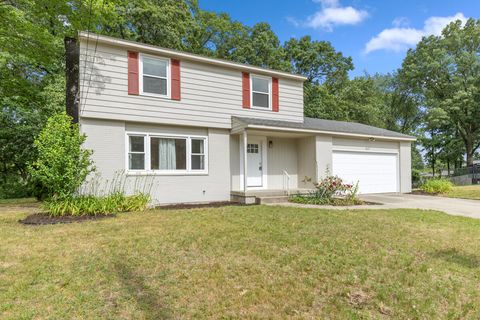
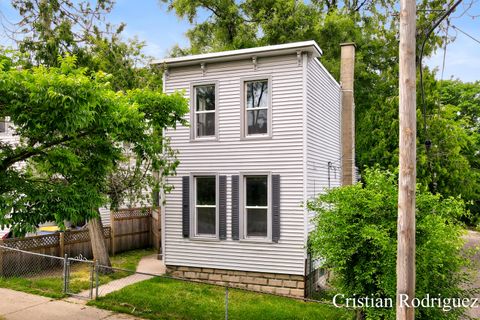
Active
$899,000
3
bds
|
2
ba
|
1,500
sqft
|
built
1964
2647 Manitoba Ct NE, Grand Rapids, MI 49525
$-3,287
Cash flow
-19.1%
Cash-on-Cash Return
1.9%
Cap rate
0.3%
Rent to Value Ratio
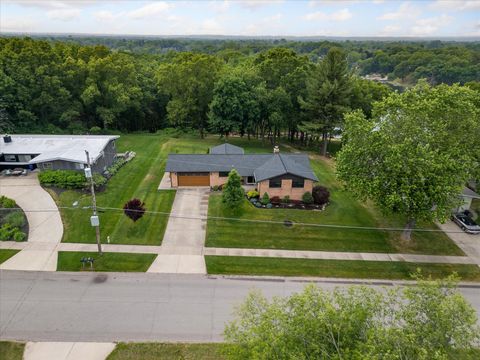
Active
$244,900
3
bds
|
2
ba
|
1,744
sqft
|
built
1968
4164 E Saxony Dr SE, Grand Rapids, MI 49508
$-2,842
Cash flow
-60.5%
Cash-on-Cash Return
-7.7%
Cap rate
0.7%
Rent to Value Ratio

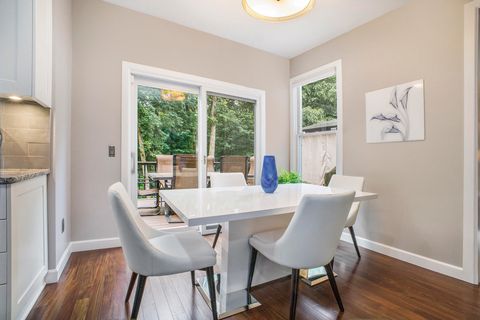
Active
$295,000
2
bds
|
1
ba
|
1,028
sqft
|
built
1990
3342 Woodwind Dr NE, Grand Rapids, MI 49525
$-858
Cash flow
-15.2%
Cash-on-Cash Return
2.8%
Cap rate
0.7%
Rent to Value Ratio
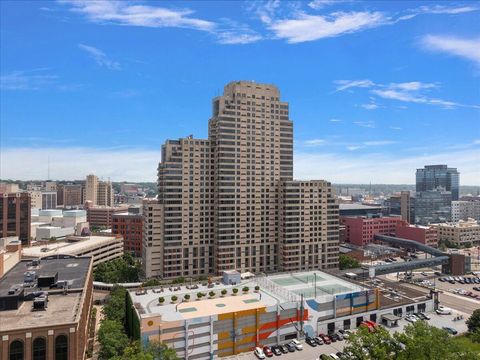
Active
$459,900
2
bds
|
2
ba
|
1,314
sqft
|
built
1990
43 Campau Cir NW, Grand Rapids, MI 49503
$-1,797
Cash flow
-20.4%
Cash-on-Cash Return
1.6%
Cap rate
0.7%
Rent to Value Ratio
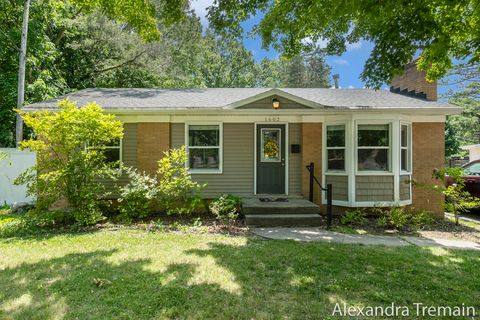
Active
$375,000
3
bds
|
2
ba
|
1,843
sqft
|
built
1966
1602 4th St NW, Grand Rapids, MI 49504
$-953
Cash flow
-13.3%
Cash-on-Cash Return
3.1%
Cap rate
0.5%
Rent to Value Ratio
Active
$150,000
2
bds
|
1
ba
|
823
sqft
|
built
1970
2623 Ridgecroft Dr SE, Grand Rapids, MI 49546
$-269,997
Cash flow
-9391.2%
Cash-on-Cash Return
-2153.7%
Cap rate
0.9%
Rent to Value Ratio
Active
$300,000
3
bds
|
3
ba
|
1,832
sqft
|
built
1964
1136 3 Mile Rd NW, Grand Rapids, MI 49544
$-212
Cash flow
-3.7%
Cash-on-Cash Return
5.4%
Cap rate
0.7%
Rent to Value Ratio
Active
$339,900
3
bds
|
1
ba
|
1,393
sqft
|
built
1946
1426 Lancashire Dr SE, Grand Rapids, MI 49508
$-297
Cash flow
-4.6%
Cash-on-Cash Return
5.1%
Cap rate
0.7%
Rent to Value Ratio

Active
$365,000
3
bds
|
2
ba
|
2,002
sqft
|
built
1969
6144 Del Cano Dr SE, Grand Rapids, MI 49546
$-695
Cash flow
-9.9%
Cash-on-Cash Return
4.0%
Cap rate
0.6%
Rent to Value Ratio
Active
$165,000
3
bds
|
1
ba
|
1,424
sqft
|
built
1973
3903 Willow Dr NE, Grand Rapids, MI 49525
$-23
Cash flow
-0.7%
Cash-on-Cash Return
6.1%
Cap rate
1.0%
Rent to Value Ratio
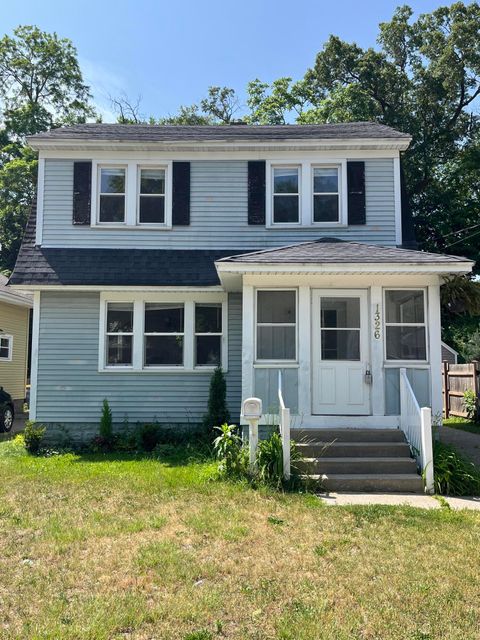
Active
$249,900
4
bds
|
2
ba
|
1,336
sqft
|
built
1929
1326 Dickinson St SE, Grand Rapids, MI 49507
$-216
Cash flow
-4.5%
Cash-on-Cash Return
5.2%
Cap rate
0.8%
Rent to Value Ratio

Active
$365,000
2
bds
|
3
ba
|
1,309
sqft
|
built
2021
2519 Inverness Rd SE, Grand Rapids, MI 49546
$-704
Cash flow
-10.1%
Cash-on-Cash Return
4.0%
Cap rate
0.8%
Rent to Value Ratio

Active
$325,000
3
bds
|
2
ba
|
1,870
sqft
|
built
2003
2663 Weatherby Hills Dr SE, Grand Rapids, MI 49546
$-769
Cash flow
-12.3%
Cash-on-Cash Return
3.3%
Cap rate
0.7%
Rent to Value Ratio
Active
$369,900
4
bds
|
2
ba
|
1,968
sqft
|
built
1913
1328 Bemis St SE, Grand Rapids, MI 49506
$-555
Cash flow
-7.8%
Cash-on-Cash Return
4.5%
Cap rate
0.7%
Rent to Value Ratio

Active
$354,900
3
bds
|
2
ba
|
1,800
sqft
|
built
2000
1300 Lancaster Ave NW, Grand Rapids, MI 49504
$-859
Cash flow
-12.6%
Cash-on-Cash Return
3.4%
Cap rate
0.6%
Rent to Value Ratio
Active
$175,000
2
bds
|
1
ba
|
982
sqft
|
built
1905
1116 Atlantic St NW, Grand Rapids, MI 49504
$89
Cash flow
2.7%
Cash-on-Cash Return
6.9%
Cap rate
0.9%
Rent to Value Ratio

Active
$280,000
3
bds
|
3
ba
|
1,716
sqft
|
built
2001
5923 E Lyn Haven Dr SE, Grand Rapids, MI 49512
$-595
Cash flow
-11.1%
Cash-on-Cash Return
3.7%
Cap rate
0.8%
Rent to Value Ratio
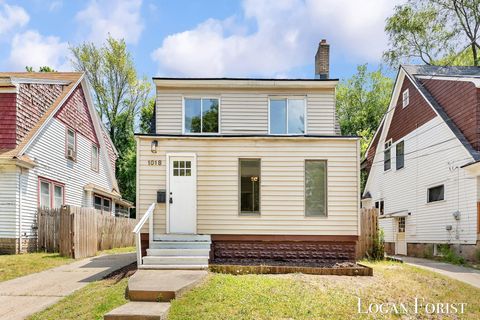
Active
$289,900
3
bds
|
3
ba
|
1,783
sqft
|
built
1926
1018 Cooper Ave SE, Grand Rapids, MI 49507
$-616
Cash flow
-11.1%
Cash-on-Cash Return
3.7%
Cap rate
0.7%
Rent to Value Ratio
Active
$275,000
3
bds
|
1
ba
|
1,062
sqft
|
built
1954
968 Kendalwood St NE, Grand Rapids, MI 49505
$-350
Cash flow
-6.6%
Cash-on-Cash Return
4.7%
Cap rate
0.7%
Rent to Value Ratio

Active
$1,150,000
4
bds
|
5
ba
|
4,135
sqft
|
built
1922
60 Lafayette Ave NE, Grand Rapids, MI 49503
$-3,983
Cash flow
-18.1%
Cash-on-Cash Return
2.1%
Cap rate
0.3%
Rent to Value Ratio
Active
$235,000
3
bds
|
1
ba
|
1,083
sqft
|
built
1885
243 Fairbanks St NE, Grand Rapids, MI 49503
$-446
Cash flow
-9.9%
Cash-on-Cash Return
4.0%
Cap rate
0.7%
Rent to Value Ratio

Active
$329,000
4
bds
|
2
ba
|
2,142
sqft
|
built
1929
2432 Madison Ave SE, Grand Rapids, MI 49507
$-312
Cash flow
-4.9%
Cash-on-Cash Return
5.1%
Cap rate
0.8%
Rent to Value Ratio

Active
$425,000
4
bds
|
4
ba
|
2,596
sqft
|
built
1981
2394 Cedar Crest Dr NE, Grand Rapids, MI 49525
$-1,018
Cash flow
-12.5%
Cash-on-Cash Return
3.4%
Cap rate
0.5%
Rent to Value Ratio
Active
$849,900
4
bds
|
3
ba
|
2,283
sqft
|
built
1966
3801 Keeweenaw Dr NE, Grand Rapids, MI 49525
$-2,864
Cash flow
-17.6%
Cash-on-Cash Return
2.1%
Cap rate
0.3%
Rent to Value Ratio
Active
$750,000
4
bds
|
3
ba
|
2,530
sqft
|
built
2000
3817 Goodwood Dr SE, Grand Rapids, MI 49546
$-1,974
Cash flow
-13.7%
Cash-on-Cash Return
3.1%
Cap rate
0.5%
Rent to Value Ratio

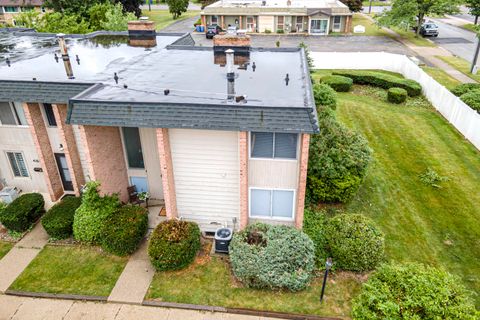
Active
$345,000
1
bds
|
2
ba
|
1,060
sqft
|
built
1990
79 Campau Cir NW, Grand Rapids, MI 49503
$-1,181
Cash flow
-17.9%
Cash-on-Cash Return
2.2%
Cap rate
0.8%
Rent to Value Ratio

Active
$484,900
4
bds
|
2
ba
|
2,275
sqft
|
built
1925
3544 Briggs Blvd NE, Grand Rapids, MI 49525
$-1,064
Cash flow
-11.4%
Cash-on-Cash Return
3.6%
Cap rate
0.5%
Rent to Value Ratio

Active
$524,900
4
bds
|
3
ba
|
2,652
sqft
|
built
1953
1142 Orchard Ave SE, Grand Rapids, MI 49506
$-1,207
Cash flow
-12.0%
Cash-on-Cash Return
3.5%
Cap rate
0.6%
Rent to Value Ratio

Active
$317,000
4
bds
|
2
ba
|
1,280
sqft
|
built
1925
258 Richards Ave SW, Grand Rapids, MI 49504
$-451
Cash flow
-7.4%
Cash-on-Cash Return
4.6%
Cap rate
0.7%
Rent to Value Ratio

Active
$375,000
2
bds
|
3
ba
|
2,594
sqft
|
built
1986
6555 Waybridge Dr SE, Grand Rapids, MI 49546
$-1,068
Cash flow
-14.9%
Cash-on-Cash Return
2.8%
Cap rate
0.7%
Rent to Value Ratio

Active
$325,000
3
bds
|
3
ba
|
1,996
sqft
|
built
1995
1410 Windcrest Ln NE, Grand Rapids, MI 49525
$-904
Cash flow
-14.5%
Cash-on-Cash Return
2.9%
Cap rate
0.7%
Rent to Value Ratio

Active
$299,000
bds
|
0
ba
|
0
sqft
|
built
1890
635 Sinclair Ave NE, Grand Rapids, MI 49503
$-793
Cash flow
-13.8%
Cash-on-Cash Return
3.1%
Cap rate
0.5%
Rent to Value Ratio

Active
$344,900
3
bds
|
2
ba
|
2,109
sqft
|
built
1925
1248 Fisk Rd SE, Grand Rapids, MI 49506
$-451
Cash flow
-6.8%
Cash-on-Cash Return
4.7%
Cap rate
0.7%
Rent to Value Ratio

Active
$800,000
4
bds
|
3
ba
|
2,974
sqft
|
built
1963
1757 Westlane Dr NE, Grand Rapids, MI 49505
$-2,305
Cash flow
-15.0%
Cash-on-Cash Return
2.8%
Cap rate
0.4%
Rent to Value Ratio
Active
$795,000
4
bds
|
3
ba
|
2,803
sqft
|
built
1885
3 Woodward Ln SE, Grand Rapids, MI 49506
$-2,769
Cash flow
-18.2%
Cash-on-Cash Return
2.1%
Cap rate
0.3%
Rent to Value Ratio

Active
$334,500
3
bds
|
2
ba
|
1,548
sqft
|
built
1930
238 Richards Ave SW, Grand Rapids, MI 49504
$-584
Cash flow
-9.1%
Cash-on-Cash Return
4.2%
Cap rate
0.6%
Rent to Value Ratio

Active
$330,000
3
bds
|
2
ba
|
1,461
sqft
|
built
1915
1448 Hall St SE, Grand Rapids, MI 49506
$-165
Cash flow
-2.6%
Cash-on-Cash Return
5.7%
Cap rate
0.8%
Rent to Value Ratio

Active
$249,900
2
bds
|
1
ba
|
1,080
sqft
|
built
1952
3064 Brookfield Ave NE, Grand Rapids, MI 49505
$-250
Cash flow
-5.2%
Cash-on-Cash Return
5.1%
Cap rate
0.7%
Rent to Value Ratio