Grand Rapids, MI Investment Properties for Sale
Browse homes for sale and investment properties in Grand Rapids, MI. Refine your search by price, property type, or more.
Best cash flowing properties in Grand Rapids, MI

Active
$199,000
2
bds
|
1
ba
|
1,004
sqft
|
built
1955
420 Elmdale St NE, Grand Rapids, MI 49525
$181
Cash flow
4.7%
Cash-on-Cash Return
7.4%
Cap rate
1.0%
Rent to Value Ratio

Active
$169,900
3
bds
|
2
ba
|
1,096
sqft
|
built
1910
1228 Quarry Ave NW, Grand Rapids, MI 49504
$125
Cash flow
3.8%
Cash-on-Cash Return
7.1%
Cap rate
0.9%
Rent to Value Ratio
263 out of 292 properties for sale in Grand Rapids, MI
Limited Results Shown
Create a free account, or log in to reveal all property listings and enjoy the complete experience.

Active
$299,000
bds
|
0
ba
|
0
sqft
|
built
1890
635 Sinclair Ave NE, Grand Rapids, MI 49503
$-793
Cash flow
-13.8%
Cash-on-Cash Return
3.1%
Cap rate
0.5%
Rent to Value Ratio

Active
$344,900
3
bds
|
2
ba
|
2,109
sqft
|
built
1925
1248 Fisk Rd SE, Grand Rapids, MI 49506
$-451
Cash flow
-6.8%
Cash-on-Cash Return
4.7%
Cap rate
0.7%
Rent to Value Ratio

Active
$800,000
4
bds
|
3
ba
|
2,974
sqft
|
built
1963
1757 Westlane Dr NE, Grand Rapids, MI 49505
$-2,305
Cash flow
-15.0%
Cash-on-Cash Return
2.8%
Cap rate
0.4%
Rent to Value Ratio
Active
$795,000
4
bds
|
3
ba
|
2,803
sqft
|
built
1885
3 Woodward Ln SE, Grand Rapids, MI 49506
$-2,769
Cash flow
-18.2%
Cash-on-Cash Return
2.1%
Cap rate
0.3%
Rent to Value Ratio

Active
$334,500
3
bds
|
2
ba
|
1,548
sqft
|
built
1930
238 Richards Ave SW, Grand Rapids, MI 49504
$-584
Cash flow
-9.1%
Cash-on-Cash Return
4.2%
Cap rate
0.6%
Rent to Value Ratio

Active
$330,000
3
bds
|
2
ba
|
1,461
sqft
|
built
1915
1448 Hall St SE, Grand Rapids, MI 49506
$-165
Cash flow
-2.6%
Cash-on-Cash Return
5.7%
Cap rate
0.8%
Rent to Value Ratio

Active
$249,900
2
bds
|
1
ba
|
1,080
sqft
|
built
1952
3064 Brookfield Ave NE, Grand Rapids, MI 49505
$-250
Cash flow
-5.2%
Cash-on-Cash Return
5.1%
Cap rate
0.7%
Rent to Value Ratio

Active
$1,000,000
5
bds
|
5
ba
|
3,958
sqft
|
built
1926
1101 Cadillac Dr SE, Grand Rapids, MI 49506
$-3,386
Cash flow
-17.7%
Cash-on-Cash Return
2.2%
Cap rate
0.4%
Rent to Value Ratio

Active
$569,900
4
bds
|
3
ba
|
3,336
sqft
|
built
2001
3916 Grand River Dr NE, Grand Rapids, MI 49525
$-1,336
Cash flow
-12.2%
Cash-on-Cash Return
3.5%
Cap rate
0.6%
Rent to Value Ratio

Active
$229,900
4
bds
|
1
ba
|
1,217
sqft
|
built
1860
630 Prospect Ave NE, Grand Rapids, MI 49503
$-42
Cash flow
-1.0%
Cash-on-Cash Return
6.0%
Cap rate
0.8%
Rent to Value Ratio

Active
$519,900
2
bds
|
2
ba
|
1,495
sqft
|
built
2007
335 Bridge St NW, Grand Rapids, MI 49504
$-2,364
Cash flow
-23.7%
Cash-on-Cash Return
0.8%
Cap rate
0.5%
Rent to Value Ratio

Active
$429,900
3
bds
|
2
ba
|
1,837
sqft
|
built
1931
4372 Hunsberger Ave NE, Grand Rapids, MI 49525
$-709
Cash flow
-8.6%
Cash-on-Cash Return
4.3%
Cap rate
0.6%
Rent to Value Ratio

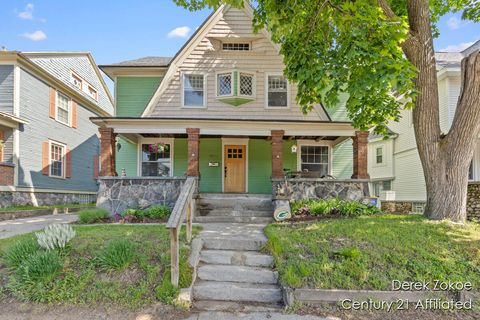
Active
$280,000
3
bds
|
2
ba
|
1,292
sqft
|
built
1885
121 Houseman Ave NE, Grand Rapids, MI 49503
$-395
Cash flow
-7.4%
Cash-on-Cash Return
4.6%
Cap rate
0.6%
Rent to Value Ratio

Active
$239,900
3
bds
|
1
ba
|
1,180
sqft
|
built
1926
1714 Kalamazoo Ave SE, Grand Rapids, MI 49507
$-244
Cash flow
-5.3%
Cash-on-Cash Return
5.0%
Cap rate
0.8%
Rent to Value Ratio

Active
$262,500
3
bds
|
2
ba
|
1,377
sqft
|
built
1925
1060 Walker Ave NW, Grand Rapids, MI 49504
$-183
Cash flow
-3.6%
Cash-on-Cash Return
5.4%
Cap rate
0.9%
Rent to Value Ratio

Active
$465,000
2
bds
|
3
ba
|
1,326
sqft
|
built
2019
627 Fairview Ave NE, Grand Rapids, MI 49503
$-1,258
Cash flow
-14.1%
Cash-on-Cash Return
3.0%
Cap rate
0.7%
Rent to Value Ratio

Active
$399,900
5
bds
|
4
ba
|
2,789
sqft
|
built
1911
1951 Leonard St NW, Grand Rapids, MI 49504
$-256
Cash flow
-3.3%
Cash-on-Cash Return
5.5%
Cap rate
0.8%
Rent to Value Ratio

Active
$279,900
3
bds
|
2
ba
|
1,984
sqft
|
built
1923
1032 Lafayette Ave NE, Grand Rapids, MI 49503
$-332
Cash flow
-6.2%
Cash-on-Cash Return
4.8%
Cap rate
0.7%
Rent to Value Ratio

Active
$334,900
3
bds
|
2
ba
|
1,540
sqft
|
built
1925
465 Kenwood St NE, Grand Rapids, MI 49505
$-462
Cash flow
-7.2%
Cash-on-Cash Return
4.6%
Cap rate
0.7%
Rent to Value Ratio

Active
$214,900
4
bds
|
1
ba
|
1,198
sqft
|
built
1880
846 Lafayette Ave NE, Grand Rapids, MI 49503
$-151
Cash flow
-3.7%
Cash-on-Cash Return
5.4%
Cap rate
0.8%
Rent to Value Ratio

Active
$315,000
1
bds
|
1
ba
|
731
sqft
|
built
1990
60 Campau Cir NW, Grand Rapids, MI 49503
$-1,114
Cash flow
-18.5%
Cash-on-Cash Return
2.0%
Cap rate
0.7%
Rent to Value Ratio

Active
$234,900
3
bds
|
2
ba
|
1,501
sqft
|
built
1919
1200 Jackson St NW, Grand Rapids, MI 49504
$-390
Cash flow
-8.7%
Cash-on-Cash Return
4.3%
Cap rate
0.8%
Rent to Value Ratio

Active
$500,000
5
bds
|
2
ba
|
2,012
sqft
|
built
1950
3020 Cascade Rd SE, Grand Rapids, MI 49506
$-1,333
Cash flow
-13.9%
Cash-on-Cash Return
3.1%
Cap rate
0.5%
Rent to Value Ratio
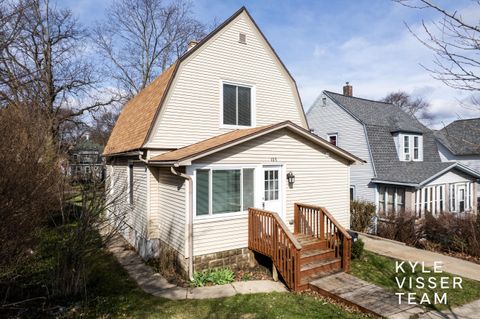
Active
$285,000
3
bds
|
2
ba
|
1,218
sqft
|
built
1910
135 Houseman Ave NE, Grand Rapids, MI 49503
$-295
Cash flow
-5.4%
Cash-on-Cash Return
5.0%
Cap rate
0.8%
Rent to Value Ratio
Active
$835,000
3
bds
|
3
ba
|
1,891
sqft
|
built
2007
335 Bridge St NW, Grand Rapids, MI 49504
$-2,534
Cash flow
-15.8%
Cash-on-Cash Return
2.6%
Cap rate
0.7%
Rent to Value Ratio
Active
$374,900
4
bds
|
2
ba
|
1,896
sqft
|
built
1900
1237 Wealthy St SE, Grand Rapids, MI 49506
$-617
Cash flow
-8.6%
Cash-on-Cash Return
4.3%
Cap rate
0.7%
Rent to Value Ratio

Active
$309,500
1
bds
|
1
ba
|
926
sqft
|
built
1892
940 Monroe Ave NW, Grand Rapids, MI 49503
$-1,151
Cash flow
-19.4%
Cash-on-Cash Return
1.8%
Cap rate
0.5%
Rent to Value Ratio

Active
$369,900
4
bds
|
5
ba
|
2,010
sqft
|
built
1930
1116 Covell Ave NW, Grand Rapids, MI 49504
$-539
Cash flow
-7.6%
Cash-on-Cash Return
4.5%
Cap rate
0.7%
Rent to Value Ratio

Active
$925,000
4
bds
|
4
ba
|
3,890
sqft
|
built
1989
2409 Ridgecroft Ave SE, Grand Rapids, MI 49546
$-2,711
Cash flow
-15.3%
Cash-on-Cash Return
2.7%
Cap rate
0.4%
Rent to Value Ratio
Active
$299,000
2
bds
|
2
ba
|
0
sqft
|
built
1900
600 Broadway Ave NW, Grand Rapids, MI 49504
$-1,317
Cash flow
-23.0%
Cash-on-Cash Return
1.0%
Cap rate
0.7%
Rent to Value Ratio

Active
$239,000
3
bds
|
1
ba
|
1,054
sqft
|
built
1880
824 Emerald Ave NE, Grand Rapids, MI 49503
$-474
Cash flow
-10.3%
Cash-on-Cash Return
3.9%
Cap rate
0.7%
Rent to Value Ratio

Active
$534,900
4
bds
|
4
ba
|
3,285
sqft
|
built
1963
1364 Worcester Dr NE, Grand Rapids, MI 49505
$-1,168
Cash flow
-11.4%
Cash-on-Cash Return
3.6%
Cap rate
0.5%
Rent to Value Ratio

Active
$289,900
bds
|
0
ba
|
0
sqft
|
built
1900
510 Woodlawn St SE, Grand Rapids, MI 49507
$-322
Cash flow
-5.8%
Cash-on-Cash Return
4.9%
Cap rate
0.7%
Rent to Value Ratio
Active
$688,888
4
bds
|
3
ba
|
2,680
sqft
|
built
2023
6830 Golden View Dr, Grand Rapids, MI 49512
$-1,863
Cash flow
-14.1%
Cash-on-Cash Return
3.0%
Cap rate
0.6%
Rent to Value Ratio

Active
$849,900
3
bds
|
3
ba
|
2,055
sqft
|
built
1988
226 Sunset Ave NW, Grand Rapids, MI 49504
$-2,683
Cash flow
-16.5%
Cash-on-Cash Return
2.5%
Cap rate
0.4%
Rent to Value Ratio

Active
$357,900
3
bds
|
2
ba
|
1,749
sqft
|
built
1960
1335 Knapp St NE, Grand Rapids, MI 49505
$-1,322
Cash flow
-19.3%
Cash-on-Cash Return
1.8%
Cap rate
0.6%
Rent to Value Ratio

Active
$730,000
7
bds
|
4
ba
|
4,768
sqft
|
built
1979
2325 Indian Mill Creek Dr NW, Grand Rapids, MI 49544
$-2,014
Cash flow
-14.4%
Cash-on-Cash Return
3.0%
Cap rate
0.5%
Rent to Value Ratio

Active
$555,000
5
bds
|
3
ba
|
3,818
sqft
|
built
1977
6872 Forest Valley Dr SE, Grand Rapids, MI 49546
$-976
Cash flow
-9.2%
Cash-on-Cash Return
4.2%
Cap rate
0.6%
Rent to Value Ratio