Grand Rapids, MI Investment Properties for Sale
Browse homes for sale and investment properties in Grand Rapids, MI. Refine your search by price, property type, or more.
Best cash flowing properties in Grand Rapids, MI
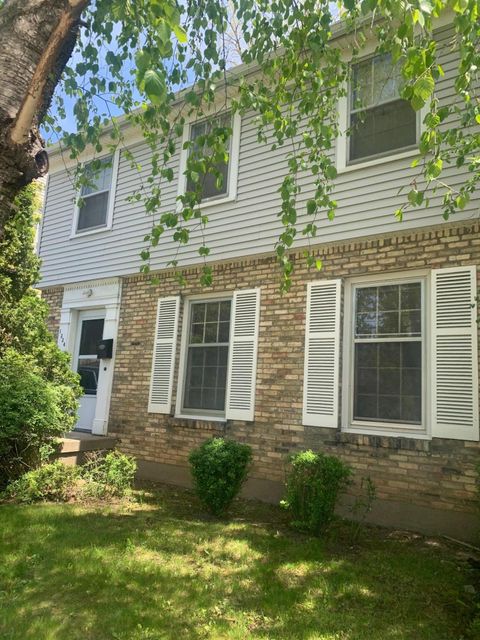
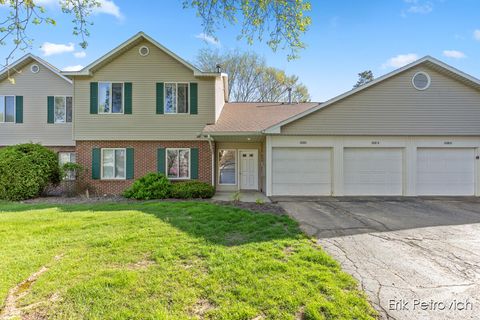
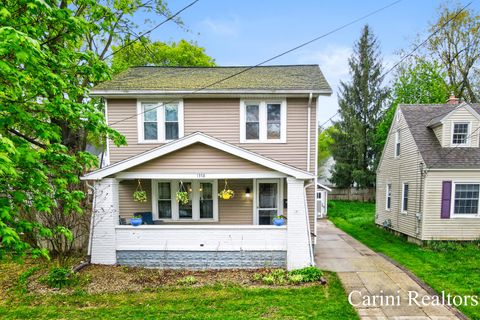
Active
$229,900
3
bds
|
2
ba
|
1,578
sqft
|
built
1937
1334 Fuller Ave SE, Grand Rapids, MI 49506
$80
Cash flow
1.8%
Cash-on-Cash Return
6.7%
Cap rate
0.9%
Rent to Value Ratio

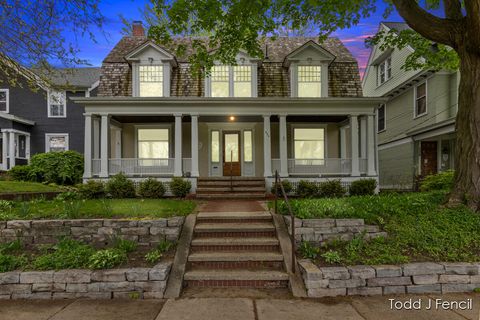
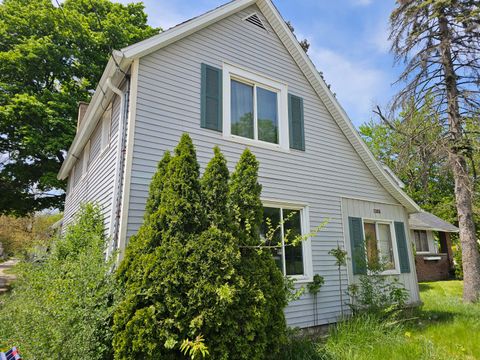
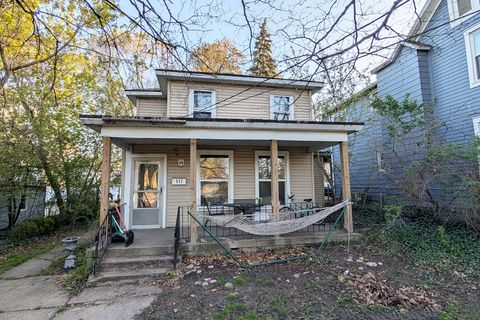
Active
$229,900
4
bds
|
1
ba
|
1,794
sqft
|
built
1918
525 Shirley St NE, Grand Rapids, MI 49503
$54
Cash flow
1.2%
Cash-on-Cash Return
6.5%
Cap rate
1.0%
Rent to Value Ratio
250 out of 279 properties for sale in Grand Rapids, MI
Limited Results Shown
Create a free account, or log in to reveal all property listings and enjoy the complete experience.

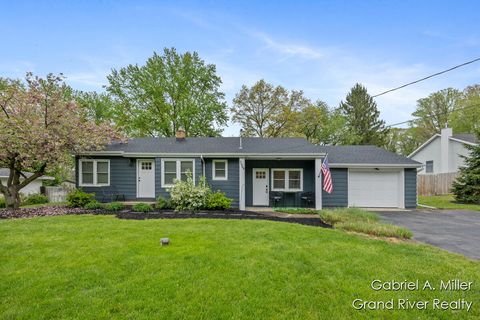
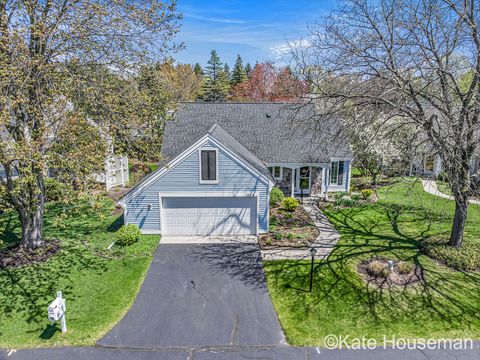
Active
$295,000
bds
|
0
ba
|
0
sqft
|
built
1923
418 Griggs St SE, Grand Rapids, MI 49507
$-937
Cash flow
-16.6%
Cash-on-Cash Return
2.5%
Cap rate
0.5%
Rent to Value Ratio

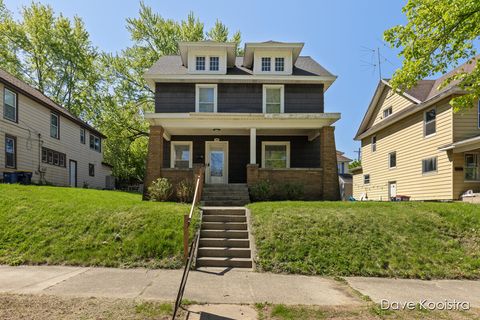
Active
$718,000
4
bds
|
3
ba
|
3,064
sqft
|
built
2023
4515 Harbor View Dr, Grand Rapids, MI 49512
$-1,696
Cash flow
-12.3%
Cash-on-Cash Return
3.4%
Cap rate
0.6%
Rent to Value Ratio
Active
$624,900
4
bds
|
3
ba
|
3,386
sqft
|
built
1905
554 Madison Ave SE, Grand Rapids, MI 49503
$-948
Cash flow
-7.9%
Cash-on-Cash Return
4.4%
Cap rate
0.7%
Rent to Value Ratio

Active
$949,900
5
bds
|
5
ba
|
3,405
sqft
|
built
2007
2429 Shears Crossing Ct NE, Grand Rapids, MI 49525
$-3,271
Cash flow
-18.0%
Cash-on-Cash Return
2.1%
Cap rate
0.4%
Rent to Value Ratio
Active
$360,000
3
bds
|
2
ba
|
1,540
sqft
|
built
1954
2468 Irene St SE, Grand Rapids, MI 49546
$-327
Cash flow
-4.7%
Cash-on-Cash Return
5.2%
Cap rate
0.8%
Rent to Value Ratio

Active
$220,000
3
bds
|
2
ba
|
1,464
sqft
|
built
1910
111 Fair St SE, Grand Rapids, MI 49507
$-29
Cash flow
-0.7%
Cash-on-Cash Return
6.1%
Cap rate
0.8%
Rent to Value Ratio
Active
$289,900
4
bds
|
2
ba
|
1,656
sqft
|
built
1915
106 Colfax St NE, Grand Rapids, MI 49505
$-435
Cash flow
-7.8%
Cash-on-Cash Return
4.5%
Cap rate
0.7%
Rent to Value Ratio

Active
$325,000
2
bds
|
2
ba
|
1,165
sqft
|
built
2014
600 Douglas St NW, Grand Rapids, MI 49504
$-1,134
Cash flow
-18.2%
Cash-on-Cash Return
2.1%
Cap rate
0.8%
Rent to Value Ratio

Active
$499,000
3
bds
|
3
ba
|
1,872
sqft
|
built
1990
2657 Leffingwell Ave NE, Grand Rapids, MI 49525
$-955
Cash flow
-10.0%
Cash-on-Cash Return
4.0%
Cap rate
0.6%
Rent to Value Ratio
Active
$219,900
2
bds
|
1
ba
|
829
sqft
|
built
1989
3185 Windcrest Dr NE, Grand Rapids, MI 49525
$-516
Cash flow
-12.2%
Cash-on-Cash Return
3.4%
Cap rate
0.8%
Rent to Value Ratio

Active
$630,000
3
bds
|
2
ba
|
2,246
sqft
|
built
1930
3020 Fulton St E, Grand Rapids, MI 49506
$-1,632
Cash flow
-13.5%
Cash-on-Cash Return
3.2%
Cap rate
0.5%
Rent to Value Ratio
Active
$239,999
3
bds
|
2
ba
|
1,300
sqft
|
built
1924
1335 Kalamazoo Ave SE, Grand Rapids, MI 49507
$-647
Cash flow
-14.1%
Cash-on-Cash Return
3.0%
Cap rate
0.6%
Rent to Value Ratio

Active
$192,000
4
bds
|
1
ba
|
1,285
sqft
|
built
1921
922 Prince St SE, Grand Rapids, MI 49507
$-4,956
Cash flow
-134.7%
Cash-on-Cash Return
-24.7%
Cap rate
0.8%
Rent to Value Ratio

Active
$209,900
2
bds
|
2
ba
|
1,306
sqft
|
built
1981
5803 Leisure South Dr SE, Grand Rapids, MI 49548
$-623
Cash flow
-15.5%
Cash-on-Cash Return
2.7%
Cap rate
0.7%
Rent to Value Ratio

Active
$569,000
4
bds
|
3
ba
|
2,816
sqft
|
built
1978
3290 Hidden Hills Ct SE, Grand Rapids, MI 49546
$-1,157
Cash flow
-10.6%
Cash-on-Cash Return
3.8%
Cap rate
0.6%
Rent to Value Ratio

Active
$609,999
2
bds
|
2
ba
|
1,443
sqft
|
built
2010
335 Bridge St NW, Grand Rapids, MI 49504
$-1,867
Cash flow
-16.0%
Cash-on-Cash Return
2.6%
Cap rate
0.7%
Rent to Value Ratio

Active
$390,000
3
bds
|
3
ba
|
3,182
sqft
|
built
1975
3144 E Gatehouse Dr SE, Grand Rapids, MI 49546
$-1,305
Cash flow
-17.5%
Cash-on-Cash Return
2.2%
Cap rate
0.7%
Rent to Value Ratio

Active
$994,000
3
bds
|
3
ba
|
4,454
sqft
|
built
1999
7205 60th St SE, Grand Rapids, MI 49512
$-2,501
Cash flow
-13.1%
Cash-on-Cash Return
3.2%
Cap rate
0.6%
Rent to Value Ratio

Active
$499,900
4
bds
|
3
ba
|
2,620
sqft
|
built
1999
3729 Windshire Dr SE, Grand Rapids, MI 49546
$-1,149
Cash flow
-12.0%
Cash-on-Cash Return
3.5%
Cap rate
0.6%
Rent to Value Ratio
Active
$515,000
2
bds
|
3
ba
|
1,848
sqft
|
built
1988
1334 Thornberry Court West SE, Grand Rapids, MI 49546
$-1,509
Cash flow
-15.3%
Cash-on-Cash Return
2.7%
Cap rate
0.6%
Rent to Value Ratio

Active
$324,999
3
bds
|
3
ba
|
2,328
sqft
|
built
1998
4330 Aspen Trails Dr NE, Grand Rapids, MI 49546
$-768
Cash flow
-12.3%
Cash-on-Cash Return
3.4%
Cap rate
0.7%
Rent to Value Ratio
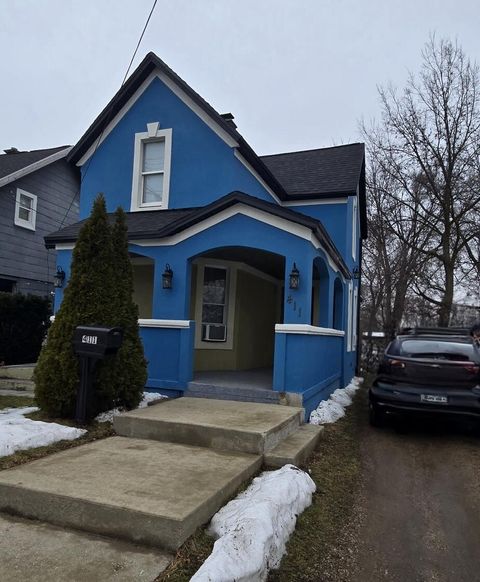
Active
$229,900
5
bds
|
2
ba
|
1,459
sqft
|
built
1900
411 Burton St SW, Grand Rapids, MI 49507
$-79
Cash flow
-1.8%
Cash-on-Cash Return
5.9%
Cap rate
0.8%
Rent to Value Ratio

Active
$236,500
1
bds
|
2
ba
|
600
sqft
|
built
1900
600 Broadway Ave NW, Grand Rapids, MI 49504
$-177
Cash flow
-3.9%
Cash-on-Cash Return
5.4%
Cap rate
0.8%
Rent to Value Ratio
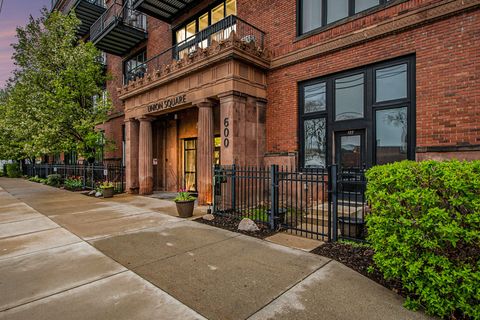
Active
$249,900
1
bds
|
1
ba
|
716
sqft
|
built
1900
600 Broadway Ave NW, Grand Rapids, MI 49504
$-930
Cash flow
-19.4%
Cash-on-Cash Return
1.8%
Cap rate
0.7%
Rent to Value Ratio

Active
$625,000
7
bds
|
5
ba
|
3,341
sqft
|
built
1973
2678 Richmond St NW, Grand Rapids, MI 49504
$-1,681
Cash flow
-14.0%
Cash-on-Cash Return
3.0%
Cap rate
0.5%
Rent to Value Ratio

Active
$209,900
bds
|
0
ba
|
0
sqft
|
built
1905
1403 Turner Ave NW, Grand Rapids, MI 49504
$-112
Cash flow
-2.8%
Cash-on-Cash Return
5.6%
Cap rate
0.8%
Rent to Value Ratio

Active
$560,000
3
bds
|
3
ba
|
2,707
sqft
|
built
2013
425 Enclave Ct SE, Grand Rapids, MI 49546
$-1,889
Cash flow
-17.6%
Cash-on-Cash Return
2.2%
Cap rate
0.5%
Rent to Value Ratio
Active
$325,000
4
bds
|
3
ba
|
1,652
sqft
|
built
1927
1358 Johnston St SE, Grand Rapids, MI 49507
$-249
Cash flow
-4.0%
Cash-on-Cash Return
5.3%
Cap rate
0.8%
Rent to Value Ratio

Active
$359,900
3
bds
|
2
ba
|
1,624
sqft
|
built
1975
1150 Farnsworth Ave SE, Grand Rapids, MI 49546
$-686
Cash flow
-9.9%
Cash-on-Cash Return
4.0%
Cap rate
0.6%
Rent to Value Ratio

Active
$1,890,000
5
bds
|
5
ba
|
4,481
sqft
|
built
1924
2630 Reeds Lake Ct SE, Grand Rapids, MI 49506
$-8,612
Cash flow
-23.8%
Cash-on-Cash Return
0.8%
Cap rate
0.3%
Rent to Value Ratio

Active
$529,900
5
bds
|
4
ba
|
2,371
sqft
|
built
1915
548 Pleasant St SE, Grand Rapids, MI 49503
$-1,405
Cash flow
-13.8%
Cash-on-Cash Return
3.1%
Cap rate
0.4%
Rent to Value Ratio
Active
$330,000
5
bds
|
2
ba
|
2,470
sqft
|
built
1915
117 Leonard St NE, Grand Rapids, MI 49503
$-377
Cash flow
-6.0%
Cash-on-Cash Return
4.9%
Cap rate
0.7%
Rent to Value Ratio

Active
$499,900
bds
|
0
ba
|
0
sqft
|
built
1914
437 Rosewood Ave SE, Grand Rapids, MI 49506
$-1,350
Cash flow
-14.1%
Cash-on-Cash Return
3.0%
Cap rate
0.6%
Rent to Value Ratio

Active
$359,900
3
bds
|
2
ba
|
2,120
sqft
|
built
1960
7879 Eastern Ave SE, Grand Rapids, MI 49508
$-734
Cash flow
-10.6%
Cash-on-Cash Return
3.8%
Cap rate
0.6%
Rent to Value Ratio

Active
$465,000
3
bds
|
3
ba
|
1,927
sqft
|
built
2007
814 Livingston Ave NE, Grand Rapids, MI 49503
$-1,240
Cash flow
-13.9%
Cash-on-Cash Return
3.1%
Cap rate
0.6%
Rent to Value Ratio

Active
$425,000
2
bds
|
2
ba
|
1,110
sqft
|
built
1915
27 Library St NE, Grand Rapids, MI 49503
$-1,440
Cash flow
-17.7%
Cash-on-Cash Return
2.2%
Cap rate
0.6%
Rent to Value Ratio

Active
$1,890,000
bds
|
0
ba
|
0
sqft
|
built
1900
22 Jefferson Ave SE, Grand Rapids, MI 49503
$-9,247
Cash flow
-25.5%
Cash-on-Cash Return
0.4%
Cap rate
0.1%
Rent to Value Ratio

Active
$239,900
bds
|
0
ba
|
0
sqft
|
built
1885
41 Caledonia St NE, Grand Rapids, MI 49505
$-96
Cash flow
-2.1%
Cash-on-Cash Return
5.8%
Cap rate
0.8%
Rent to Value Ratio