Gulfport, MS Investment Properties for Sale
Browse homes for sale and investment properties in Gulfport, MS. Refine your search by price, property type, or more.
Best cash flowing properties in Gulfport, MS
Active
$82,000
4
bds
|
2
ba
|
0
sqft
|
built
2009
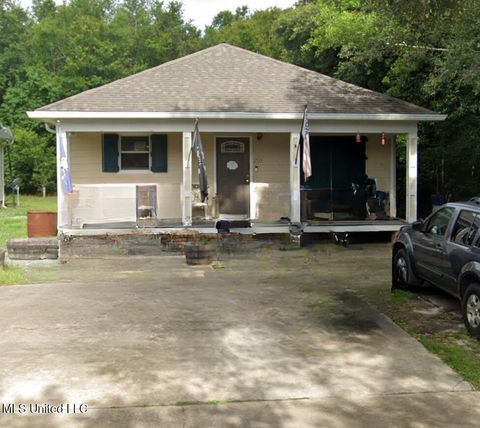
3515 38th Ave, Gulfport, MS 39501
$585
Cash flow
37.2%
Cash-on-Cash Return
14.2%
Cap rate
2.0%
Rent to Value Ratio
Active
$247,500
4
bds
|
3
ba
|
0
sqft
|
built
1972
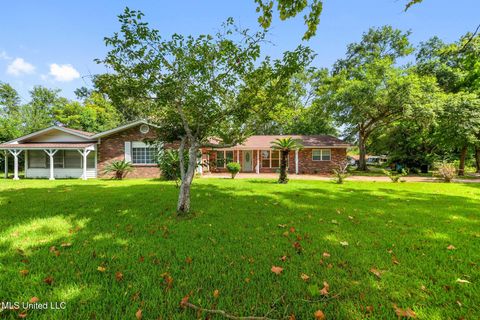
10463 Wade Ln, Gulfport, MS 39503
$493
Cash flow
10.4%
Cash-on-Cash Return
8.1%
Cap rate
1.0%
Rent to Value Ratio
271 out of 297 properties for sale in Gulfport, MS
Limited Results Shown
Create a free account, or log in to reveal all property listings and enjoy the complete experience.
Active
$100,800
3
bds
|
1
ba
|
0
sqft
|
built
1998
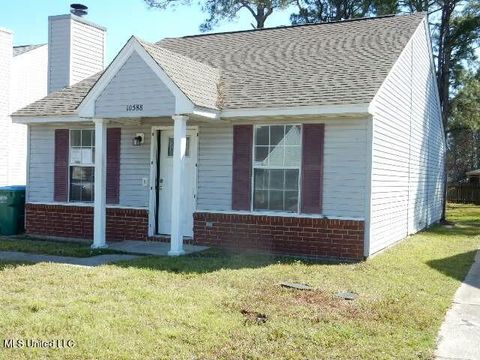
10588 Sharp Blvd, Gulfport, MS 39503
$397
Cash flow
20.5%
Cash-on-Cash Return
10.4%
Cap rate
1.4%
Rent to Value Ratio
Active
$178,000
3
bds
|
2
ba
|
0
sqft
|
built
1967
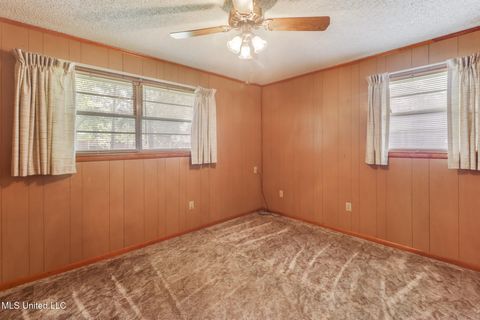
119 Gahan Dr, Gulfport, MS 39503
$216
Cash flow
6.3%
Cash-on-Cash Return
7.1%
Cap rate
0.9%
Rent to Value Ratio
Active
$175,000
3
bds
|
2
ba
|
0
sqft
|
built
1964
107 Estes St, Gulfport, MS 39503
$227
Cash flow
6.8%
Cash-on-Cash Return
7.2%
Cap rate
0.9%
Rent to Value Ratio
Active
$240,000
3
bds
|
2
ba
|
0
sqft
|
built
1954
301 43rd St, Gulfport, MS 39507
$142
Cash flow
3.1%
Cash-on-Cash Return
6.4%
Cap rate
0.8%
Rent to Value Ratio
Active
$165,000
3
bds
|
2
ba
|
0
sqft
|
built
1971
506 Harvey Ave, Gulfport, MS 39503
$271
Cash flow
8.6%
Cash-on-Cash Return
7.7%
Cap rate
1.0%
Rent to Value Ratio
Active
$249,000
4
bds
|
2
ba
|
0
sqft
|
built
1940
2016 19th Ave, Gulfport, MS 39501
$57
Cash flow
1.2%
Cash-on-Cash Return
6.0%
Cap rate
0.7%
Rent to Value Ratio

Active
$164,900
2
bds
|
2
ba
|
0
sqft
|
built
1990
12297 Windward Dr, Gulfport, MS 39503
$70
Cash flow
2.2%
Cash-on-Cash Return
6.2%
Cap rate
0.8%
Rent to Value Ratio
Active
$130,000
3
bds
|
3
ba
|
0
sqft
|
built
1962
504 N Wilson Blvd, Gulfport, MS 39503
$160
Cash flow
6.4%
Cash-on-Cash Return
7.2%
Cap rate
1.0%
Rent to Value Ratio
Active
$294,900
5
bds
|
4
ba
|
0
sqft
|
built
2015
14794 Canal Crossing Blvd, Gulfport, MS 39503
$162
Cash flow
2.9%
Cash-on-Cash Return
6.3%
Cap rate
0.8%
Rent to Value Ratio
Active
$255,000
3
bds
|
2
ba
|
0
sqft
|
built
2023
16974 Alcorn Ave, Gulfport, MS 39503
$-11
Cash flow
-0.2%
Cash-on-Cash Return
5.6%
Cap rate
0.8%
Rent to Value Ratio
Active
$200,000
2
bds
|
2
ba
|
0
sqft
|
built
1968
14160 John Clark Rd, Gulfport, MS 39503
$125
Cash flow
3.3%
Cash-on-Cash Return
6.4%
Cap rate
0.8%
Rent to Value Ratio

Active
$325,000
4
bds
|
2
ba
|
0
sqft
|
built
1972
700 Sarazen Dr, Gulfport, MS 39507
$-6
Cash flow
-0.1%
Cash-on-Cash Return
5.7%
Cap rate
0.8%
Rent to Value Ratio
Active
$280,875
3
bds
|
2
ba
|
0
sqft
|
built
2000
13342 Carriage Cir, Gulfport, MS 39503
$-78
Cash flow
-1.4%
Cash-on-Cash Return
5.3%
Cap rate
0.7%
Rent to Value Ratio
Active
$129,900
3
bds
|
2
ba
|
0
sqft
|
built
1969
118 Clarence Dr, Gulfport, MS 39503
$321
Cash flow
12.9%
Cash-on-Cash Return
8.6%
Cap rate
1.2%
Rent to Value Ratio
Active
$240,000
3
bds
|
3
ba
|
0
sqft
|
built
2007
1131 Century Oaks Dr, Gulfport, MS 39507
$-122
Cash flow
-2.7%
Cash-on-Cash Return
5.1%
Cap rate
0.8%
Rent to Value Ratio

Active
$259,500
4
bds
|
3
ba
|
0
sqft
|
built
1955
5104 Washington Ave, Gulfport, MS 39507
$169
Cash flow
3.4%
Cash-on-Cash Return
6.5%
Cap rate
0.8%
Rent to Value Ratio
Active
$145,000
3
bds
|
1
ba
|
0
sqft
|
built
1954
3908 Belmede Dr, Gulfport, MS 39507
$203
Cash flow
7.3%
Cash-on-Cash Return
7.4%
Cap rate
1.0%
Rent to Value Ratio
Active
$299,900
4
bds
|
4
ba
|
0
sqft
|
built
1958
19 Poplar Cir, Gulfport, MS 39507
$365
Cash flow
6.3%
Cash-on-Cash Return
7.1%
Cap rate
0.9%
Rent to Value Ratio
Active
$144,500
2
bds
|
2
ba
|
0
sqft
|
built
1975
2501 Gulf Ave, Gulfport, MS 39501
$-345
Cash flow
-12.5%
Cash-on-Cash Return
2.8%
Cap rate
1.0%
Rent to Value Ratio
Active
$152,000
3
bds
|
2
ba
|
0
sqft
|
built
2004
13372 Chris Dr, Gulfport, MS 39503
$337
Cash flow
11.6%
Cash-on-Cash Return
8.3%
Cap rate
1.1%
Rent to Value Ratio
Active
$620,000
3
bds
|
3
ba
|
0
sqft
|
built
2023
116 E Beach Blvd, Gulfport, MS 39507
$-1,376
Cash flow
-11.6%
Cash-on-Cash Return
3.0%
Cap rate
0.5%
Rent to Value Ratio
Active
$220,000
3
bds
|
2
ba
|
0
sqft
|
built
1982
16170 Kenwood Dr, Gulfport, MS 39503
$-11
Cash flow
-0.3%
Cash-on-Cash Return
5.6%
Cap rate
0.8%
Rent to Value Ratio
Active
$139,900
3
bds
|
2
ba
|
0
sqft
|
built
1973
2614 George St, Gulfport, MS 39503
$146
Cash flow
5.4%
Cash-on-Cash Return
6.9%
Cap rate
0.9%
Rent to Value Ratio
Active
$449,500
3
bds
|
2
ba
|
0
sqft
|
built
2005
2230 Beach Dr, Gulfport, MS 39507
$-1,455
Cash flow
-16.9%
Cash-on-Cash Return
1.8%
Cap rate
0.5%
Rent to Value Ratio
Active
$159,900
3
bds
|
2
ba
|
0
sqft
|
built
1970
214 Janelle Dr, Gulfport, MS 39503
$248
Cash flow
8.1%
Cash-on-Cash Return
7.5%
Cap rate
1.0%
Rent to Value Ratio
Active
$420,000
4
bds
|
3
ba
|
0
sqft
|
built
1991
1457 Georgia Pl, Gulfport, MS 39507
$-410
Cash flow
-5.1%
Cash-on-Cash Return
4.5%
Cap rate
0.6%
Rent to Value Ratio
Active
$179,900
3
bds
|
2
ba
|
0
sqft
|
built
1949
2704 Pine Ave, Gulfport, MS 39501
$300
Cash flow
8.7%
Cash-on-Cash Return
7.7%
Cap rate
1.0%
Rent to Value Ratio
Active
$327,000
3
bds
|
3
ba
|
0
sqft
|
built
1965
4712 Oak Ave, Gulfport, MS 39507
$-210
Cash flow
-3.4%
Cash-on-Cash Return
4.9%
Cap rate
0.6%
Rent to Value Ratio
Active
$839,000
5
bds
|
4
ba
|
0
sqft
|
built
2020
10788 E Taylor Rd, Gulfport, MS 39503
$-1,324
Cash flow
-8.2%
Cash-on-Cash Return
3.8%
Cap rate
0.5%
Rent to Value Ratio
Active
$329,900
3
bds
|
2
ba
|
0
sqft
|
built
2001
2252 Beach Dr, Gulfport, MS 39507
$-766
Cash flow
-12.1%
Cash-on-Cash Return
2.9%
Cap rate
0.8%
Rent to Value Ratio
Active
$230,000
4
bds
|
3
ba
|
0
sqft
|
built
1972
12394 Cypress Dr, Gulfport, MS 39503
$325
Cash flow
7.4%
Cash-on-Cash Return
7.4%
Cap rate
1.0%
Rent to Value Ratio

Active
$235,000
3
bds
|
1
ba
|
0
sqft
|
built
1958
2182 Collins Blvd, Gulfport, MS 39507
$-145
Cash flow
-3.2%
Cash-on-Cash Return
4.9%
Cap rate
0.7%
Rent to Value Ratio

Active
$222,000
3
bds
|
2
ba
|
0
sqft
|
built
2003
16091 Kaila Ct, Gulfport, MS 39503
$148
Cash flow
3.5%
Cash-on-Cash Return
6.5%
Cap rate
0.9%
Rent to Value Ratio
Active
$218,000
2
bds
|
1
ba
|
0
sqft
|
built
1925
828 Woodward Ave, Gulfport, MS 39501
$427
Cash flow
10.2%
Cash-on-Cash Return
8.0%
Cap rate
1.0%
Rent to Value Ratio
Active
$264,900
3
bds
|
2
ba
|
0
sqft
|
built
1964
218 Pinewood Cir, Gulfport, MS 39507
$-47
Cash flow
-0.9%
Cash-on-Cash Return
5.5%
Cap rate
0.7%
Rent to Value Ratio
Active
$145,500
3
bds
|
2
ba
|
0
sqft
|
built
1960
2509 6th Ave, Gulfport, MS 39501
$43
Cash flow
1.5%
Cash-on-Cash Return
6.0%
Cap rate
0.8%
Rent to Value Ratio

Active
$370,900
3
bds
|
2
ba
|
0
sqft
|
built
2008
13570 Brayton Blvd, Gulfport, MS 39503
$-348
Cash flow
-4.9%
Cash-on-Cash Return
4.6%
Cap rate
0.6%
Rent to Value Ratio
Active
$538,900
3
bds
|
2
ba
|
0
sqft
|
built
2005
2230 Beach Dr, Gulfport, MS 39507
$-2,081
Cash flow
-20.1%
Cash-on-Cash Return
1.0%
Cap rate
0.5%
Rent to Value Ratio