Hallandale Beach, FL Investment Properties for Sale
Browse homes for sale and investment properties in Hallandale Beach, FL. Refine your search by price, property type, or more.
Best cash flowing properties in Hallandale Beach, FL
Active
$269,000
2
bds
|
2
ba
|
1,092
sqft
|
built
1972
500 NE 12th Ave, Hallandale Beach, FL 33009
$-506
Cash flow
-9.8%
Cash-on-Cash Return
3.9%
Cap rate
0.9%
Rent to Value Ratio
Active
$177,000
1
bds
|
1
ba
|
620
sqft
|
built
1965
467 Golden Isles Dr, Hallandale Beach, FL 33009
$-601
Cash flow
-17.7%
Cash-on-Cash Return
2.1%
Cap rate
1.0%
Rent to Value Ratio
738 out of 822 properties for sale in Hallandale Beach, FL
Limited Results Shown
Create a free account, or log in to reveal all property listings and enjoy the complete experience.
Active
$1,300,000
3
bds
|
3
ba
|
2,000
sqft
|
built
1987
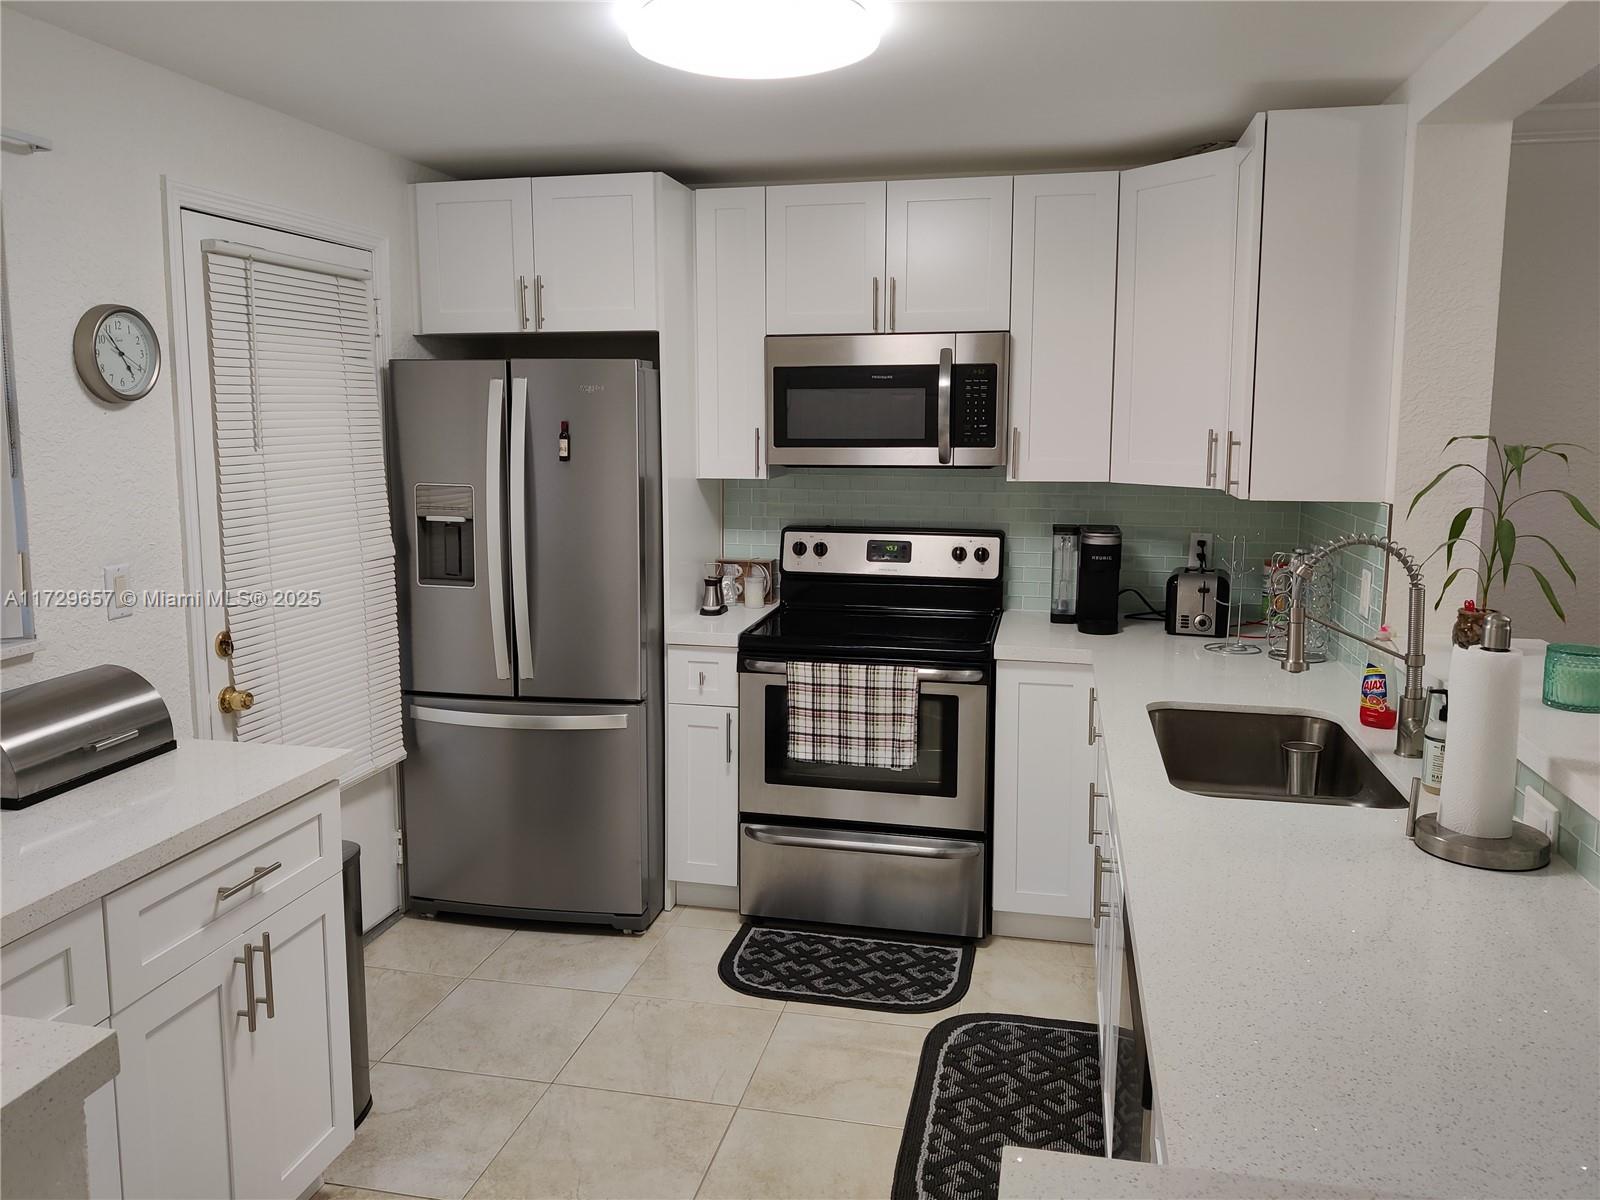
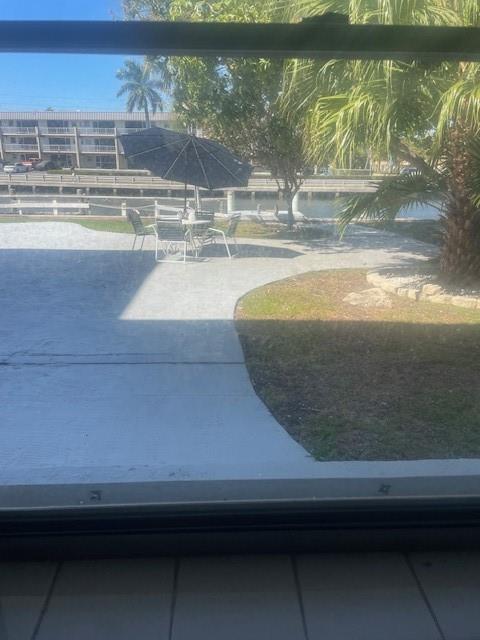
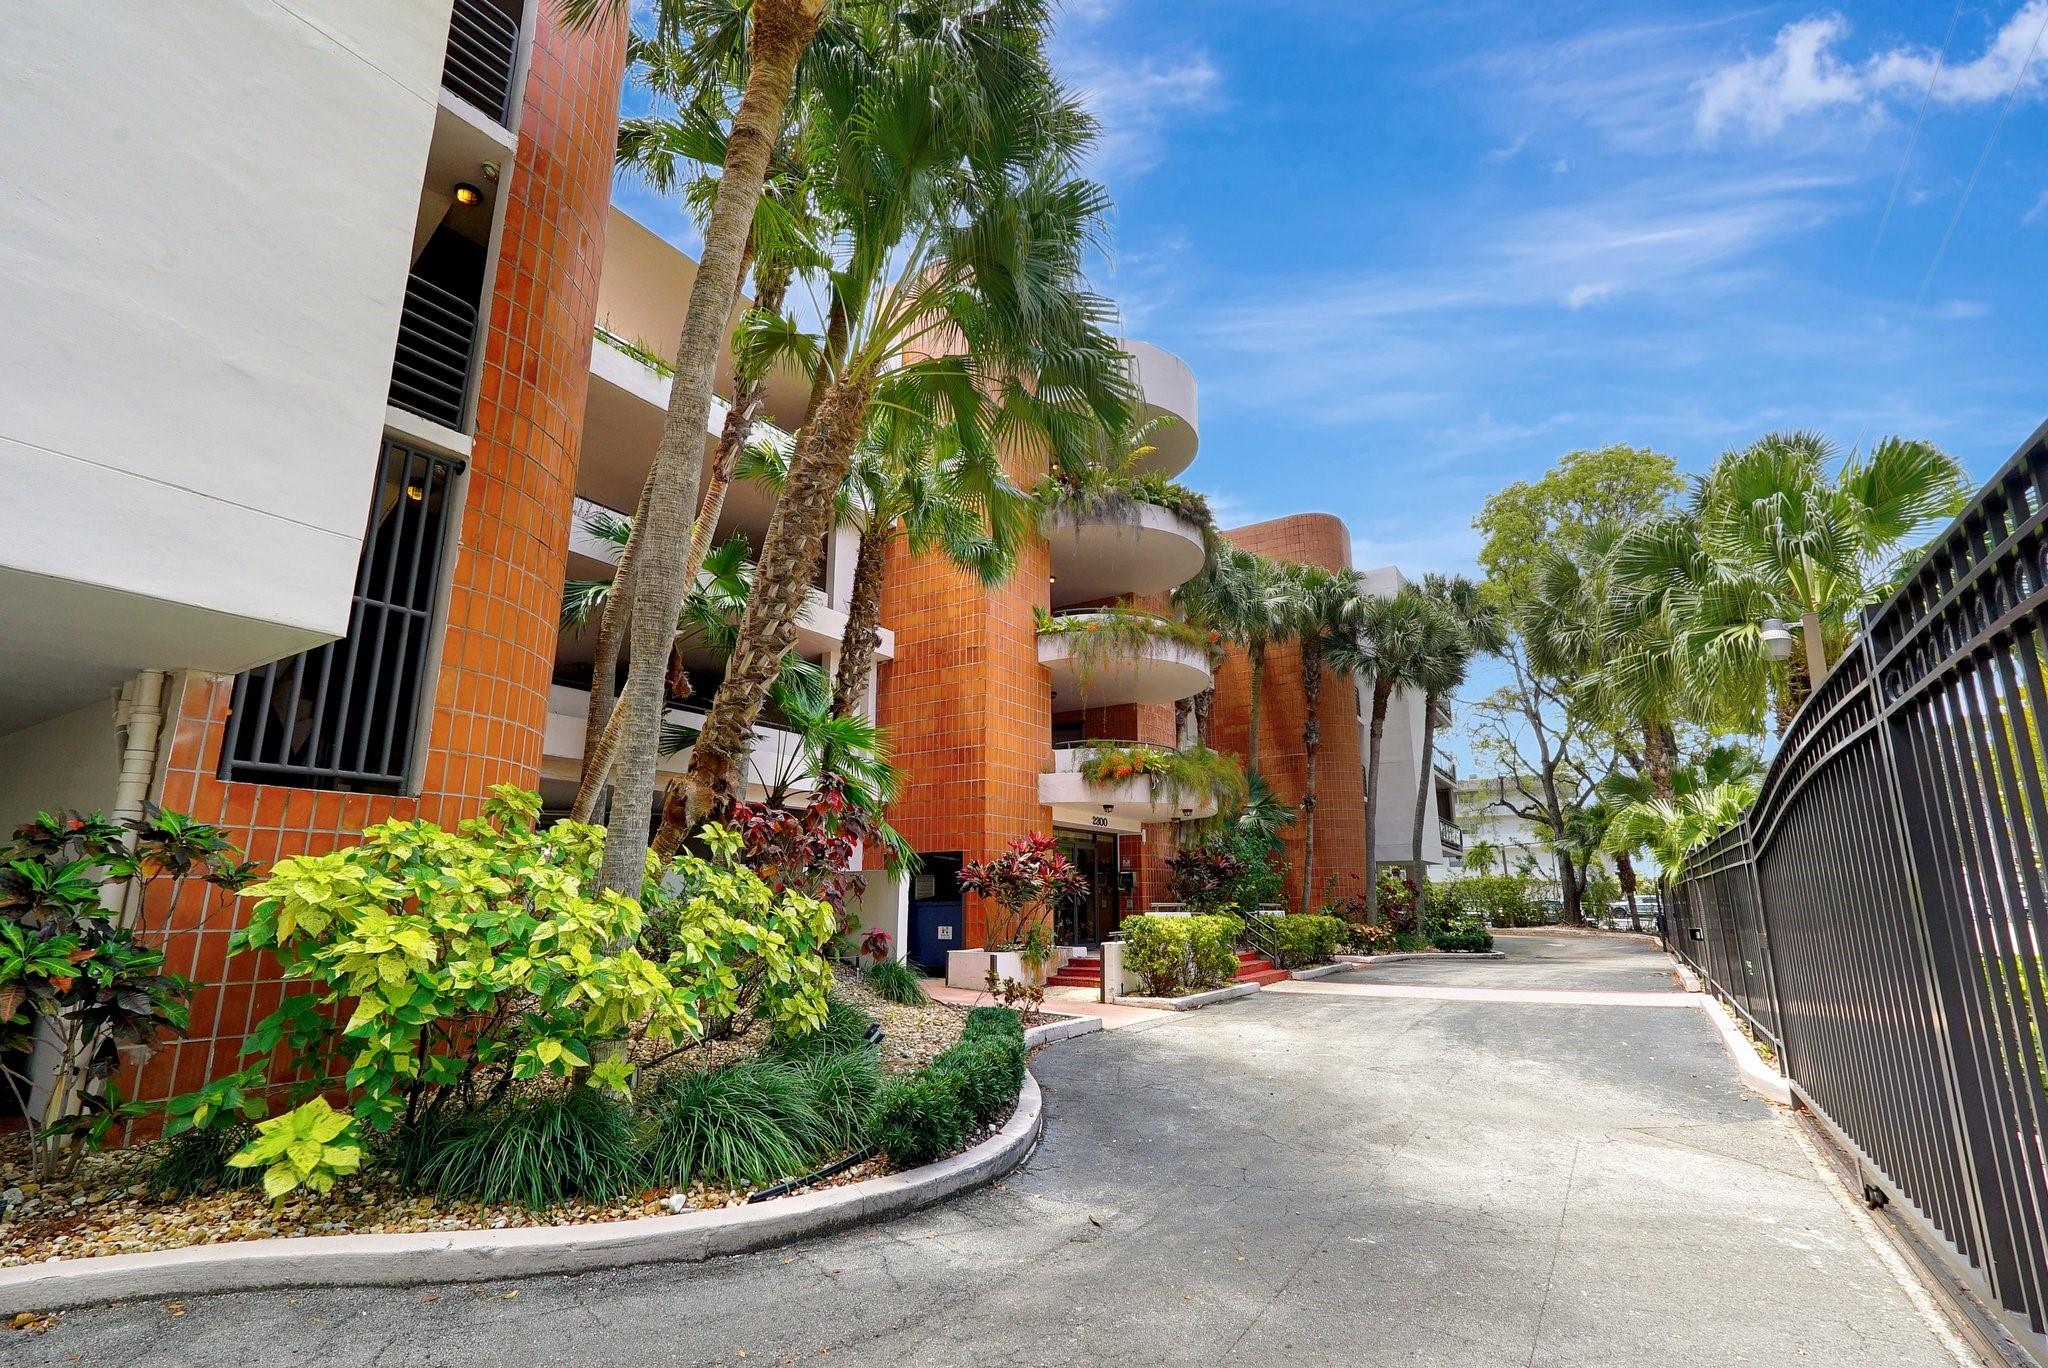
2300 Diana Dr, Hallandale Beach, FL 33009
$-6,139
Cash flow
-24.6%
Cash-on-Cash Return
0.5%
Cap rate
0.3%
Rent to Value Ratio
Active
$500,000
2
bds
|
2
ba
|
1,240
sqft
|
built
1971
1980 S Ocean Dr, Hallandale Beach, FL 33009
$-2,094
Cash flow
-21.9%
Cash-on-Cash Return
1.1%
Cap rate
0.7%
Rent to Value Ratio
Active
$199,000
1
bds
|
1
ba
|
700
sqft
|
built
1980
270 Layne Blvd, Hallandale Beach, FL 33009
$-610
Cash flow
-16.0%
Cash-on-Cash Return
2.5%
Cap rate
0.9%
Rent to Value Ratio
Active
$479,000
2
bds
|
2
ba
|
1,430
sqft
|
built
1976
800 Parkview Dr, Hallandale Beach, FL 33009
$-1,892
Cash flow
-20.6%
Cash-on-Cash Return
1.4%
Cap rate
0.8%
Rent to Value Ratio
Active
$269,000
2
bds
|
2
ba
|
1,092
sqft
|
built
1972
500 NE 12th Ave, Hallandale Beach, FL 33009
$-506
Cash flow
-9.8%
Cash-on-Cash Return
3.9%
Cap rate
0.9%
Rent to Value Ratio
Active
$177,000
1
bds
|
1
ba
|
620
sqft
|
built
1965
467 Golden Isles Dr, Hallandale Beach, FL 33009
$-601
Cash flow
-17.7%
Cash-on-Cash Return
2.1%
Cap rate
1.0%
Rent to Value Ratio
Active
$925,000
3
bds
|
3
ba
|
2,550
sqft
|
built
1980
136 Golden Isles Dr, Hallandale Beach, FL 33009
$-3,001
Cash flow
-16.9%
Cash-on-Cash Return
2.3%
Cap rate
0.6%
Rent to Value Ratio

Active
$1,049,000
2
bds
|
2
ba
|
1,337
sqft
|
built
2006
1830 S Ocean Dr, Hallandale Beach, FL 33009
$-4,499
Cash flow
-22.4%
Cash-on-Cash Return
1.0%
Cap rate
0.5%
Rent to Value Ratio
Active
$319,900
2
bds
|
2
ba
|
1,265
sqft
|
built
1972
427 Golden Isles Dr, Hallandale Beach, FL 33009
$-1,241
Cash flow
-20.2%
Cash-on-Cash Return
1.5%
Cap rate
0.9%
Rent to Value Ratio

Active
$349,000
2
bds
|
2
ba
|
1,360
sqft
|
built
1972
1833 S Ocean Dr, Hallandale Beach, FL 33009
$-1,191
Cash flow
-17.8%
Cash-on-Cash Return
2.1%
Cap rate
0.8%
Rent to Value Ratio

Active
$1,250,000
2
bds
|
2
ba
|
1,458
sqft
|
built
2006
1830 S Ocean Dr, Hallandale Beach, FL 33009
$-5,443
Cash flow
-22.7%
Cash-on-Cash Return
0.9%
Cap rate
0.5%
Rent to Value Ratio
Active
$200,000
1
bds
|
1
ba
|
545
sqft
|
built
1970
1965 S Ocean Dr, Hallandale Beach, FL 33009
$-776
Cash flow
-20.2%
Cash-on-Cash Return
1.5%
Cap rate
0.9%
Rent to Value Ratio
Active
$519,000
2
bds
|
2
ba
|
1,248
sqft
|
built
1970
2030 S Ocean Dr, Hallandale Beach, FL 33009
$-2,235
Cash flow
-22.5%
Cash-on-Cash Return
1.0%
Cap rate
0.7%
Rent to Value Ratio
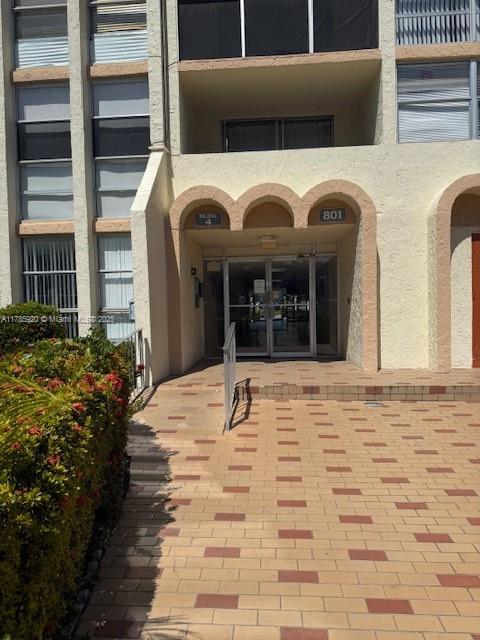
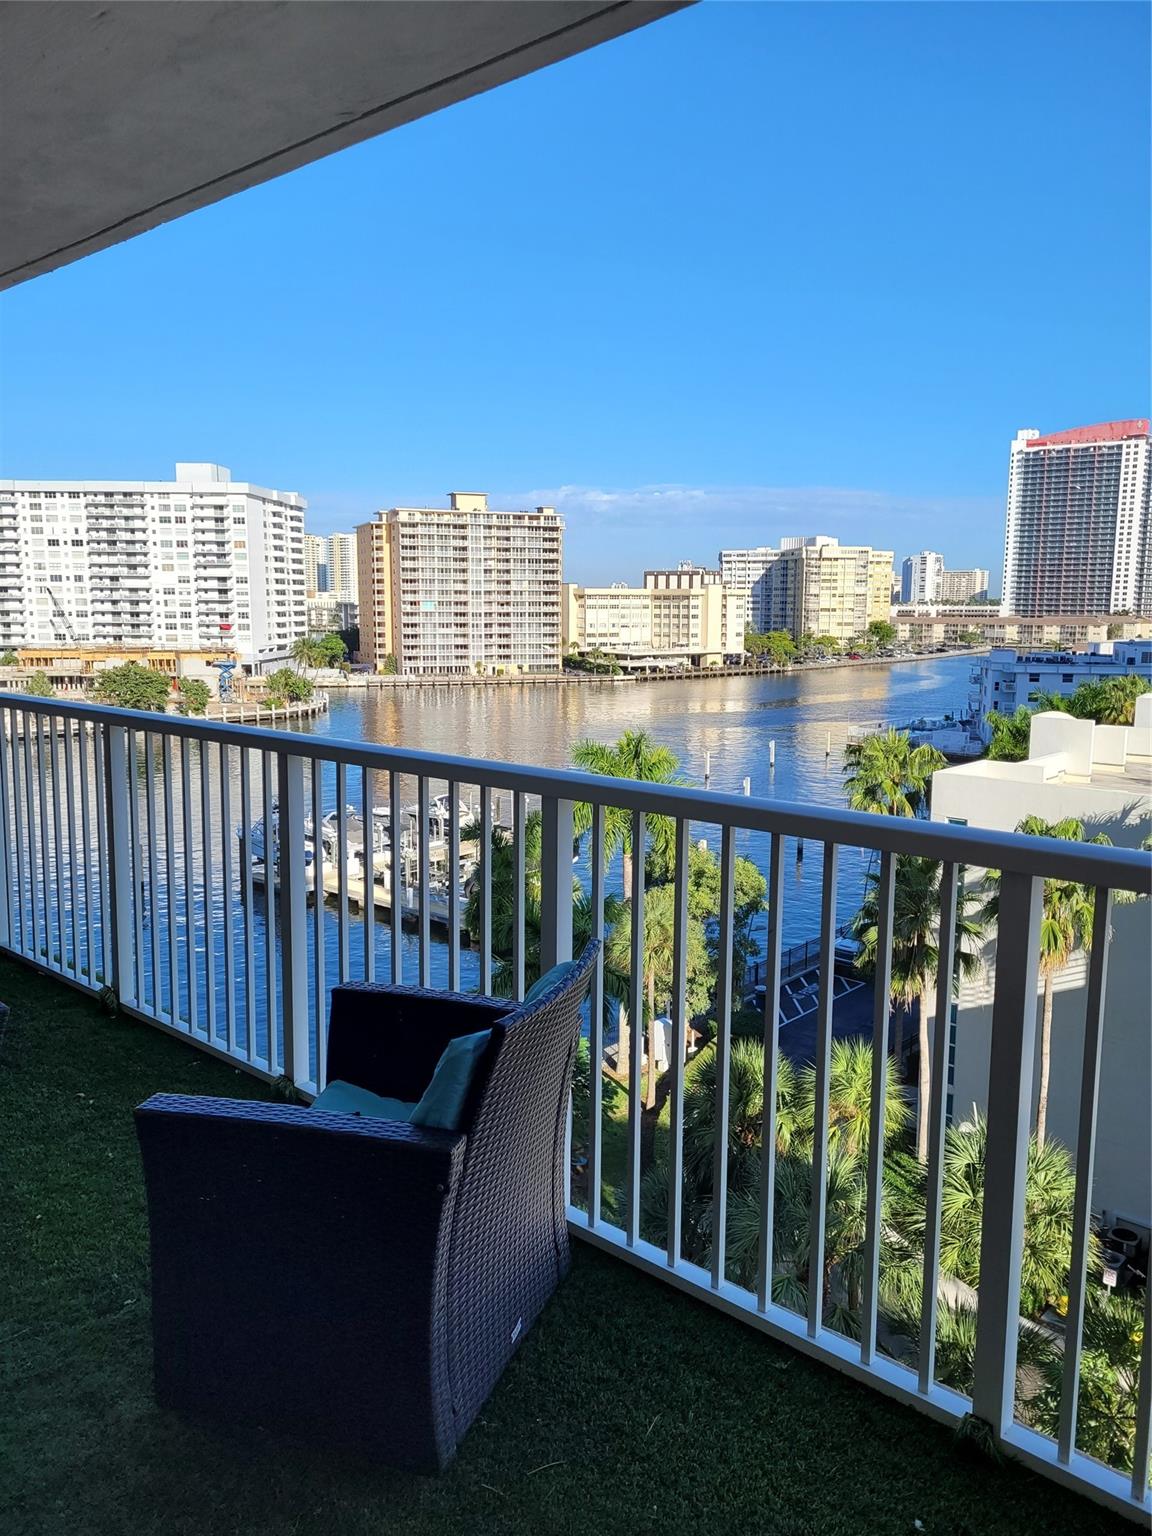
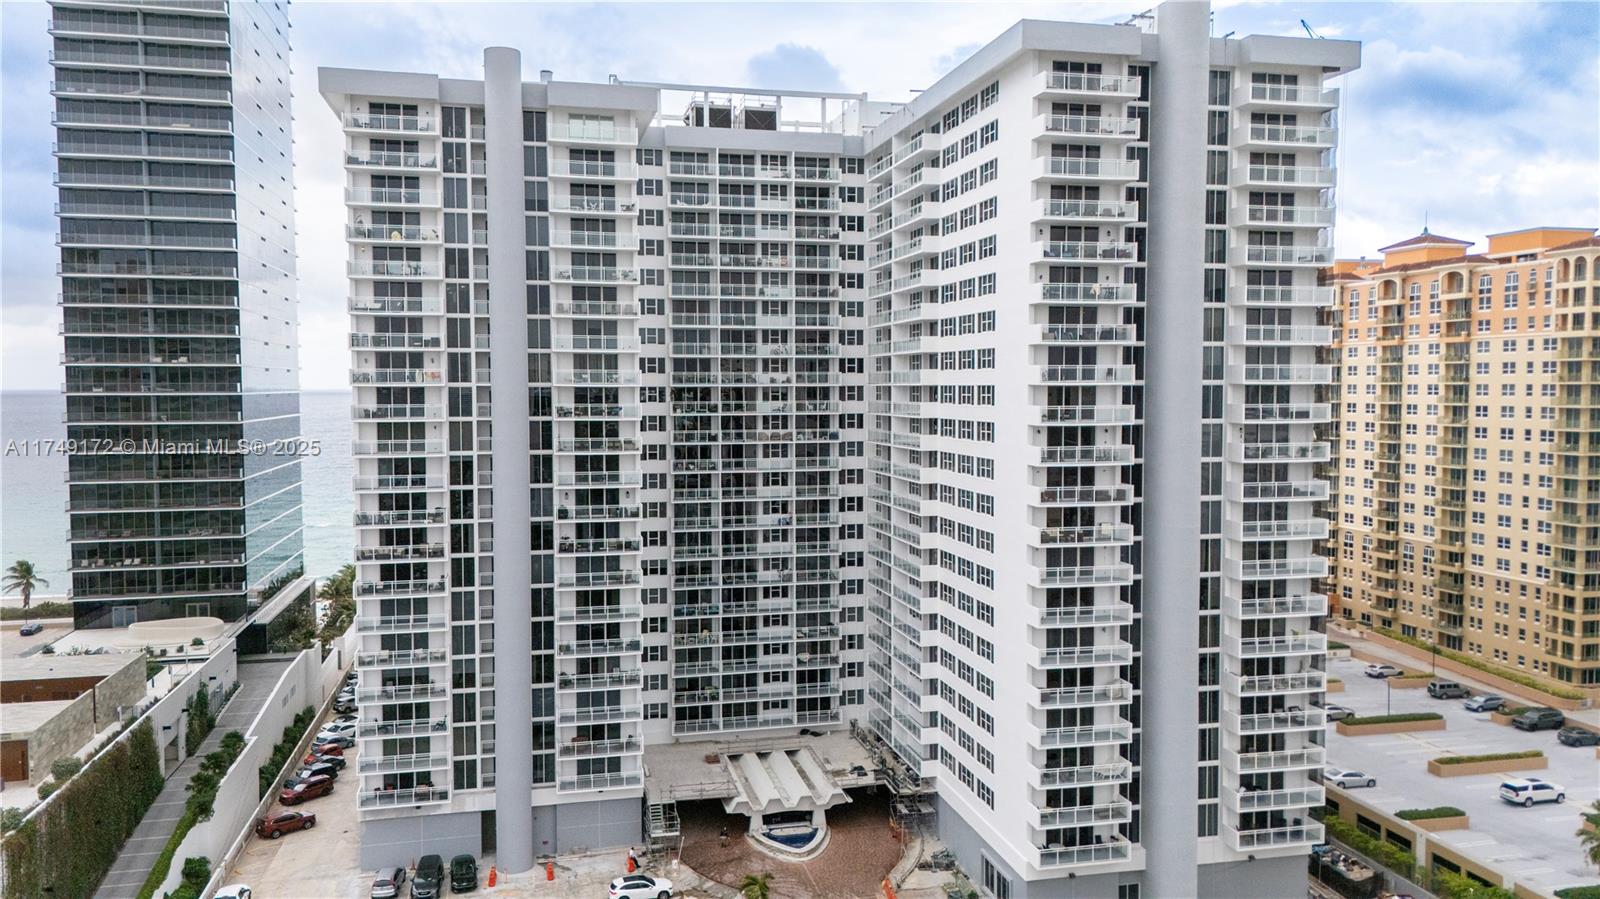
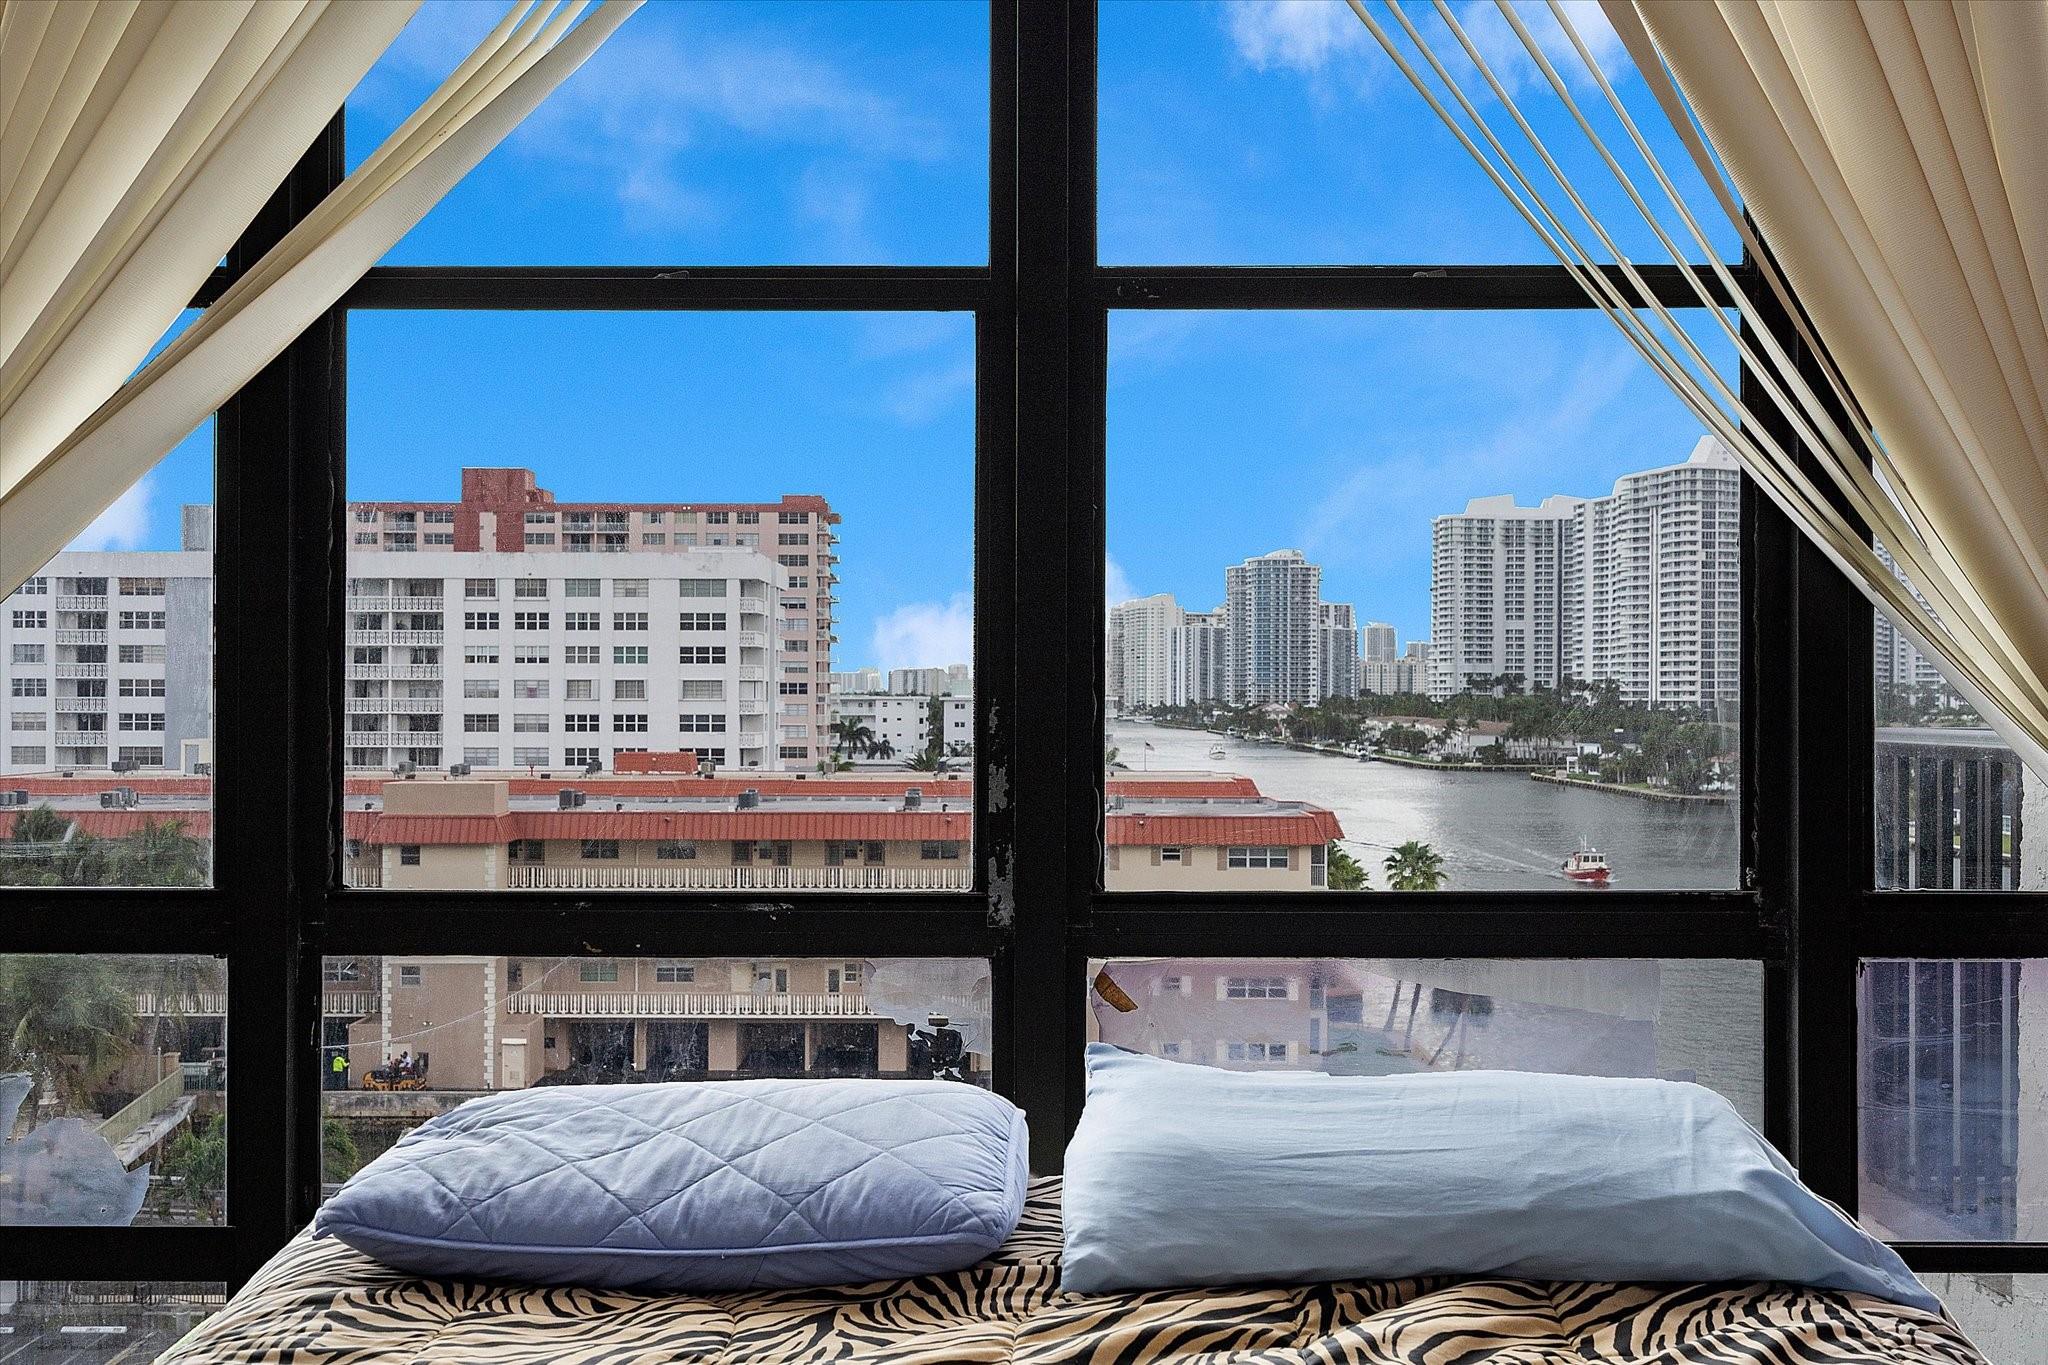
Pending
$230,000
2
bds
|
2
ba
|
924
sqft
|
built
1974
801 Three Islands Blvd, Hallandale Beach, FL 33009
$-616
Cash flow
-14.0%
Cash-on-Cash Return
2.9%
Cap rate
1.0%
Rent to Value Ratio

Active
$4,250,000
4
bds
|
4
ba
|
2,545
sqft
|
built
2023
2000 S Ocean Dr, Hallandale Beach, FL 33009
$-25,095
Cash flow
-30.8%
Cash-on-Cash Return
-0.9%
Cap rate
0.2%
Rent to Value Ratio
Active
$530,000
2
bds
|
2
ba
|
1,360
sqft
|
built
1974
2017 S Ocean Dr, Hallandale Beach, FL 33009
$-1,026
Cash flow
-10.1%
Cash-on-Cash Return
3.8%
Cap rate
0.7%
Rent to Value Ratio

Active
$749,000
1
bds
|
1
ba
|
871
sqft
|
built
2006
1830 S Ocean Dr, Hallandale Beach, FL 33009
$-2,062
Cash flow
-14.4%
Cash-on-Cash Return
2.8%
Cap rate
0.6%
Rent to Value Ratio

Active
$168,000
1
bds
|
1
ba
|
630
sqft
|
built
1964
455 Golden Isles Dr, Hallandale Beach, FL 33009
$-700
Cash flow
-21.7%
Cash-on-Cash Return
1.2%
Cap rate
1.1%
Rent to Value Ratio
Active
$474,900
2
bds
|
2
ba
|
1,270
sqft
|
built
1974
2049 S Ocean Dr, Hallandale Beach, FL 33009
$-892
Cash flow
-9.8%
Cash-on-Cash Return
3.9%
Cap rate
0.7%
Rent to Value Ratio
Active
$288,000
2
bds
|
2
ba
|
1,150
sqft
|
built
1970
200 Diplomat Pkwy, Hallandale Beach, FL 33009
$-1,077
Cash flow
-19.5%
Cash-on-Cash Return
1.7%
Cap rate
0.9%
Rent to Value Ratio
Active
$645,000
3
bds
|
3
ba
|
1,738
sqft
|
built
2007
1745 E Hallandale Beach Blvd, Hallandale Beach, FL 33009
$-2,267
Cash flow
-18.3%
Cash-on-Cash Return
1.9%
Cap rate
0.8%
Rent to Value Ratio
Active
$257,777
2
bds
|
2
ba
|
1,168
sqft
|
built
1967
180 NE 12th Ave, Hallandale Beach, FL 33009
$-649
Cash flow
-13.1%
Cash-on-Cash Return
3.1%
Cap rate
1.0%
Rent to Value Ratio
Active
$300,000
1
bds
|
2
ba
|
890
sqft
|
built
1965
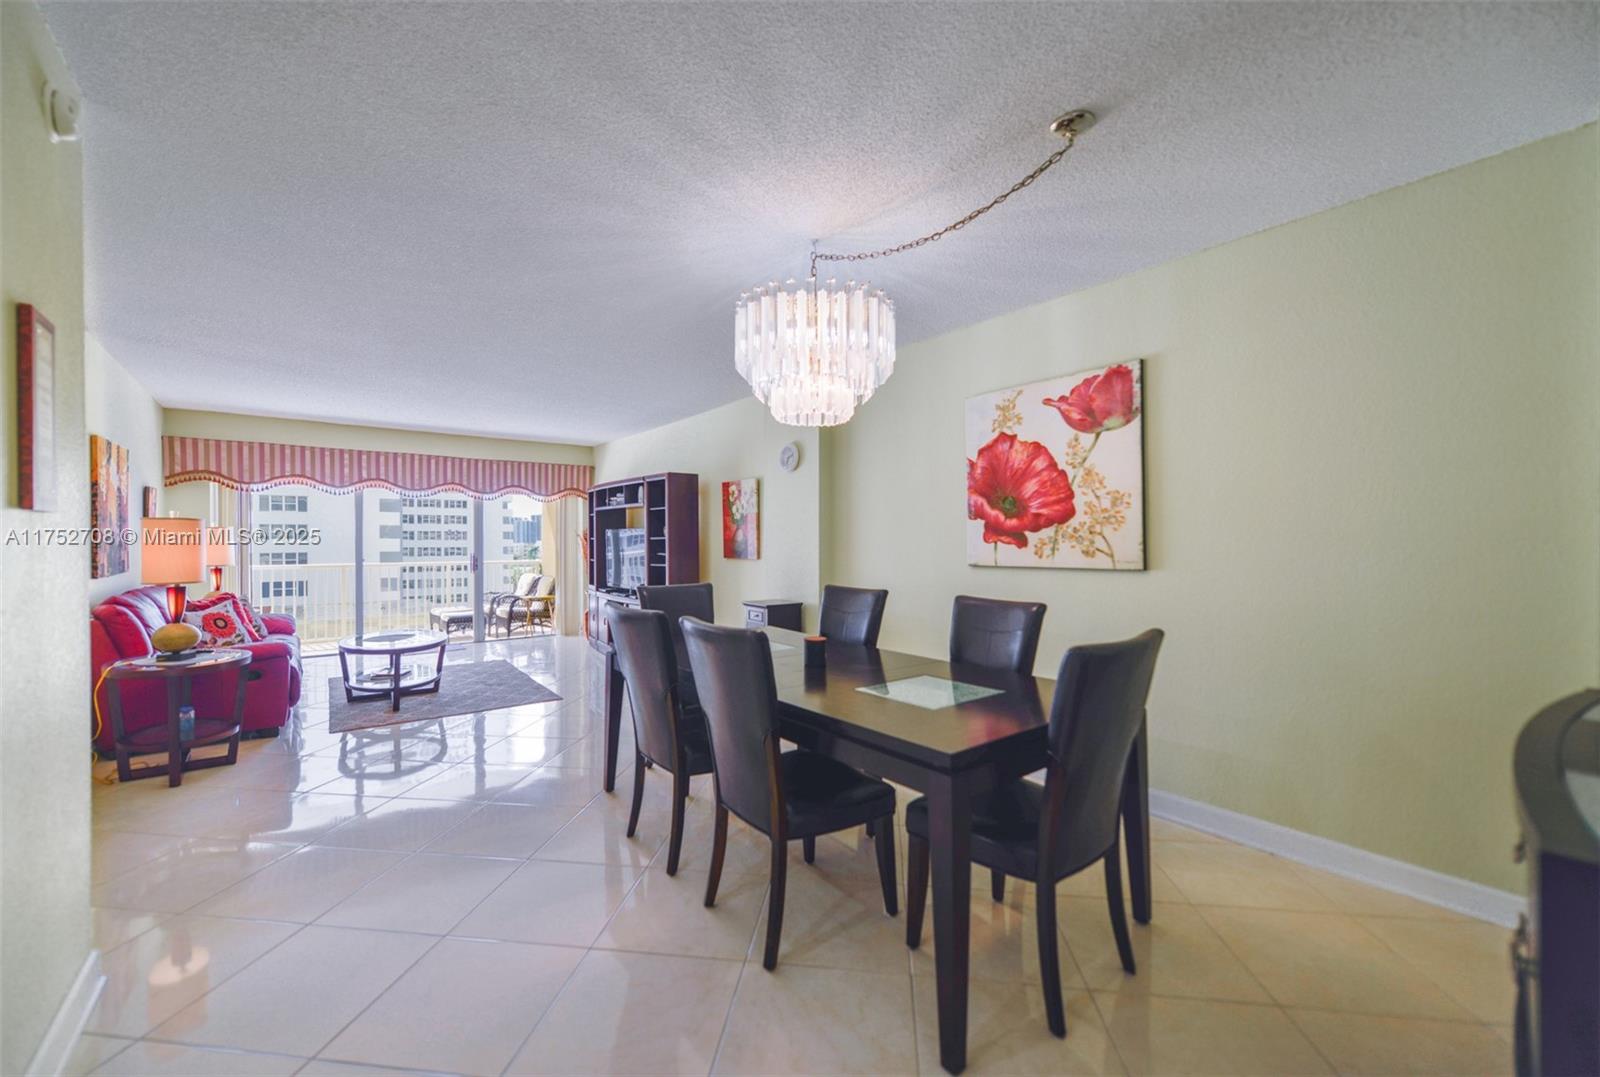
2600 Diana Dr, Hallandale Beach, FL 33009
$-798
Cash flow
-13.9%
Cash-on-Cash Return
3.0%
Cap rate
0.8%
Rent to Value Ratio
Active
$499,000
2
bds
|
2
ba
|
1,354
sqft
|
built
2007
1745 E Hallandale Beach Blvd, Hallandale Beach, FL 33009
$-2,593
Cash flow
-27.1%
Cash-on-Cash Return
-0.1%
Cap rate
0.6%
Rent to Value Ratio
Active
$239,000
1
bds
|
2
ba
|
1,140
sqft
|
built
1975
600 Three Islands Blvd, Hallandale Beach, FL 33009
$-720
Cash flow
-15.7%
Cash-on-Cash Return
2.5%
Cap rate
1.0%
Rent to Value Ratio

Active
$515,000
3
bds
|
2
ba
|
1,430
sqft
|
built
1976
1000 Parkview Dr, Hallandale Beach, FL 33009
$-2,122
Cash flow
-21.5%
Cash-on-Cash Return
1.2%
Cap rate
0.7%
Rent to Value Ratio

Active
$1,050,000
3
bds
|
3
ba
|
1,571
sqft
|
built
2006
1800 S Ocean Dr, Hallandale Beach, FL 33009
$-3,159
Cash flow
-15.7%
Cash-on-Cash Return
2.5%
Cap rate
0.8%
Rent to Value Ratio
Active under contract
$245,000
2
bds
|
2
ba
|
1,092
sqft
|
built
1970
301 NE 14th Ave, Hallandale Beach, FL 33009
$-676
Cash flow
-14.4%
Cash-on-Cash Return
2.8%
Cap rate
0.9%
Rent to Value Ratio
Active
$499,000
2
bds
|
2
ba
|
1,591
sqft
|
built
1984
300 Three Islands Blvd, Hallandale Beach, FL 33009
$-2,222
Cash flow
-23.2%
Cash-on-Cash Return
0.8%
Cap rate
0.7%
Rent to Value Ratio
Active
$469,000
2
bds
|
2
ba
|
1,376
sqft
|
built
2007
1745 E Hallandale Beach Blvd, Hallandale Beach, FL 33009
$-2,364
Cash flow
-26.3%
Cash-on-Cash Return
0.1%
Cap rate
0.7%
Rent to Value Ratio

Active
$385,000
2
bds
|
2
ba
|
1,240
sqft
|
built
1972
1985 S Ocean Dr, Hallandale Beach, FL 33009
$-1,604
Cash flow
-21.7%
Cash-on-Cash Return
1.1%
Cap rate
0.7%
Rent to Value Ratio
Active
$238,700
1
bds
|
1
ba
|
700
sqft
|
built
1980
1913 S Ocean Dr, Hallandale Beach, FL 33009
$-758
Cash flow
-16.6%
Cash-on-Cash Return
2.3%
Cap rate
0.8%
Rent to Value Ratio
Active
$420,000
2
bds
|
2
ba
|
1,455
sqft
|
built
1979
600 Parkview Dr, Hallandale Beach, FL 33009
$-1,376
Cash flow
-17.1%
Cash-on-Cash Return
2.2%
Cap rate
0.8%
Rent to Value Ratio
Active
$580,000
2
bds
|
2
ba
|
1,400
sqft
|
built
2004
201 Golden Isles Dr, Hallandale Beach, FL 33009
$-2,116
Cash flow
-19.0%
Cash-on-Cash Return
1.8%
Cap rate
0.6%
Rent to Value Ratio
Active
$384,000
2
bds
|
2
ba
|
1,200
sqft
|
built
1970
1849 S Ocean Dr, Hallandale Beach, FL 33009
$-871
Cash flow
-11.8%
Cash-on-Cash Return
3.4%
Cap rate
0.8%
Rent to Value Ratio
Active
$400,000
3
bds
|
3
ba
|
1,780
sqft
|
built
1972
1985 S Ocean Dr, Hallandale Beach, FL 33009
$-1,477
Cash flow
-19.3%
Cash-on-Cash Return
1.7%
Cap rate
0.9%
Rent to Value Ratio
Active
$1,199,900
2
bds
|
2
ba
|
1,782
sqft
|
built
2006
1800 S Ocean Dr, Hallandale Beach, FL 33009
$-5,092
Cash flow
-22.1%
Cash-on-Cash Return
1.1%
Cap rate
0.6%
Rent to Value Ratio

Active
$289,000
2
bds
|
2
ba
|
1,700
sqft
|
built
1974
500 Three Islands Blvd, Hallandale Beach, FL 33009
$-1,054
Cash flow
-19.0%
Cash-on-Cash Return
1.8%
Cap rate
1.1%
Rent to Value Ratio
Active
$628,000
2
bds
|
2
ba
|
1,440
sqft
|
built
1974
1880 S Ocean Dr, Hallandale Beach, FL 33009
$-2,578
Cash flow
-21.4%
Cash-on-Cash Return
1.2%
Cap rate
0.6%
Rent to Value Ratio

Active
$360,000
2
bds
|
2
ba
|
1,100
sqft
|
built
1972
1833 S Ocean Dr, Hallandale Beach, FL 33009
$-1,204
Cash flow
-17.4%
Cash-on-Cash Return
2.1%
Cap rate
0.8%
Rent to Value Ratio