Hallandale Beach, FL Investment Properties for Sale
Browse homes for sale and investment properties in Hallandale Beach, FL. Refine your search by price, property type, or more.
Best cash flowing properties in Hallandale Beach, FL
Active
$165,000
1
bds
|
1
ba
|
678
sqft
|
built
1967
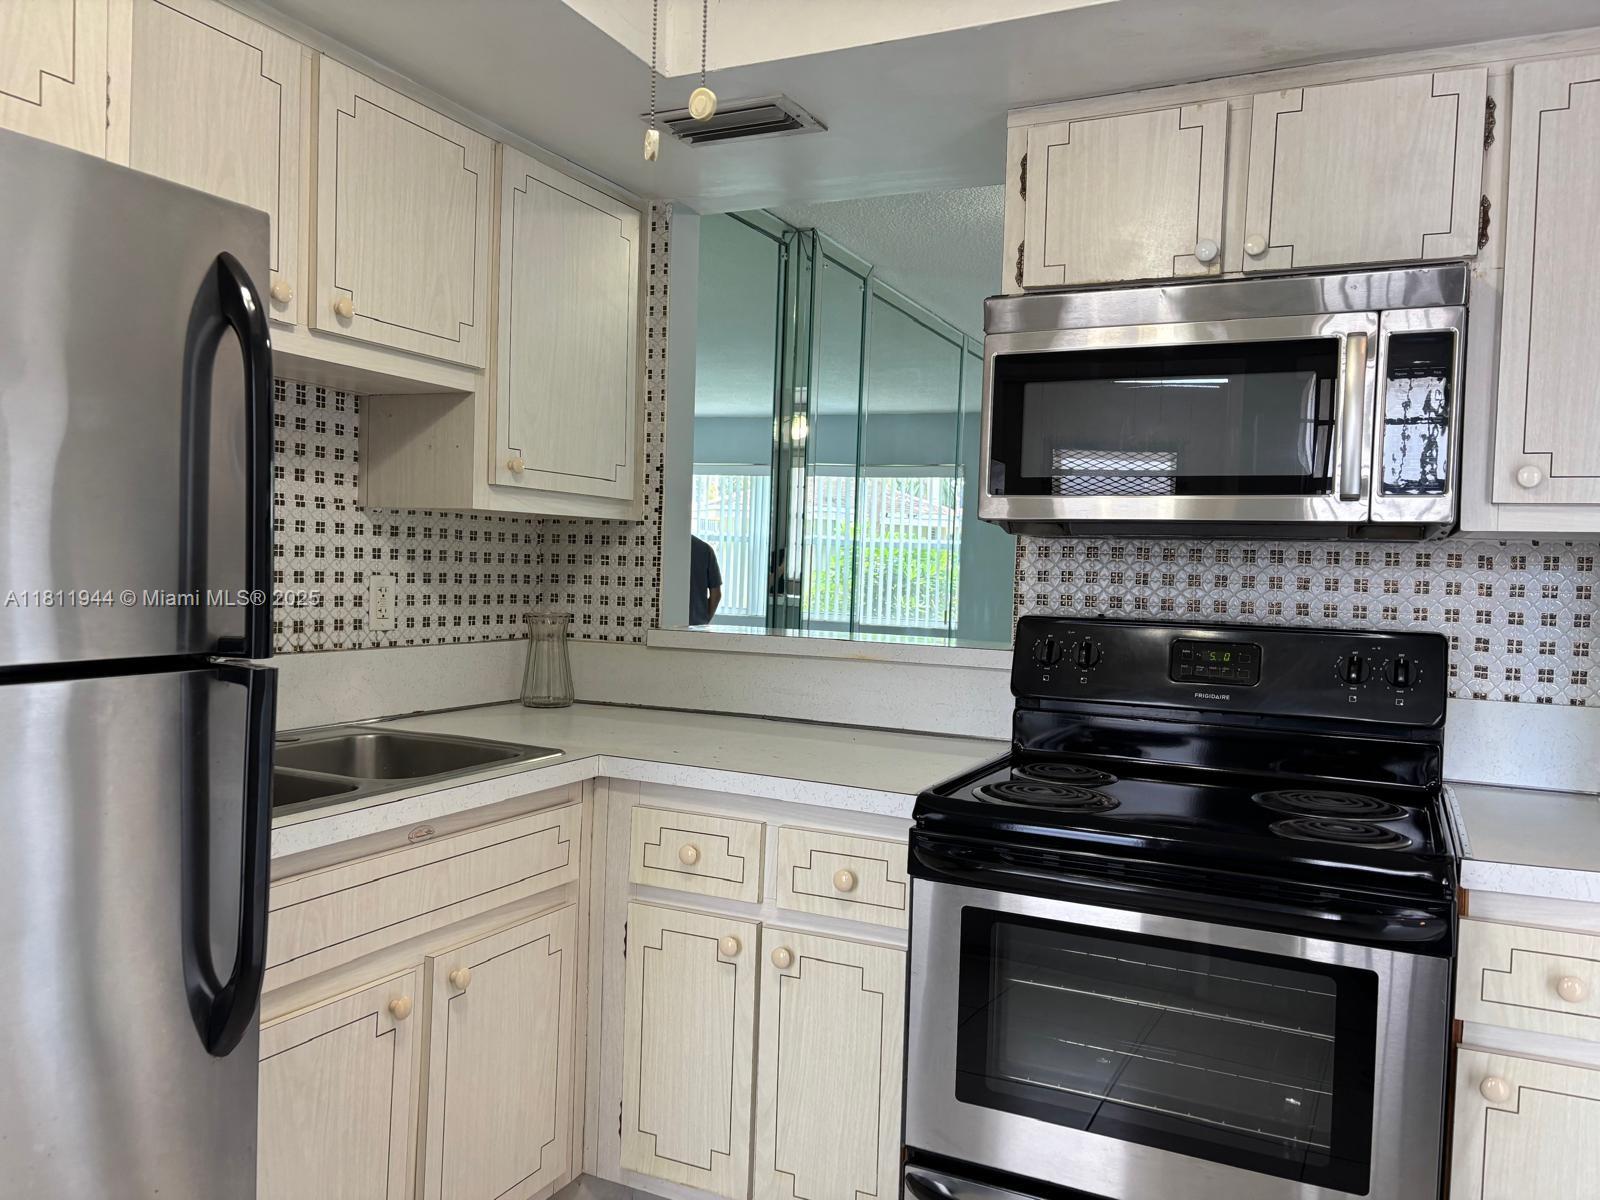
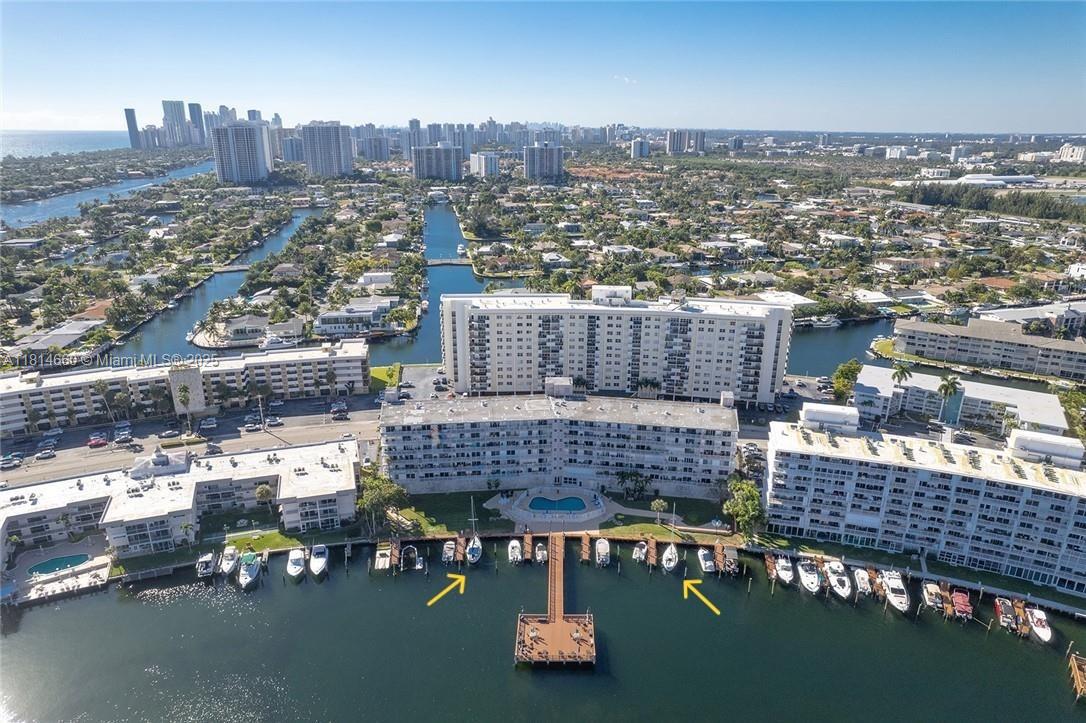
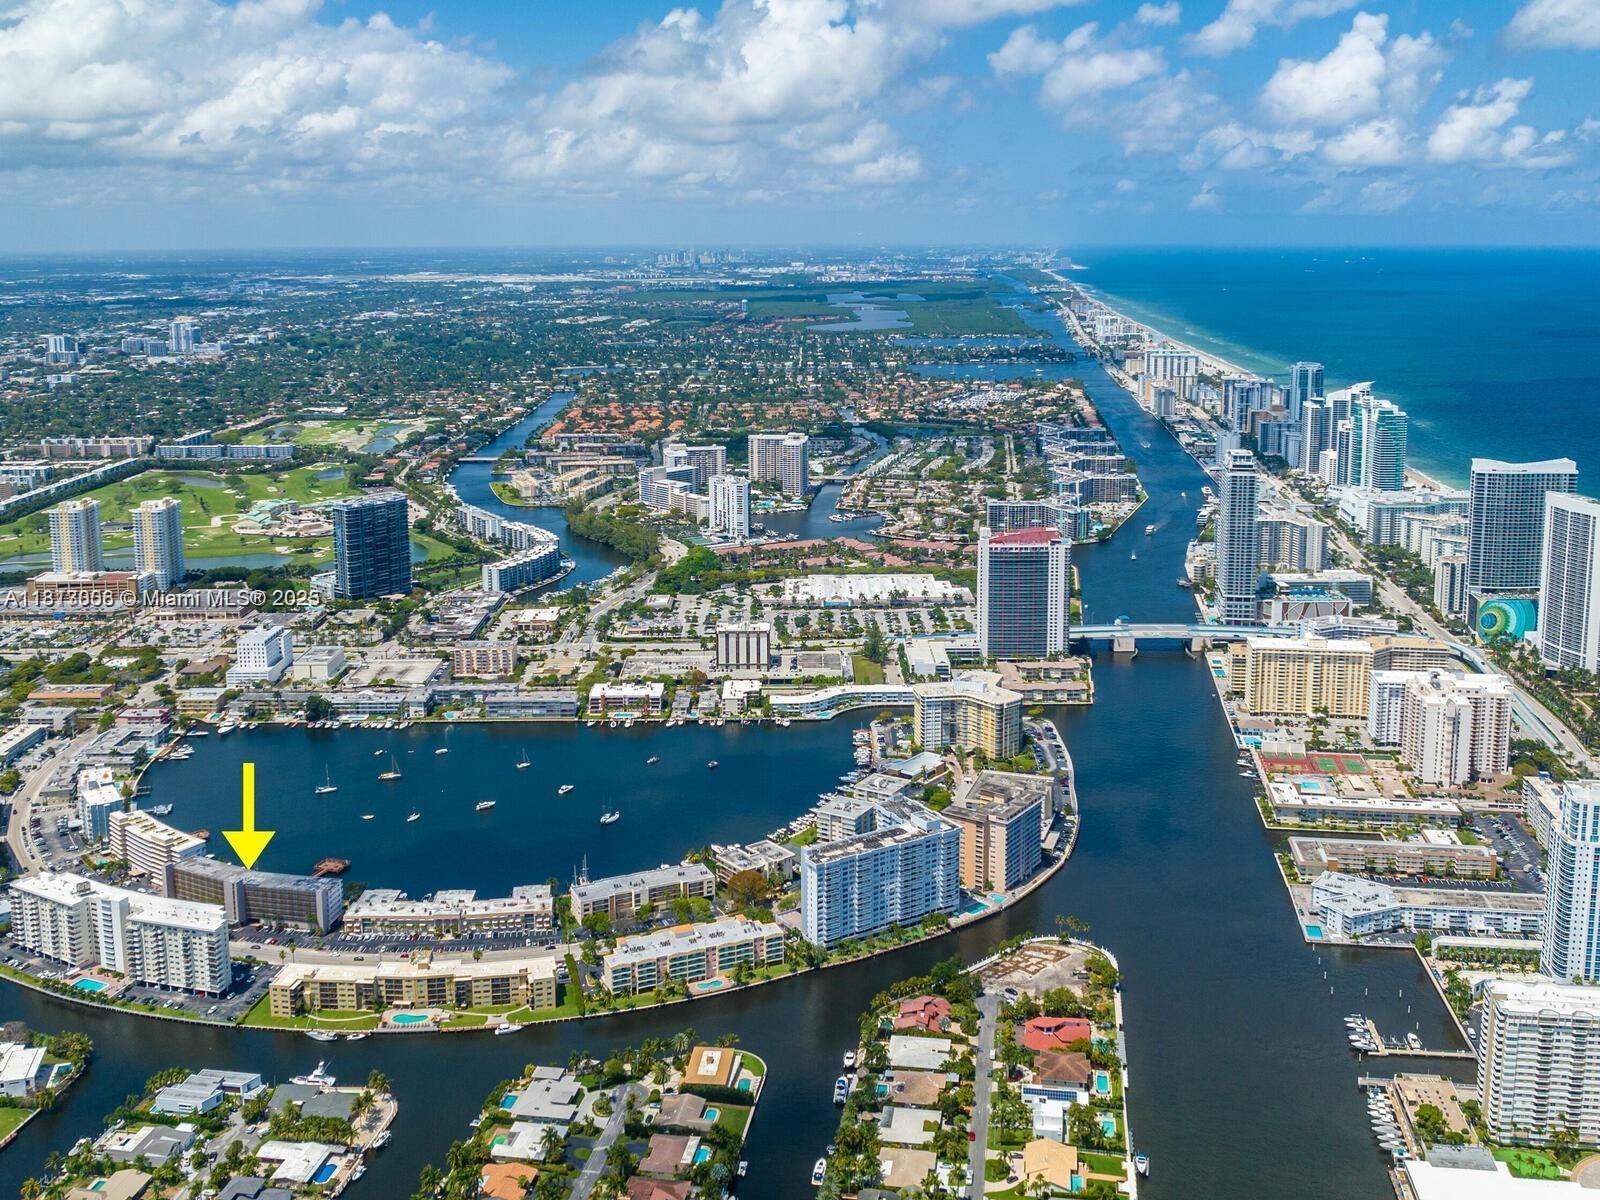
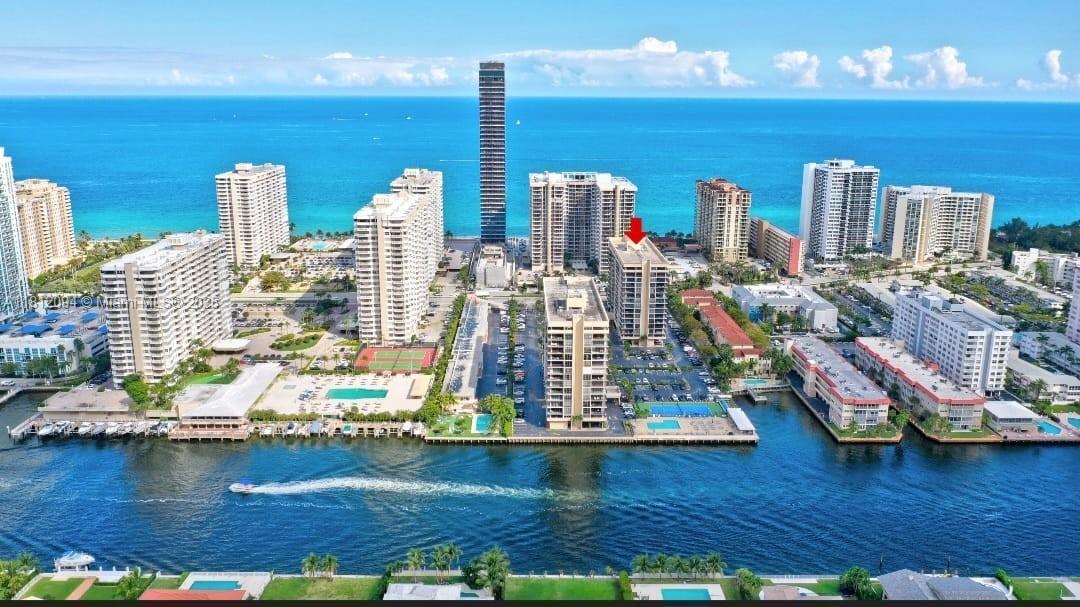
1333 E Hallandale Beach Blvd, Hallandale Beach, FL 33009
$17
Cash flow
0.5%
Cash-on-Cash Return
6.3%
Cap rate
1.2%
Rent to Value Ratio

Active
$245,000
1
bds
|
2
ba
|
1,130
sqft
|
built
1976
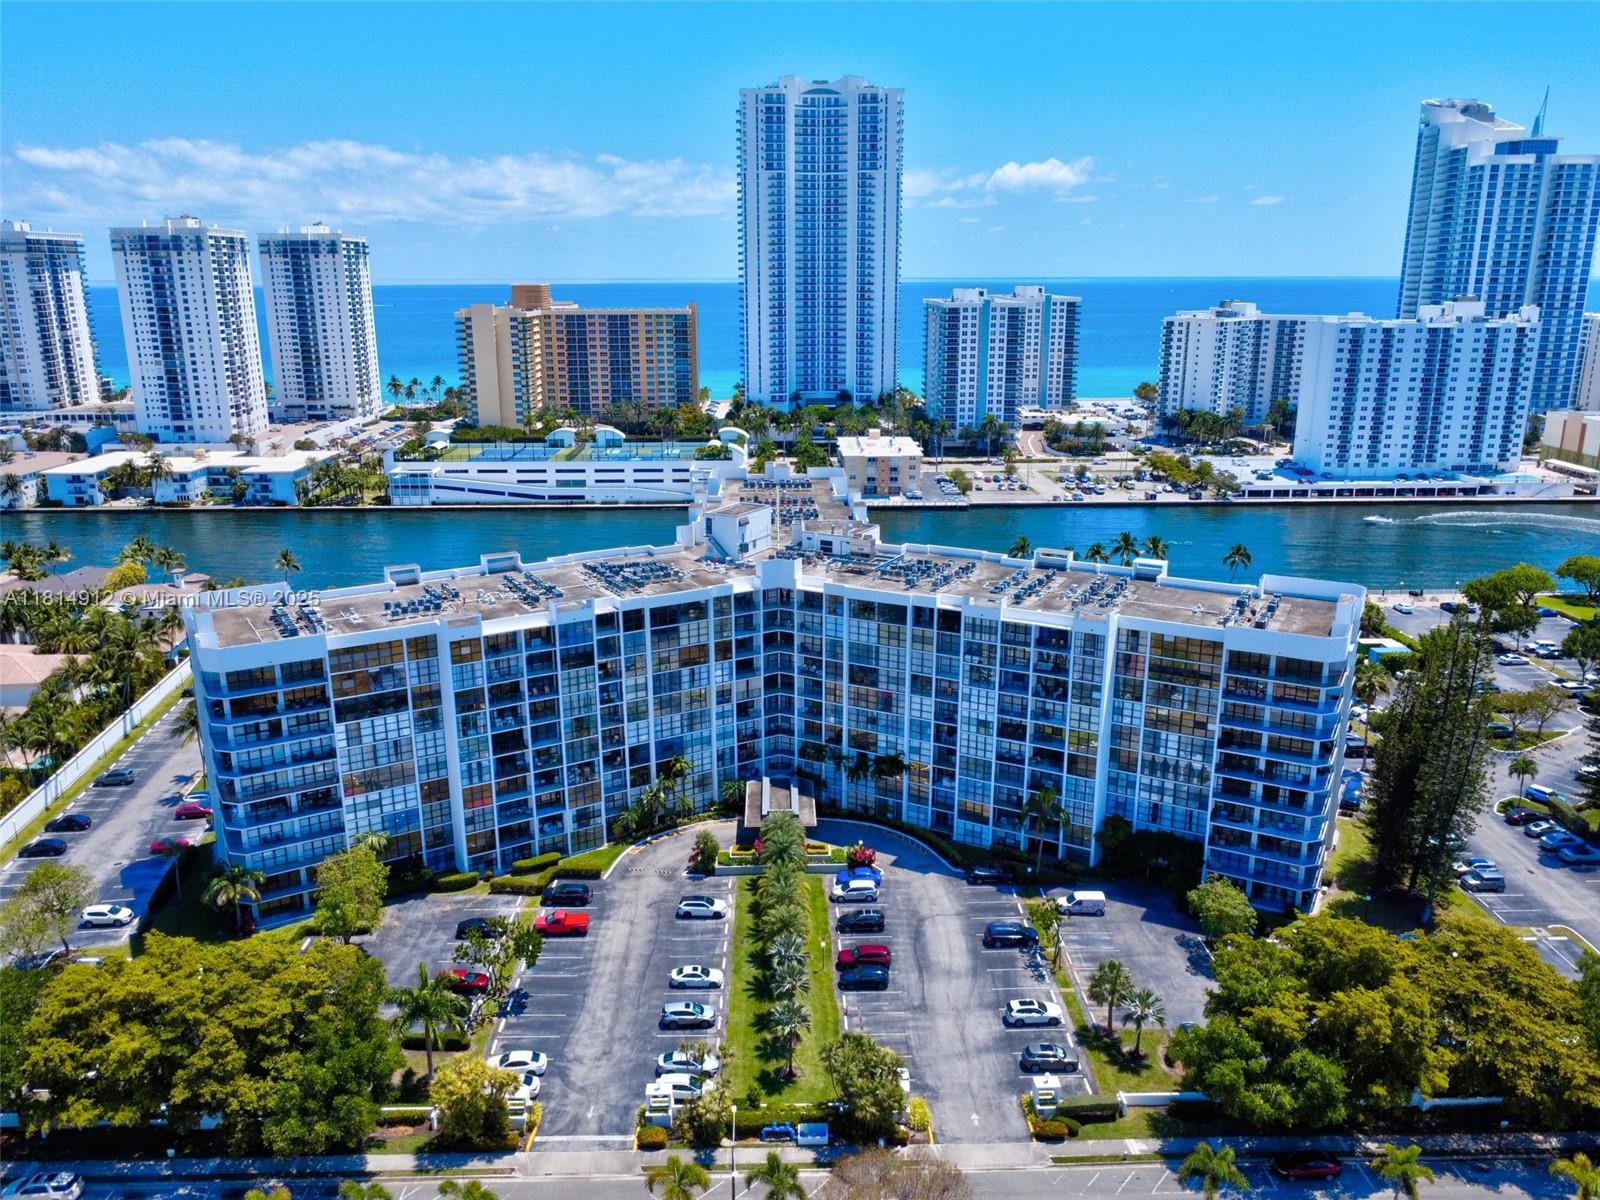
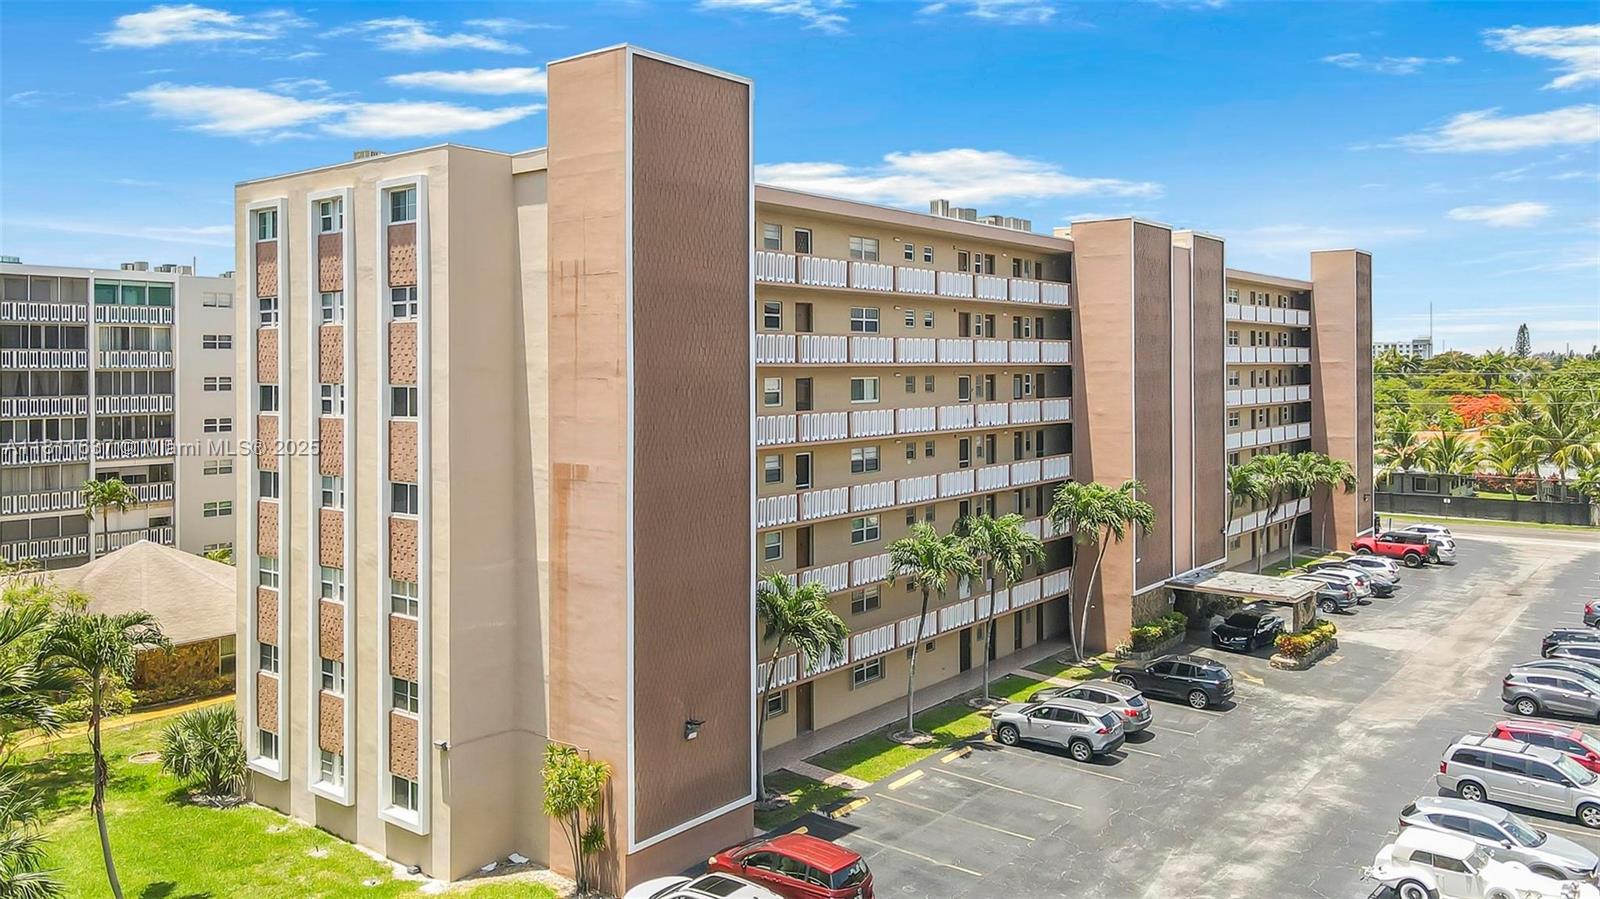
800 Parkview Dr, Hallandale Beach, FL 33009
$-17
Cash flow
-0.4%
Cash-on-Cash Return
6.1%
Cap rate
1.0%
Rent to Value Ratio
858 out of 959 properties for sale in Hallandale Beach, FL
Limited Results Shown
Create a free account, or log in to reveal all property listings and enjoy the complete experience.
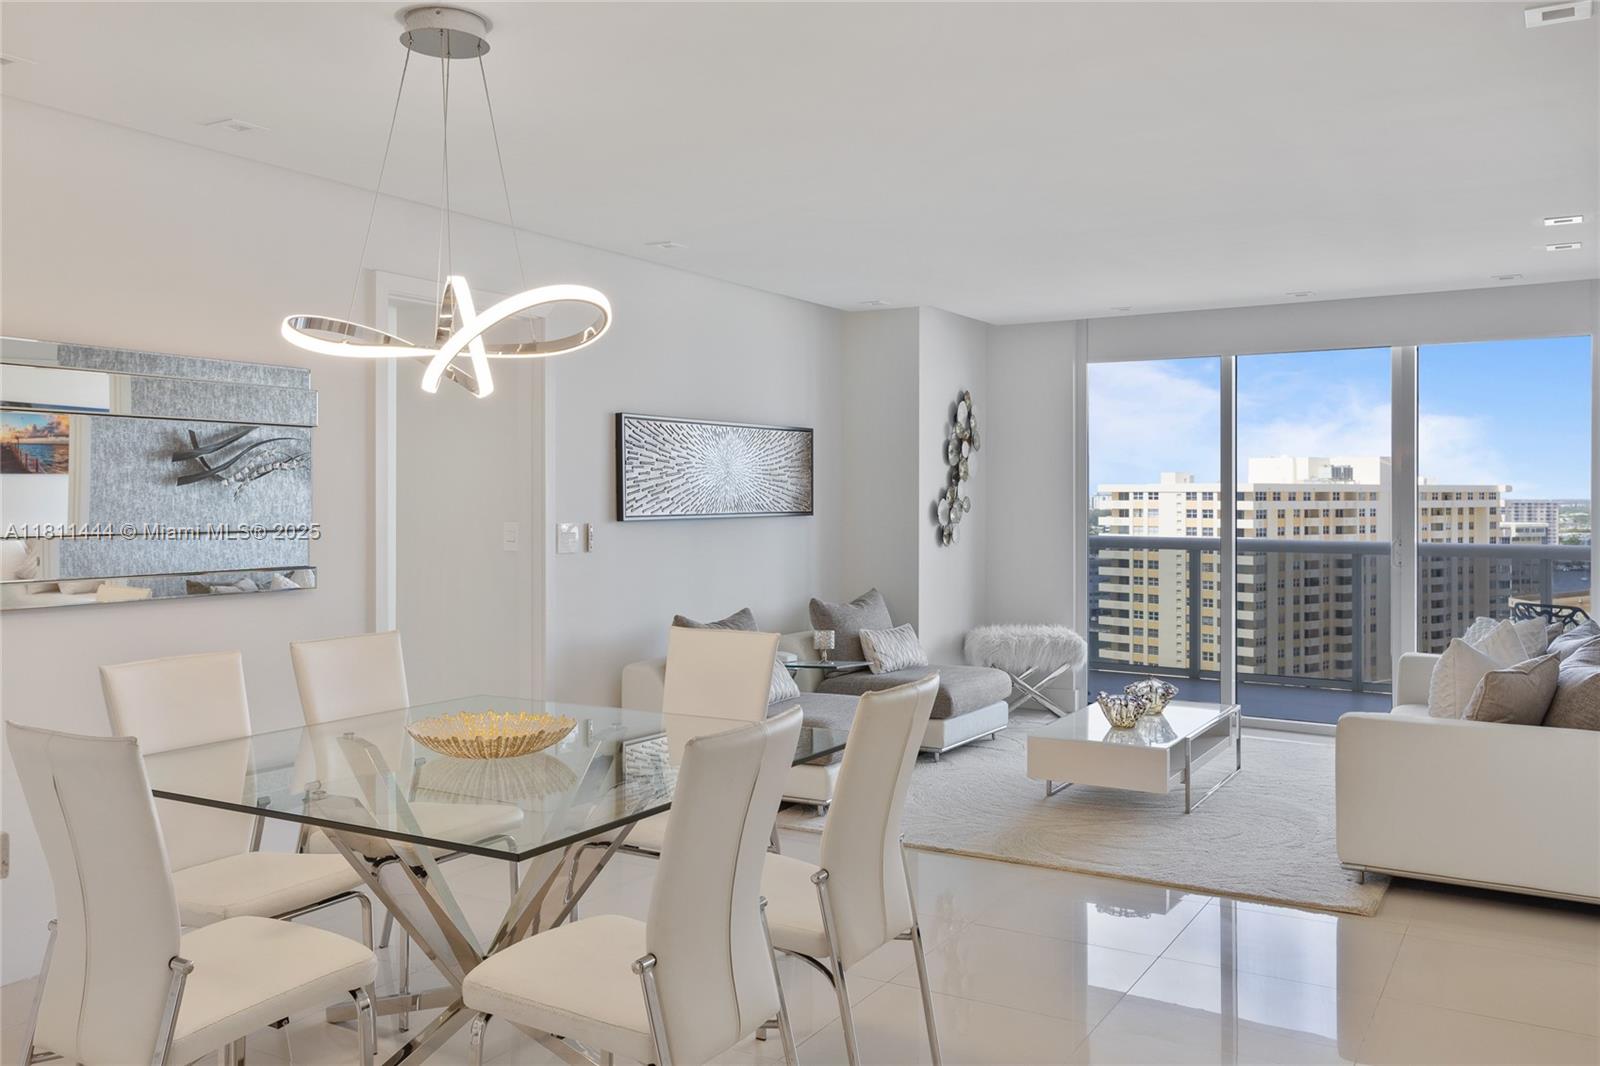
Active
$1,050,000
3
bds
|
3
ba
|
1,571
sqft
|
built
2006
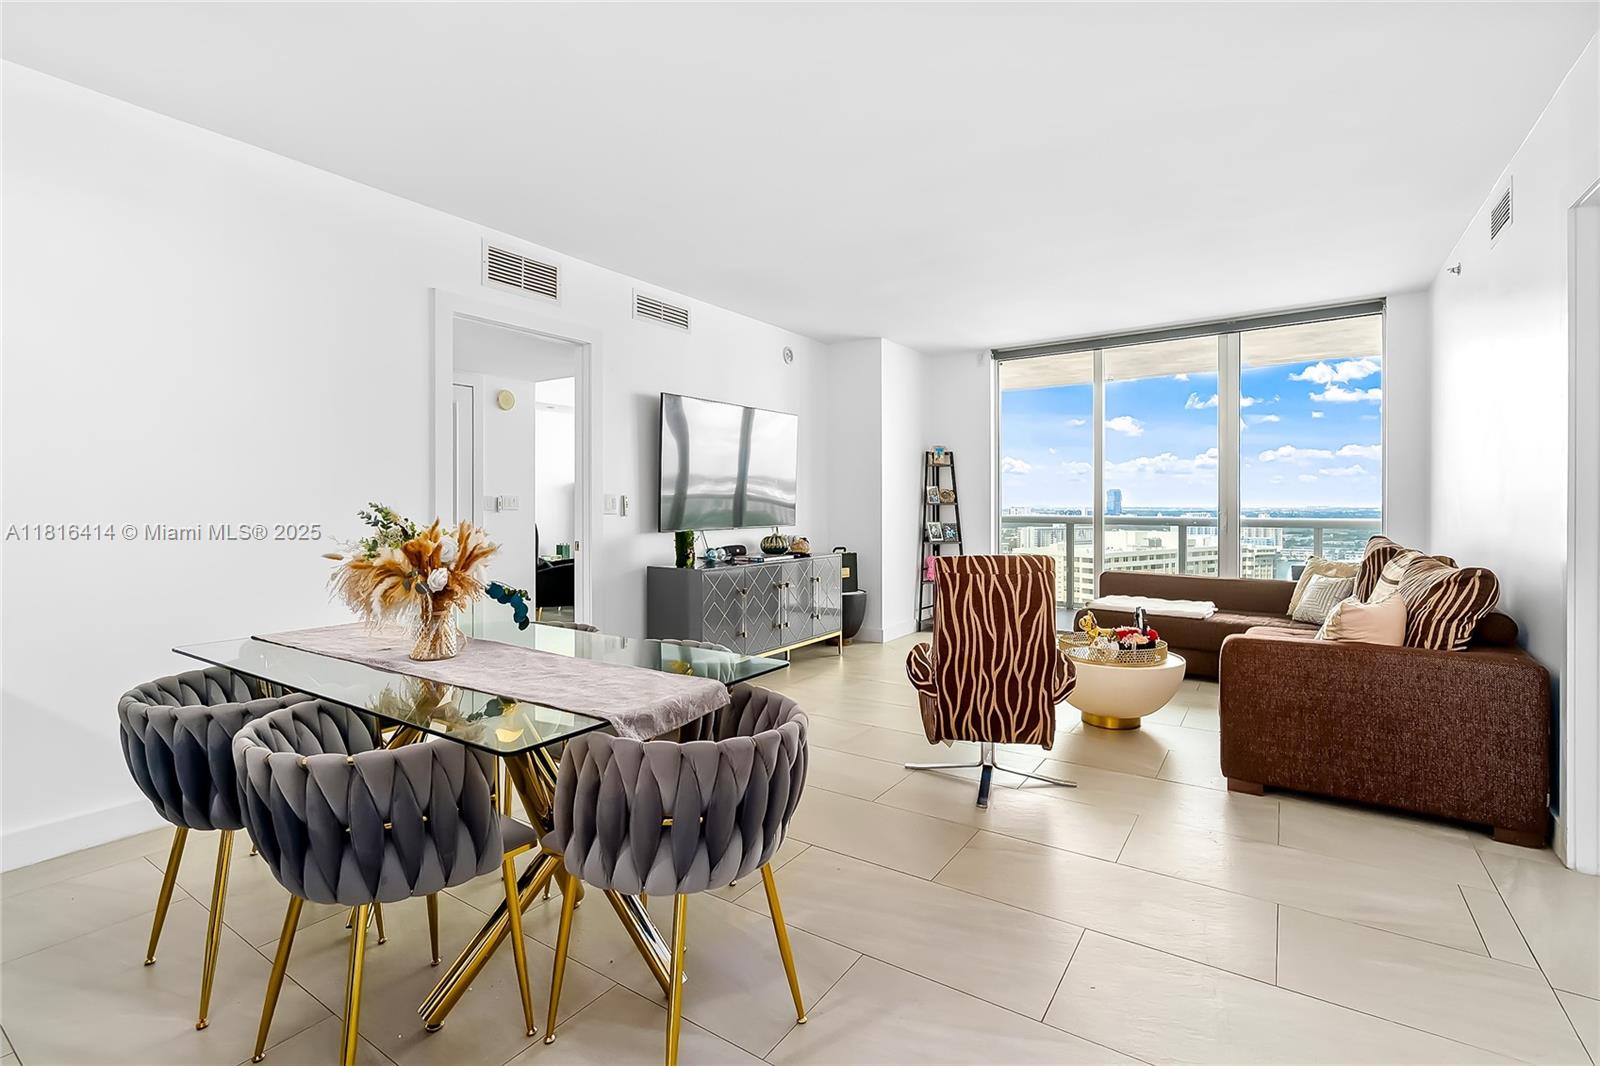
1800 S Ocean Dr, Hallandale Beach, FL 33009
$-4,455
Cash flow
-22.1%
Cash-on-Cash Return
1.1%
Cap rate
0.6%
Rent to Value Ratio
Active
$349,000
2
bds
|
2
ba
|
1,130
sqft
|
built
1976
1000 Parkview Dr, Hallandale Beach, FL 33009
$-1,311
Cash flow
-19.6%
Cash-on-Cash Return
1.6%
Cap rate
0.8%
Rent to Value Ratio
Active
$240,000
1
bds
|
2
ba
|
1,217
sqft
|
built
1974
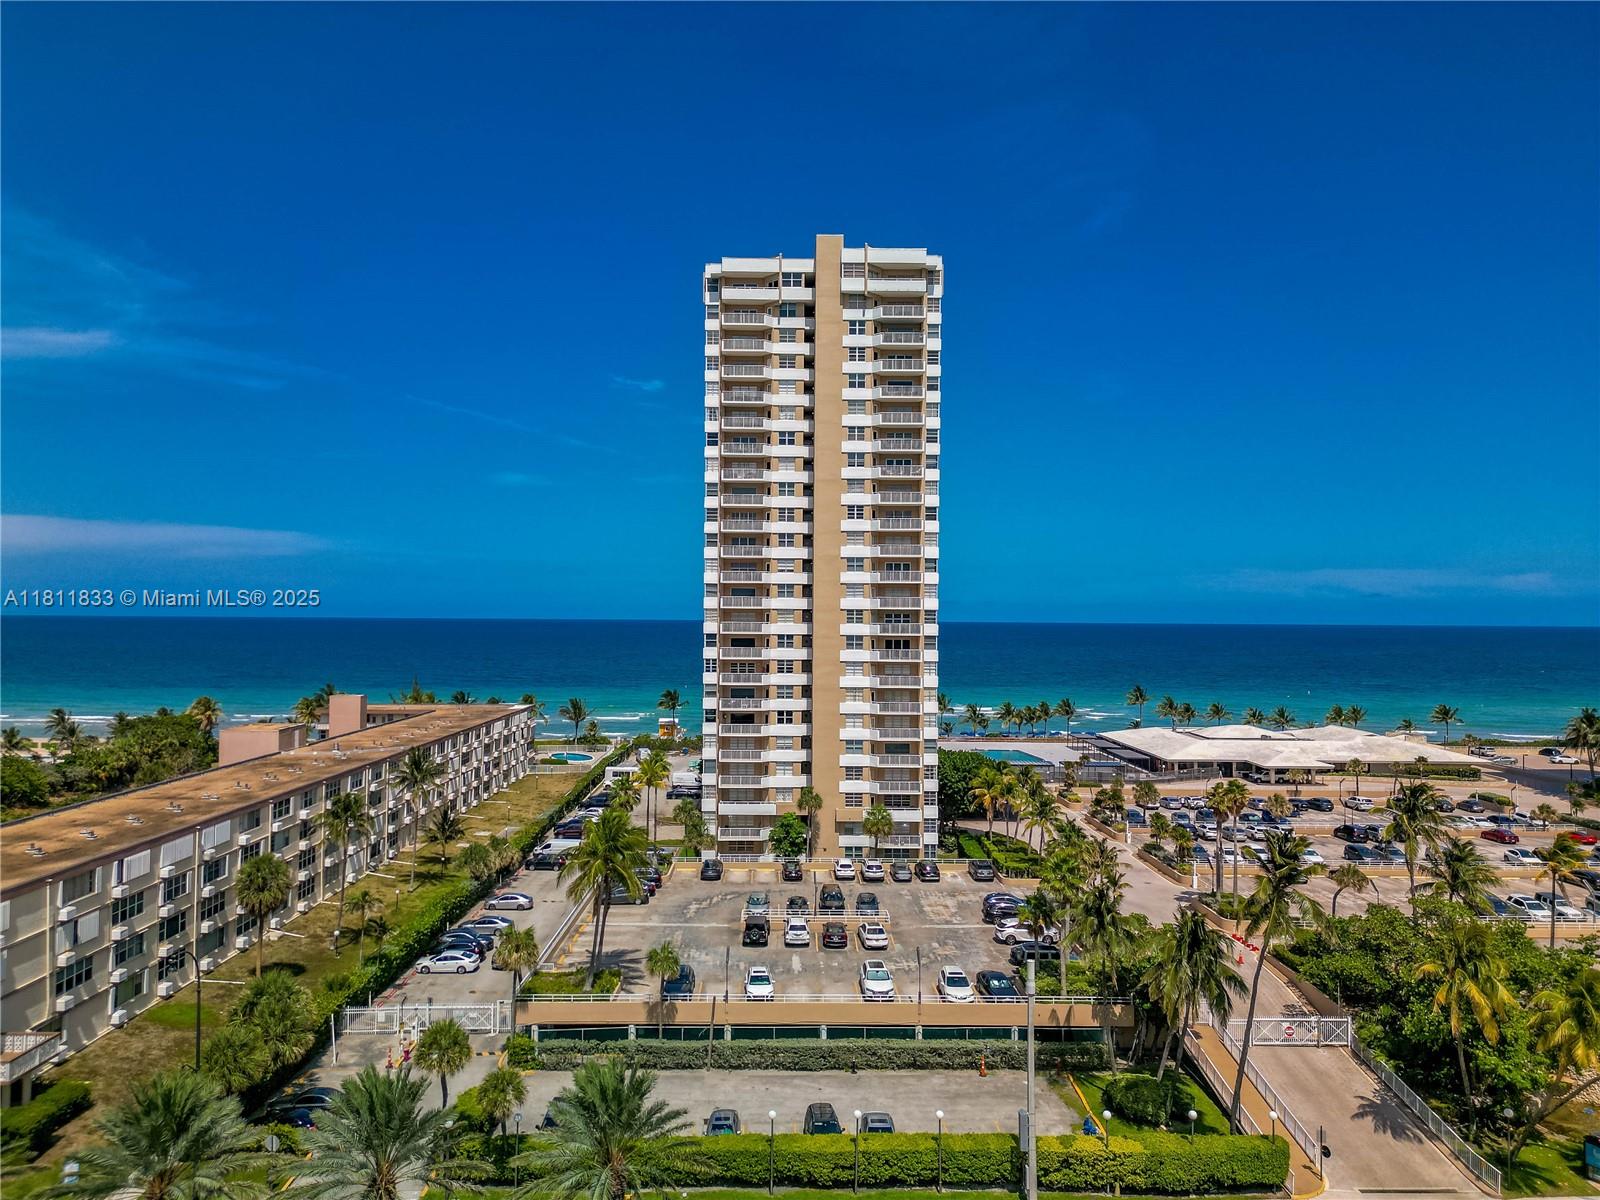
1865 S Ocean Dr, Hallandale Beach, FL 33009
$-1,459
Cash flow
-31.7%
Cash-on-Cash Return
-1.2%
Cap rate
0.8%
Rent to Value Ratio

Active
$485,000
2
bds
|
2
ba
|
1,080
sqft
|
built
1967
120 Golden Isles Dr, Hallandale Beach, FL 33009
$-2,048
Cash flow
-22.0%
Cash-on-Cash Return
1.1%
Cap rate
0.5%
Rent to Value Ratio
Active
$375,000
2
bds
|
2
ba
|
1,030
sqft
|
built
1963
400 Golden Isles Dr, Hallandale Beach, FL 33009
$-1,369
Cash flow
-19.0%
Cash-on-Cash Return
1.8%
Cap rate
0.7%
Rent to Value Ratio
Active
$875,000
bds
|
0
ba
|
2,375
sqft
|
built
1960
737 NW 6th St, Hallandale Beach, FL 33009
$-3,703
Cash flow
-22.1%
Cash-on-Cash Return
1.1%
Cap rate
0.2%
Rent to Value Ratio
Active
$410,000
2
bds
|
2
ba
|
1,135
sqft
|
built
1970
400 Diplomat Pkwy, Hallandale Beach, FL 33009
$-1,150
Cash flow
-14.6%
Cash-on-Cash Return
2.8%
Cap rate
0.7%
Rent to Value Ratio
Active
$599,000
2
bds
|
2
ba
|
1,312
sqft
|
built
1970
2030 S Ocean Dr, Hallandale Beach, FL 33009
$-2,642
Cash flow
-23.0%
Cash-on-Cash Return
0.9%
Cap rate
0.6%
Rent to Value Ratio
Active
$339,000
2
bds
|
2
ba
|
1,400
sqft
|
built
1974
500 Three Islands Blvd, Hallandale Beach, FL 33009
$-110
Cash flow
-1.7%
Cash-on-Cash Return
5.8%
Cap rate
0.8%
Rent to Value Ratio
Active
$400,000
2
bds
|
2
ba
|
1,500
sqft
|
built
1974
500 Three Islands Blvd, Hallandale Beach, FL 33009
$-2,006
Cash flow
-26.2%
Cash-on-Cash Return
0.1%
Cap rate
0.8%
Rent to Value Ratio
Active
$220,000
1
bds
|
1
ba
|
683
sqft
|
built
1968
705 NE 2nd St, Hallandale Beach, FL 33009
$-295
Cash flow
-7.0%
Cash-on-Cash Return
4.5%
Cap rate
0.9%
Rent to Value Ratio
Active
$700,000
4
bds
|
2
ba
|
0
sqft
|
built
1958
411 SW 10th Ter, Hallandale Beach, FL 33009
$-1,886
Cash flow
-14.1%
Cash-on-Cash Return
2.9%
Cap rate
0.5%
Rent to Value Ratio
Active
$950,000
3
bds
|
3
ba
|
1,737
sqft
|
built
2013
2600 E Hallandale Beach Blvd, Hallandale Beach, FL 33009
$-3,551
Cash flow
-19.5%
Cash-on-Cash Return
1.7%
Cap rate
0.7%
Rent to Value Ratio
Active
$600,000
2
bds
|
1
ba
|
1,086
sqft
|
built
2006
1800 S Ocean Dr, Hallandale Beach, FL 33009
$-2,371
Cash flow
-20.6%
Cash-on-Cash Return
1.4%
Cap rate
0.7%
Rent to Value Ratio
Active
$850,000
3
bds
|
3
ba
|
1,740
sqft
|
built
1972
1985 S Ocean Dr, Hallandale Beach, FL 33009
$-2,921
Cash flow
-17.9%
Cash-on-Cash Return
2.0%
Cap rate
0.7%
Rent to Value Ratio

Active
$375,000
2
bds
|
2
ba
|
1,100
sqft
|
built
1972
1833 S Ocean Dr, Hallandale Beach, FL 33009
$-1,469
Cash flow
-20.4%
Cash-on-Cash Return
1.4%
Cap rate
0.7%
Rent to Value Ratio
Active
$1,515,000
3
bds
|
3
ba
|
1,733
sqft
|
built
2006
1830 S Ocean Dr, Hallandale Beach, FL 33009
$-6,250
Cash flow
-21.5%
Cash-on-Cash Return
1.2%
Cap rate
0.4%
Rent to Value Ratio
Active
$695,000
4
bds
|
3
ba
|
1,681
sqft
|
built
1956
100 NW 8th Ave, Hallandale Beach, FL 33009
$-2,098
Cash flow
-15.7%
Cash-on-Cash Return
2.5%
Cap rate
0.4%
Rent to Value Ratio
Active
$245,000
1
bds
|
2
ba
|
1,130
sqft
|
built
1976
800 Parkview Dr, Hallandale Beach, FL 33009
$-17
Cash flow
-0.4%
Cash-on-Cash Return
6.1%
Cap rate
1.0%
Rent to Value Ratio

Active
$300,000
2
bds
|
2
ba
|
1,092
sqft
|
built
1969
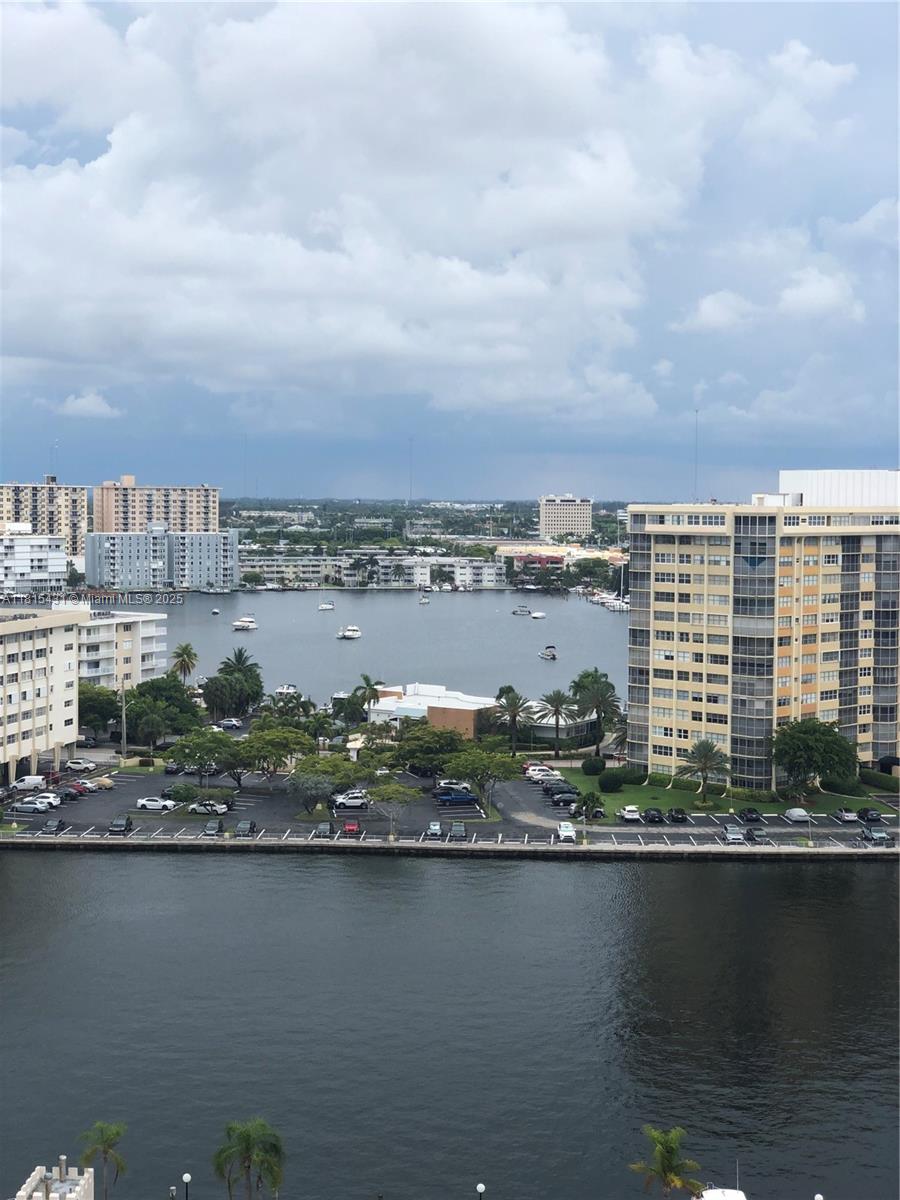
620 NE 12th Ave, Hallandale Beach, FL 33009
$-688
Cash flow
-12.0%
Cash-on-Cash Return
3.4%
Cap rate
0.8%
Rent to Value Ratio
Active
$2,450,000
3
bds
|
3
ba
|
2,065
sqft
|
built
2006
1830 S Ocean Dr, Hallandale Beach, FL 33009
$-13,069
Cash flow
-27.8%
Cash-on-Cash Return
-0.3%
Cap rate
0.3%
Rent to Value Ratio
Active
$500,000
2
bds
|
3
ba
|
1,696
sqft
|
built
1977
2418 NE 10th St, Hallandale Beach, FL 33009
$-1,629
Cash flow
-17.0%
Cash-on-Cash Return
2.2%
Cap rate
0.7%
Rent to Value Ratio
Active
$645,000
3
bds
|
2
ba
|
1,662
sqft
|
built
1955
913 NE 5th St, Hallandale Beach, FL 33009
$-1,460
Cash flow
-11.8%
Cash-on-Cash Return
3.4%
Cap rate
0.6%
Rent to Value Ratio
Active
$350,000
2
bds
|
2
ba
|
1,030
sqft
|
built
1963
400 Golden Isles Dr, Hallandale Beach, FL 33009
$-1,276
Cash flow
-19.0%
Cash-on-Cash Return
1.8%
Cap rate
0.8%
Rent to Value Ratio
Active
$419,000
2
bds
|
2
ba
|
1,270
sqft
|
built
1974
2049 S Ocean Dr, Hallandale Beach, FL 33009
$-1,300
Cash flow
-16.2%
Cash-on-Cash Return
2.4%
Cap rate
0.8%
Rent to Value Ratio
Active
$565,000
2
bds
|
2
ba
|
1,340
sqft
|
built
1971
1950 S Ocean Dr, Hallandale Beach, FL 33009
$-1,278
Cash flow
-11.8%
Cash-on-Cash Return
3.4%
Cap rate
0.6%
Rent to Value Ratio
Active
$249,000
2
bds
|
2
ba
|
1,092
sqft
|
built
1972
500 NE 12th Ave, Hallandale Beach, FL 33009
$-776
Cash flow
-16.3%
Cash-on-Cash Return
2.4%
Cap rate
0.9%
Rent to Value Ratio
Active
$4,475,000
3
bds
|
4
ba
|
2,913
sqft
|
built
2021
2000 S Ocean Dr, Hallandale Beach, FL 33009
$-20,162
Cash flow
-23.5%
Cash-on-Cash Return
0.7%
Cap rate
0.2%
Rent to Value Ratio
Active
$165,000
1
bds
|
1
ba
|
678
sqft
|
built
1967
1333 E Hallandale Beach Blvd, Hallandale Beach, FL 33009
$17
Cash flow
0.5%
Cash-on-Cash Return
6.3%
Cap rate
1.2%
Rent to Value Ratio
Active
$599,000
2
bds
|
2
ba
|
1,240
sqft
|
built
1971
1950 S Ocean Dr, Hallandale Beach, FL 33009
$-2,354
Cash flow
-20.5%
Cash-on-Cash Return
1.4%
Cap rate
0.7%
Rent to Value Ratio
Active
$525,000
1
bds
|
2
ba
|
995
sqft
|
built
2007
1945 S Ocean Dr, Hallandale Beach, FL 33009
$-1,747
Cash flow
-17.4%
Cash-on-Cash Return
2.2%
Cap rate
0.7%
Rent to Value Ratio
Active
$575,000
2
bds
|
0
ba
|
0
sqft
|
built
1958
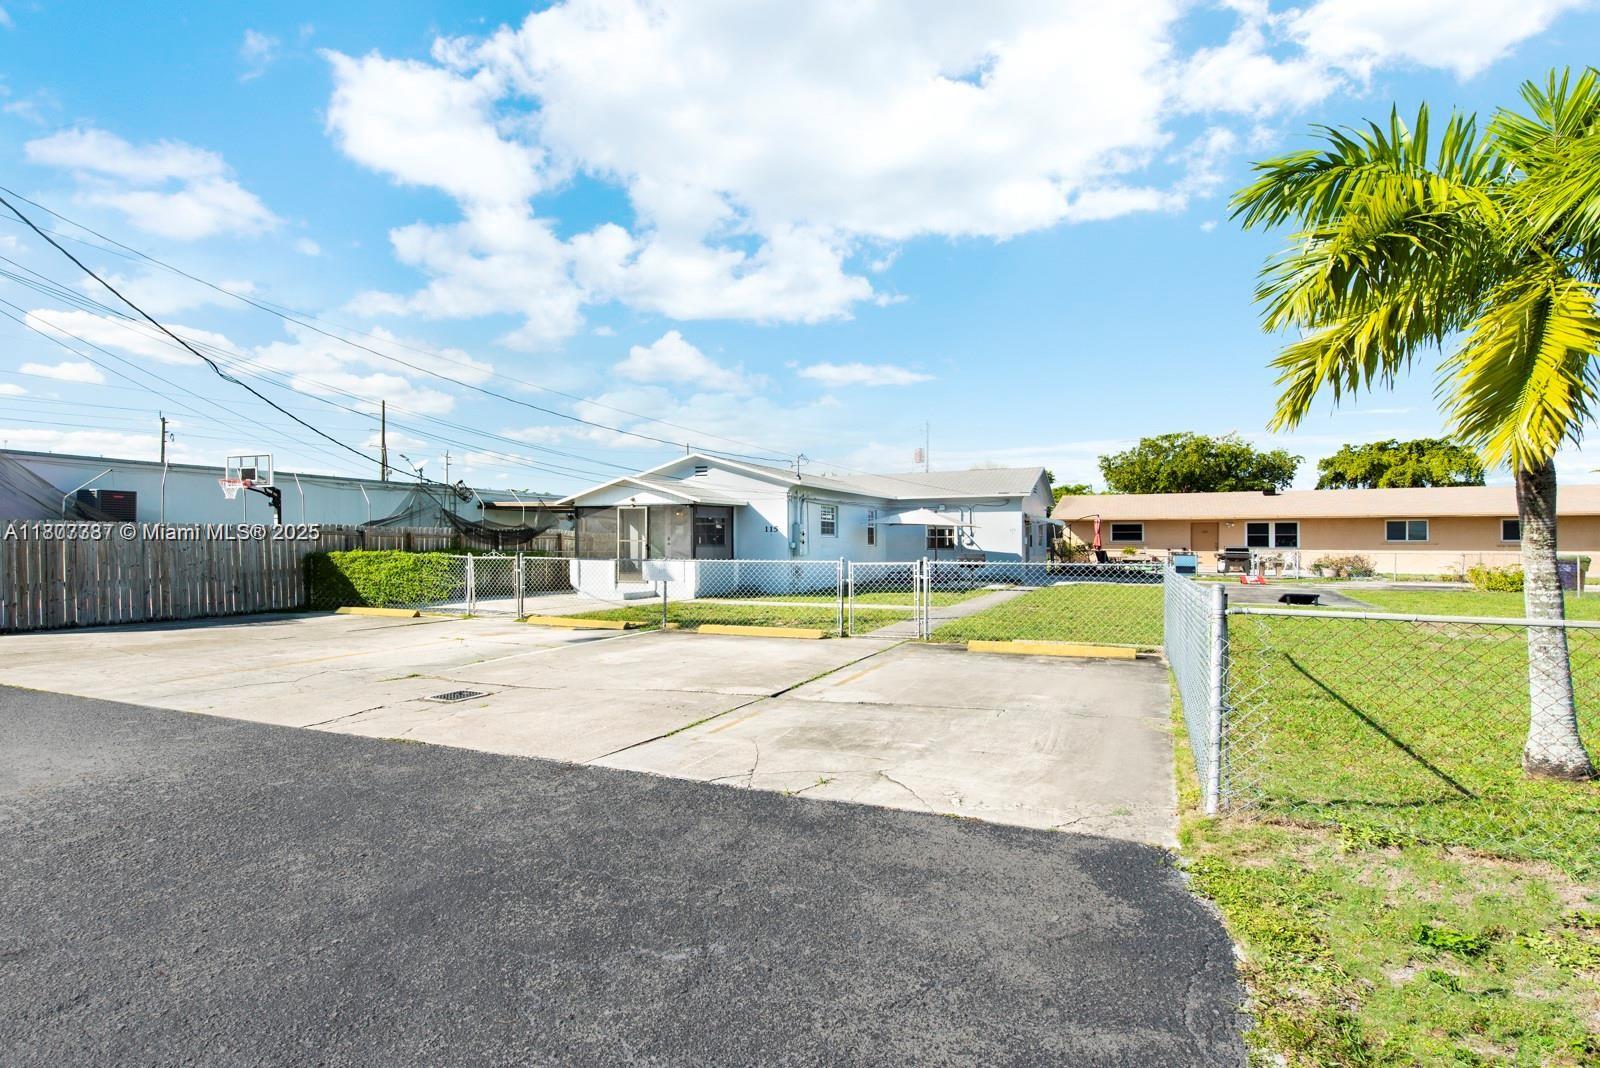
115 NE 2nd Ave, Hallandale Beach, FL 33009
$-1,568
Cash flow
-14.2%
Cash-on-Cash Return
2.9%
Cap rate
0.5%
Rent to Value Ratio
Active
$1,450,000
3
bds
|
3
ba
|
1,571
sqft
|
built
2006
1800 S Ocean Dr, Hallandale Beach, FL 33009
$-4,265
Cash flow
-15.3%
Cash-on-Cash Return
2.6%
Cap rate
0.6%
Rent to Value Ratio
Active
$375,000
1
bds
|
2
ba
|
870
sqft
|
built
1972
1985 S Ocean Dr, Hallandale Beach, FL 33009
$-634
Cash flow
-8.8%
Cash-on-Cash Return
4.1%
Cap rate
0.7%
Rent to Value Ratio
Active
$243,000
2
bds
|
2
ba
|
950
sqft
|
built
1970
421 NE 1st St, Hallandale Beach, FL 33009
$-66
Cash flow
-1.4%
Cash-on-Cash Return
5.8%
Cap rate
0.9%
Rent to Value Ratio
Active
$275,000
1
bds
|
2
ba
|
920
sqft
|
built
1971
137 Golden Isles Dr, Hallandale Beach, FL 33009
$-937
Cash flow
-17.8%
Cash-on-Cash Return
2.1%
Cap rate
0.8%
Rent to Value Ratio

Active
$650,000
2
bds
|
2
ba
|
1,440
sqft
|
built
1970
1904 S Ocean Dr, Hallandale Beach, FL 33009
$-1,737
Cash flow
-13.9%
Cash-on-Cash Return
2.9%
Cap rate
0.5%
Rent to Value Ratio
Active
$410,000
1
bds
|
2
ba
|
1,300
sqft
|
built
1974
1865 S Ocean Dr, Hallandale Beach, FL 33009
$-1,669
Cash flow
-21.2%
Cash-on-Cash Return
1.3%
Cap rate
0.7%
Rent to Value Ratio
Active
$800,000
3
bds
|
2
ba
|
1,904
sqft
|
built
1955
901 NE 8th St, Hallandale Beach, FL 33009
$-1,323
Cash flow
-8.6%
Cash-on-Cash Return
4.2%
Cap rate
0.7%
Rent to Value Ratio
Active
$1,300,000
4
bds
|
3
ba
|
1,850
sqft
|
built
1987
2300 Diana Dr, Hallandale Beach, FL 33009
$-4,796
Cash flow
-19.2%
Cash-on-Cash Return
1.7%
Cap rate
0.5%
Rent to Value Ratio