Hallandale Beach, FL Investment Properties for Sale
Browse homes for sale and investment properties in Hallandale Beach, FL. Refine your search by price, property type, or more.
Best cash flowing properties in Hallandale Beach, FL
Active
$170,000
1
bds
|
1
ba
|
620
sqft
|
built
1965
467 Golden Isles Dr, Hallandale Beach, FL 33009
$-526
Cash flow
-16.1%
Cash-on-Cash Return
2.6%
Cap rate
1.1%
Rent to Value Ratio
Active
$215,000
1
bds
|
2
ba
|
847
sqft
|
built
1969
218 NE 12th Ave, Hallandale Beach, FL 33009
$-586
Cash flow
-14.2%
Cash-on-Cash Return
3.0%
Cap rate
0.8%
Rent to Value Ratio
832 out of 930 properties for sale in Hallandale Beach, FL
Limited Results Shown
Create a free account, or log in to reveal all property listings and enjoy the complete experience.
Active
$679,000
2
bds
|
2
ba
|
1,360
sqft
|
built
1974
2017 S Ocean Dr, Hallandale Beach, FL 33009
$-1,921
Cash flow
-14.8%
Cash-on-Cash Return
2.9%
Cap rate
0.5%
Rent to Value Ratio
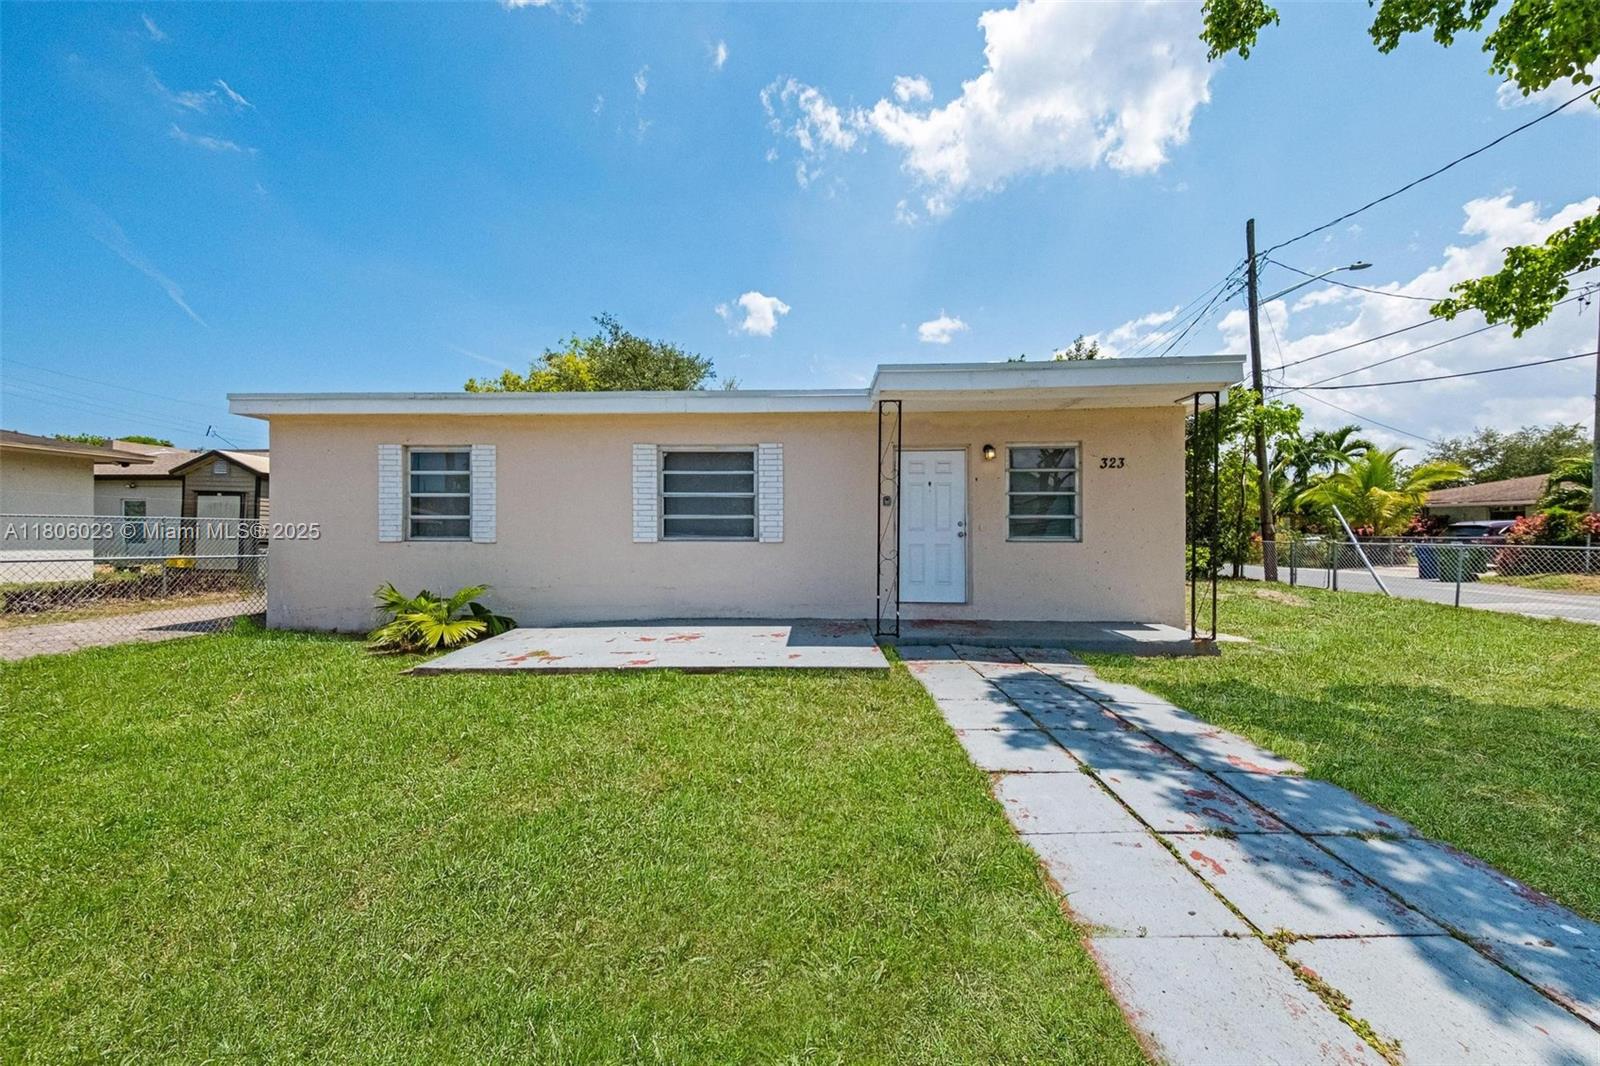
Pending
$400,000
3
bds
|
2
ba
|
936
sqft
|
built
1954
323 NW 9th St, Hallandale Beach, FL 33009
$-797
Cash flow
-10.4%
Cash-on-Cash Return
3.9%
Cap rate
0.6%
Rent to Value Ratio
Active
$319,000
2
bds
|
2
ba
|
1,250
sqft
|
built
1970
401 Golden Isles Dr, Hallandale Beach, FL 33009
$-1,242
Cash flow
-20.3%
Cash-on-Cash Return
1.6%
Cap rate
0.9%
Rent to Value Ratio
Active
$379,000
1
bds
|
2
ba
|
870
sqft
|
built
1971
1950 S Ocean Dr, Hallandale Beach, FL 33009
$-1,677
Cash flow
-23.1%
Cash-on-Cash Return
1.0%
Cap rate
0.7%
Rent to Value Ratio
Active
$295,000
1
bds
|
1
ba
|
798
sqft
|
built
1970
1965 S Ocean Dr, Hallandale Beach, FL 33009
$-1,082
Cash flow
-19.1%
Cash-on-Cash Return
1.9%
Cap rate
0.7%
Rent to Value Ratio
Active
$499,000
3
bds
|
2
ba
|
1,430
sqft
|
built
1981
200 Leslie Dr, Hallandale Beach, FL 33009
$-2,141
Cash flow
-22.4%
Cash-on-Cash Return
1.1%
Cap rate
0.8%
Rent to Value Ratio
Active
$315,000
2
bds
|
2
ba
|
1,180
sqft
|
built
1970
1801 S Ocean Dr, Hallandale Beach, FL 33009
$-719
Cash flow
-11.9%
Cash-on-Cash Return
3.5%
Cap rate
0.9%
Rent to Value Ratio
Active
$380,000
2
bds
|
2
ba
|
1,176
sqft
|
built
1969
1825 S Ocean Dr, Hallandale Beach, FL 33009
$-1,218
Cash flow
-16.7%
Cash-on-Cash Return
2.4%
Cap rate
0.7%
Rent to Value Ratio
Active
$349,000
1
bds
|
2
ba
|
1,300
sqft
|
built
1974
1865 S Ocean Dr, Hallandale Beach, FL 33009
$-1,391
Cash flow
-20.8%
Cash-on-Cash Return
1.5%
Cap rate
0.8%
Rent to Value Ratio
Active
$419,000
4
bds
|
2
ba
|
1,260
sqft
|
built
2015
519 NW 3rd Ave, Hallandale Beach, FL 33009
$-633
Cash flow
-7.9%
Cash-on-Cash Return
4.5%
Cap rate
0.7%
Rent to Value Ratio
Active
$340,000
1
bds
|
2
ba
|
920
sqft
|
built
2007
1755 E Hallandale Beach Blvd, Hallandale Beach, FL 33009
$-1,627
Cash flow
-25.0%
Cash-on-Cash Return
0.5%
Cap rate
0.7%
Rent to Value Ratio
Active
$445,000
2
bds
|
1
ba
|
999
sqft
|
built
2007
1945 S Ocean Dr, Hallandale Beach, FL 33009
$-960
Cash flow
-11.3%
Cash-on-Cash Return
3.7%
Cap rate
0.9%
Rent to Value Ratio
Active
$1,175,000
2
bds
|
2
ba
|
1,782
sqft
|
built
2005
1850 S Ocean Dr, Hallandale Beach, FL 33009
$-4,118
Cash flow
-18.3%
Cash-on-Cash Return
2.1%
Cap rate
0.6%
Rent to Value Ratio
Active
$179,000
1
bds
|
1
ba
|
650
sqft
|
built
1965
141 NE 10th Ave, Hallandale Beach, FL 33009
$-611
Cash flow
-17.8%
Cash-on-Cash Return
2.2%
Cap rate
0.9%
Rent to Value Ratio
Active
$297,000
1
bds
|
2
ba
|
915
sqft
|
built
1981
200 Leslie Dr, Hallandale Beach, FL 33009
$-960
Cash flow
-16.9%
Cash-on-Cash Return
2.4%
Cap rate
0.9%
Rent to Value Ratio
Active
$249,900
2
bds
|
2
ba
|
924
sqft
|
built
1974
801 Three Islands Blvd, Hallandale Beach, FL 33009
$-794
Cash flow
-16.6%
Cash-on-Cash Return
2.5%
Cap rate
0.9%
Rent to Value Ratio
Active
$420,000
2
bds
|
2
ba
|
1,090
sqft
|
built
1980
462 Golden Isles Dr, Hallandale Beach, FL 33009
$-1,759
Cash flow
-21.9%
Cash-on-Cash Return
1.3%
Cap rate
0.6%
Rent to Value Ratio
Active
$215,000
1
bds
|
2
ba
|
847
sqft
|
built
1969
218 NE 12th Ave, Hallandale Beach, FL 33009
$-586
Cash flow
-14.2%
Cash-on-Cash Return
3.0%
Cap rate
0.8%
Rent to Value Ratio
Active
$298,000
2
bds
|
2
ba
|
1,050
sqft
|
built
1965
700 Layne Blvd, Hallandale Beach, FL 33009
$-874
Cash flow
-15.3%
Cash-on-Cash Return
2.8%
Cap rate
0.8%
Rent to Value Ratio
Active
$279,000
1
bds
|
1
ba
|
738
sqft
|
built
1972
3180 S Ocean Dr, Hallandale Beach, FL 33009
$-1,469
Cash flow
-27.5%
Cash-on-Cash Return
0.0%
Cap rate
0.8%
Rent to Value Ratio
Active
$345,000
2
bds
|
2
ba
|
1,280
sqft
|
built
1981
2500 Parkview Dr, Hallandale Beach, FL 33009
$-1,520
Cash flow
-23.0%
Cash-on-Cash Return
1.0%
Cap rate
0.8%
Rent to Value Ratio
Active
$399,000
2
bds
|
2
ba
|
1,020
sqft
|
built
1974
2017 S Ocean Dr, Hallandale Beach, FL 33009
$-1,173
Cash flow
-15.3%
Cash-on-Cash Return
2.8%
Cap rate
0.7%
Rent to Value Ratio

Active
$730,000
2
bds
|
1
ba
|
1,086
sqft
|
built
2006
1800 S Ocean Dr, Hallandale Beach, FL 33009
$-3,157
Cash flow
-22.6%
Cash-on-Cash Return
1.1%
Cap rate
0.5%
Rent to Value Ratio
Active
$386,000
2
bds
|
2
ba
|
1,580
sqft
|
built
1980
2500 Parkview Dr, Hallandale Beach, FL 33009
$-1,651
Cash flow
-22.3%
Cash-on-Cash Return
1.2%
Cap rate
0.8%
Rent to Value Ratio
Active
$1,560,000
3
bds
|
3
ba
|
1,675
sqft
|
built
2005
1830 S Ocean Dr, Hallandale Beach, FL 33009
$-6,272
Cash flow
-21.0%
Cash-on-Cash Return
1.5%
Cap rate
0.5%
Rent to Value Ratio
Active
$620,000
4
bds
|
3
ba
|
1,417
sqft
|
built
1954
600 SW 10th St, Hallandale Beach, FL 33009
$-1,789
Cash flow
-15.1%
Cash-on-Cash Return
2.8%
Cap rate
0.5%
Rent to Value Ratio
Active
$375,000
1
bds
|
2
ba
|
970
sqft
|
built
1970
1980 S Ocean Dr, Hallandale Beach, FL 33009
$-1,456
Cash flow
-20.3%
Cash-on-Cash Return
1.6%
Cap rate
0.7%
Rent to Value Ratio
Active
$239,000
2
bds
|
2
ba
|
1,075
sqft
|
built
1976
1000 Parkview Dr, Hallandale Beach, FL 33009
$-849
Cash flow
-18.5%
Cash-on-Cash Return
2.0%
Cap rate
1.0%
Rent to Value Ratio
Active
$665,000
2
bds
|
2
ba
|
1,222
sqft
|
built
1979
3140 S Ocean Dr, Hallandale Beach, FL 33009
$-2,357
Cash flow
-18.5%
Cash-on-Cash Return
2.0%
Cap rate
0.6%
Rent to Value Ratio
Active
$359,000
1
bds
|
2
ba
|
870
sqft
|
built
1971
1980 S Ocean Dr, Hallandale Beach, FL 33009
$-1,112
Cash flow
-16.2%
Cash-on-Cash Return
2.6%
Cap rate
0.8%
Rent to Value Ratio

Active
$650,000
2
bds
|
2
ba
|
870
sqft
|
built
1971
1950 S Ocean Dr, Hallandale Beach, FL 33009
$-2,529
Cash flow
-20.3%
Cash-on-Cash Return
1.6%
Cap rate
0.5%
Rent to Value Ratio
Active
$765,000
3
bds
|
3
ba
|
1,737
sqft
|
built
2015
2600 E Hallandale Beach Blvd, Hallandale Beach, FL 33009
$-3,423
Cash flow
-23.3%
Cash-on-Cash Return
0.9%
Cap rate
0.7%
Rent to Value Ratio
Active
$700,000
2
bds
|
2
ba
|
1,028
sqft
|
built
2015
2600 E Hallandale Beach Blvd, Hallandale Beach, FL 33009
$-3,179
Cash flow
-23.7%
Cash-on-Cash Return
0.8%
Cap rate
0.5%
Rent to Value Ratio
Active
$275,000
1
bds
|
2
ba
|
780
sqft
|
built
1969
1817 S Ocean Dr, Hallandale Beach, FL 33009
$-777
Cash flow
-14.7%
Cash-on-Cash Return
2.9%
Cap rate
0.9%
Rent to Value Ratio
Active
$170,000
1
bds
|
1
ba
|
620
sqft
|
built
1965
467 Golden Isles Dr, Hallandale Beach, FL 33009
$-526
Cash flow
-16.1%
Cash-on-Cash Return
2.6%
Cap rate
1.1%
Rent to Value Ratio
Active
$245,000
1
bds
|
1
ba
|
876
sqft
|
built
1967
301 Golden Isles Dr, Hallandale Beach, FL 33009
$-960
Cash flow
-20.4%
Cash-on-Cash Return
1.6%
Cap rate
0.8%
Rent to Value Ratio
Active
$398,888
2
bds
|
2
ba
|
1,125
sqft
|
built
1970
121 Golden Isles Dr, Hallandale Beach, FL 33009
$-1,284
Cash flow
-16.8%
Cash-on-Cash Return
2.4%
Cap rate
0.7%
Rent to Value Ratio
Active
$395,000
1
bds
|
2
ba
|
832
sqft
|
built
1972
3180 S Ocean Dr, Hallandale Beach, FL 33009
$-2,542
Cash flow
-33.6%
Cash-on-Cash Return
-1.4%
Cap rate
0.7%
Rent to Value Ratio
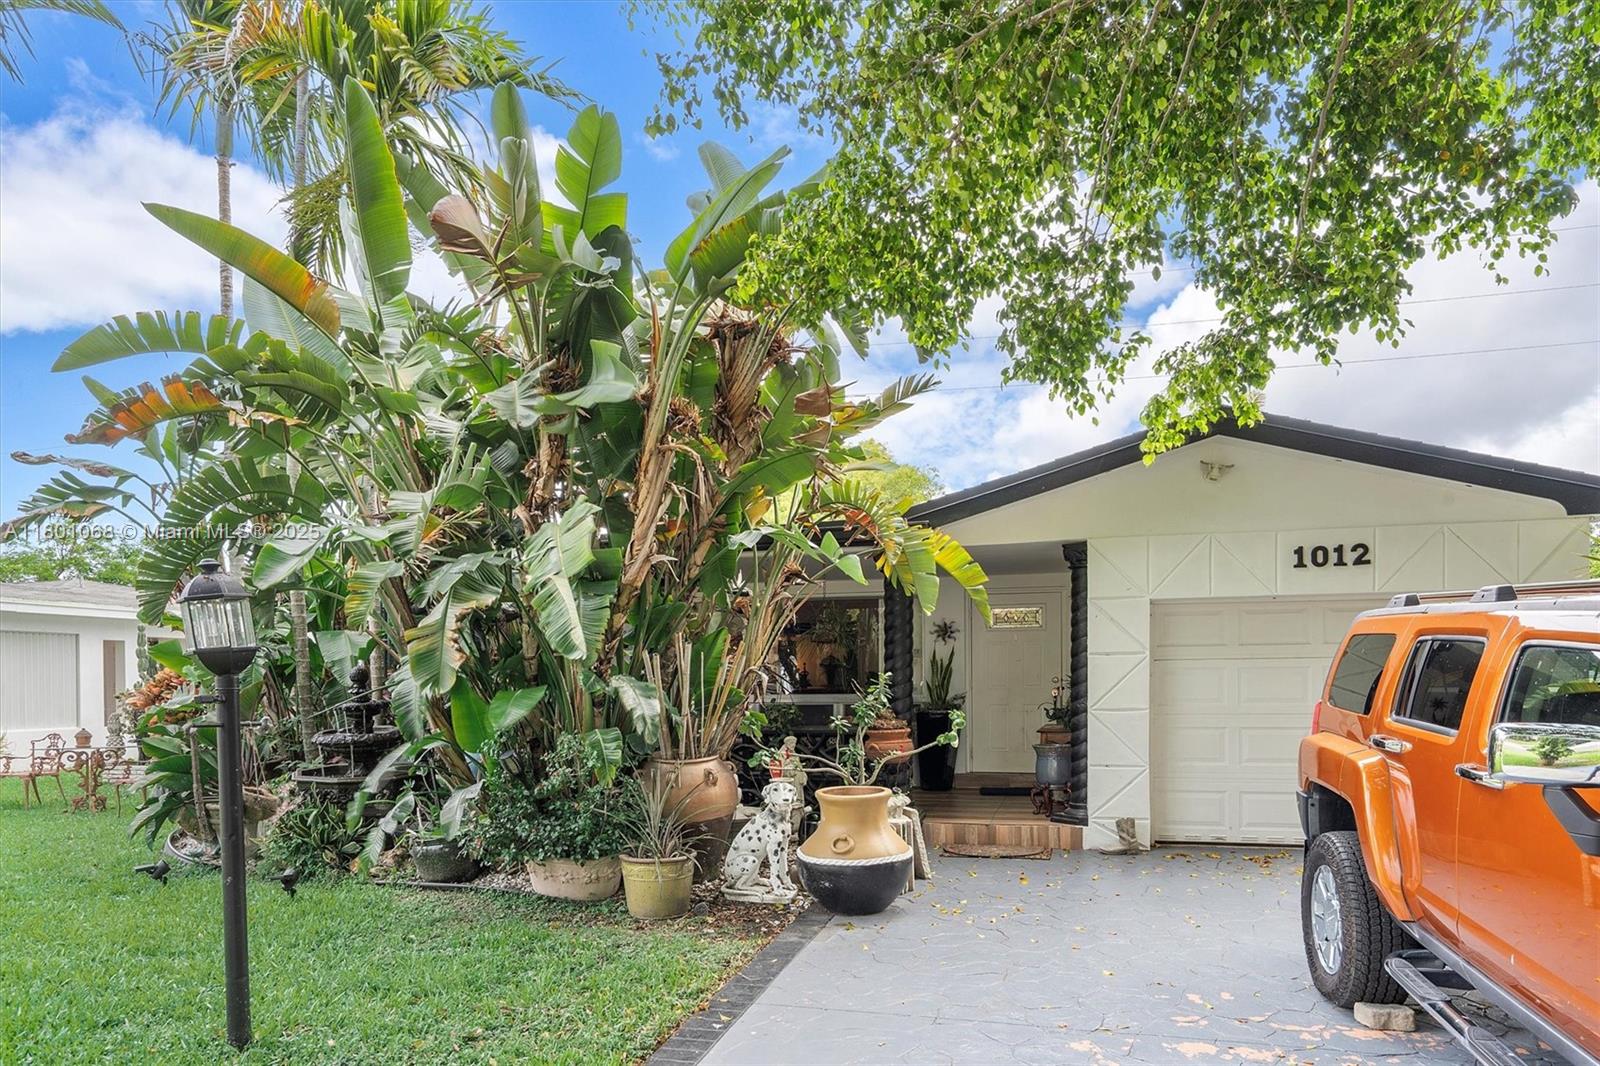
Active
$780,000
3
bds
|
3
ba
|
1,759
sqft
|
built
1958
1012 NE 8th St, Hallandale Beach, FL 33009
$-1,742
Cash flow
-11.7%
Cash-on-Cash Return
3.6%
Cap rate
0.6%
Rent to Value Ratio
Active
$225,000
1
bds
|
2
ba
|
915
sqft
|
built
1976
1000 Parkview Dr, Hallandale Beach, FL 33009
$-755
Cash flow
-17.5%
Cash-on-Cash Return
2.3%
Cap rate
1.0%
Rent to Value Ratio