Hallandale Beach, FL Investment Properties for Sale
Browse homes for sale and investment properties in Hallandale Beach, FL. Refine your search by price, property type, or more.
Best cash flowing properties in Hallandale Beach, FL
Active
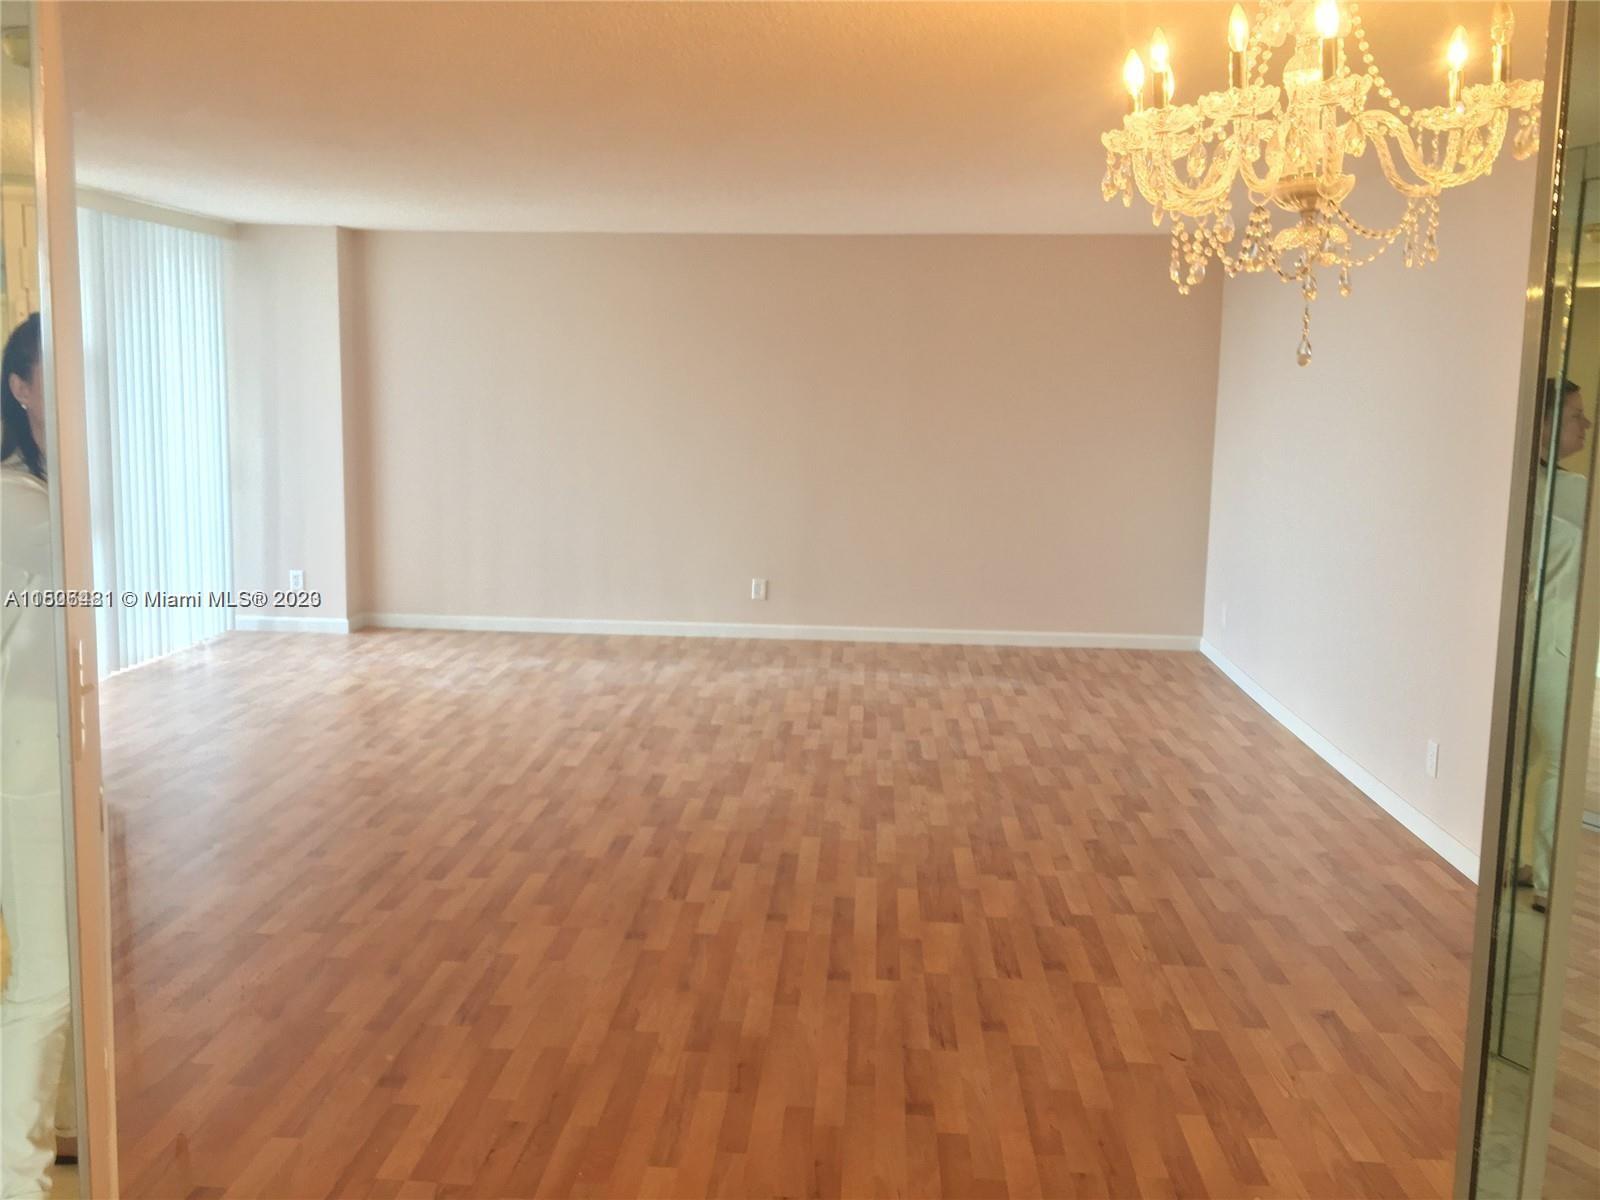
$199,000
1
bds
|
1
ba
|
875
sqft
|
built
1976
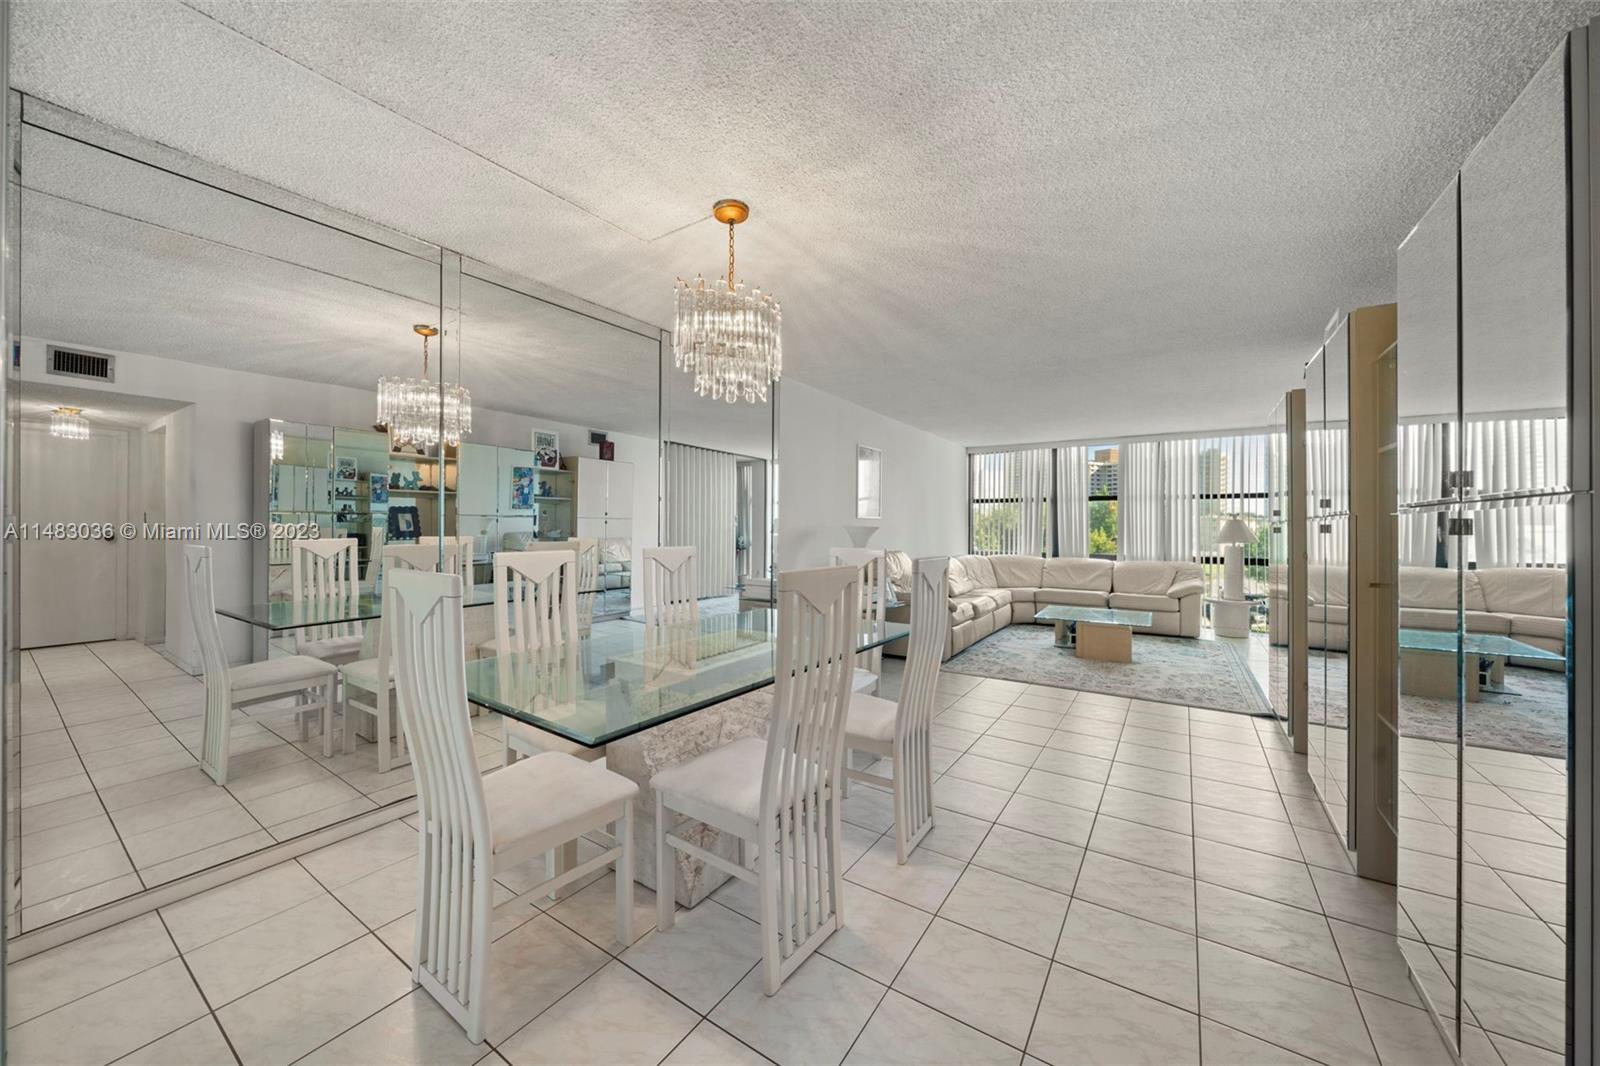
1000 Parkview Dr, Hallandale Beach, FL 33009
$47
Cash flow
1.2%
Cash-on-Cash Return
6.4%
Cap rate
1.0%
Rent to Value Ratio
Active
$215,000
1
bds
|
1
ba
|
672
sqft
|
built
1969
1825 S Ocean Dr, Hallandale Beach, FL 33009
$10
Cash flow
0.2%
Cash-on-Cash Return
6.2%
Cap rate
0.9%
Rent to Value Ratio
833 out of 931 properties for sale in Hallandale Beach, FL
Limited Results Shown
Create a free account, or log in to reveal all property listings and enjoy the complete experience.
Active
$320,000
2
bds
|
2
ba
|
1,092
sqft
|
built
1970
319 NE 14th Ave, Hallandale Beach, FL 33009
$-770
Cash flow
-12.6%
Cash-on-Cash Return
3.3%
Cap rate
0.8%
Rent to Value Ratio
Active
$360,000
1
bds
|
2
ba
|
920
sqft
|
built
2007
1755 E Hallandale Beach Blvd, Hallandale Beach, FL 33009
$-1,503
Cash flow
-21.8%
Cash-on-Cash Return
1.1%
Cap rate
0.7%
Rent to Value Ratio
Active
$499,000
2
bds
|
2
ba
|
1,710
sqft
|
built
1974
1865 S Ocean Dr, Hallandale Beach, FL 33009
$-1,452
Cash flow
-15.2%
Cash-on-Cash Return
2.7%
Cap rate
0.7%
Rent to Value Ratio
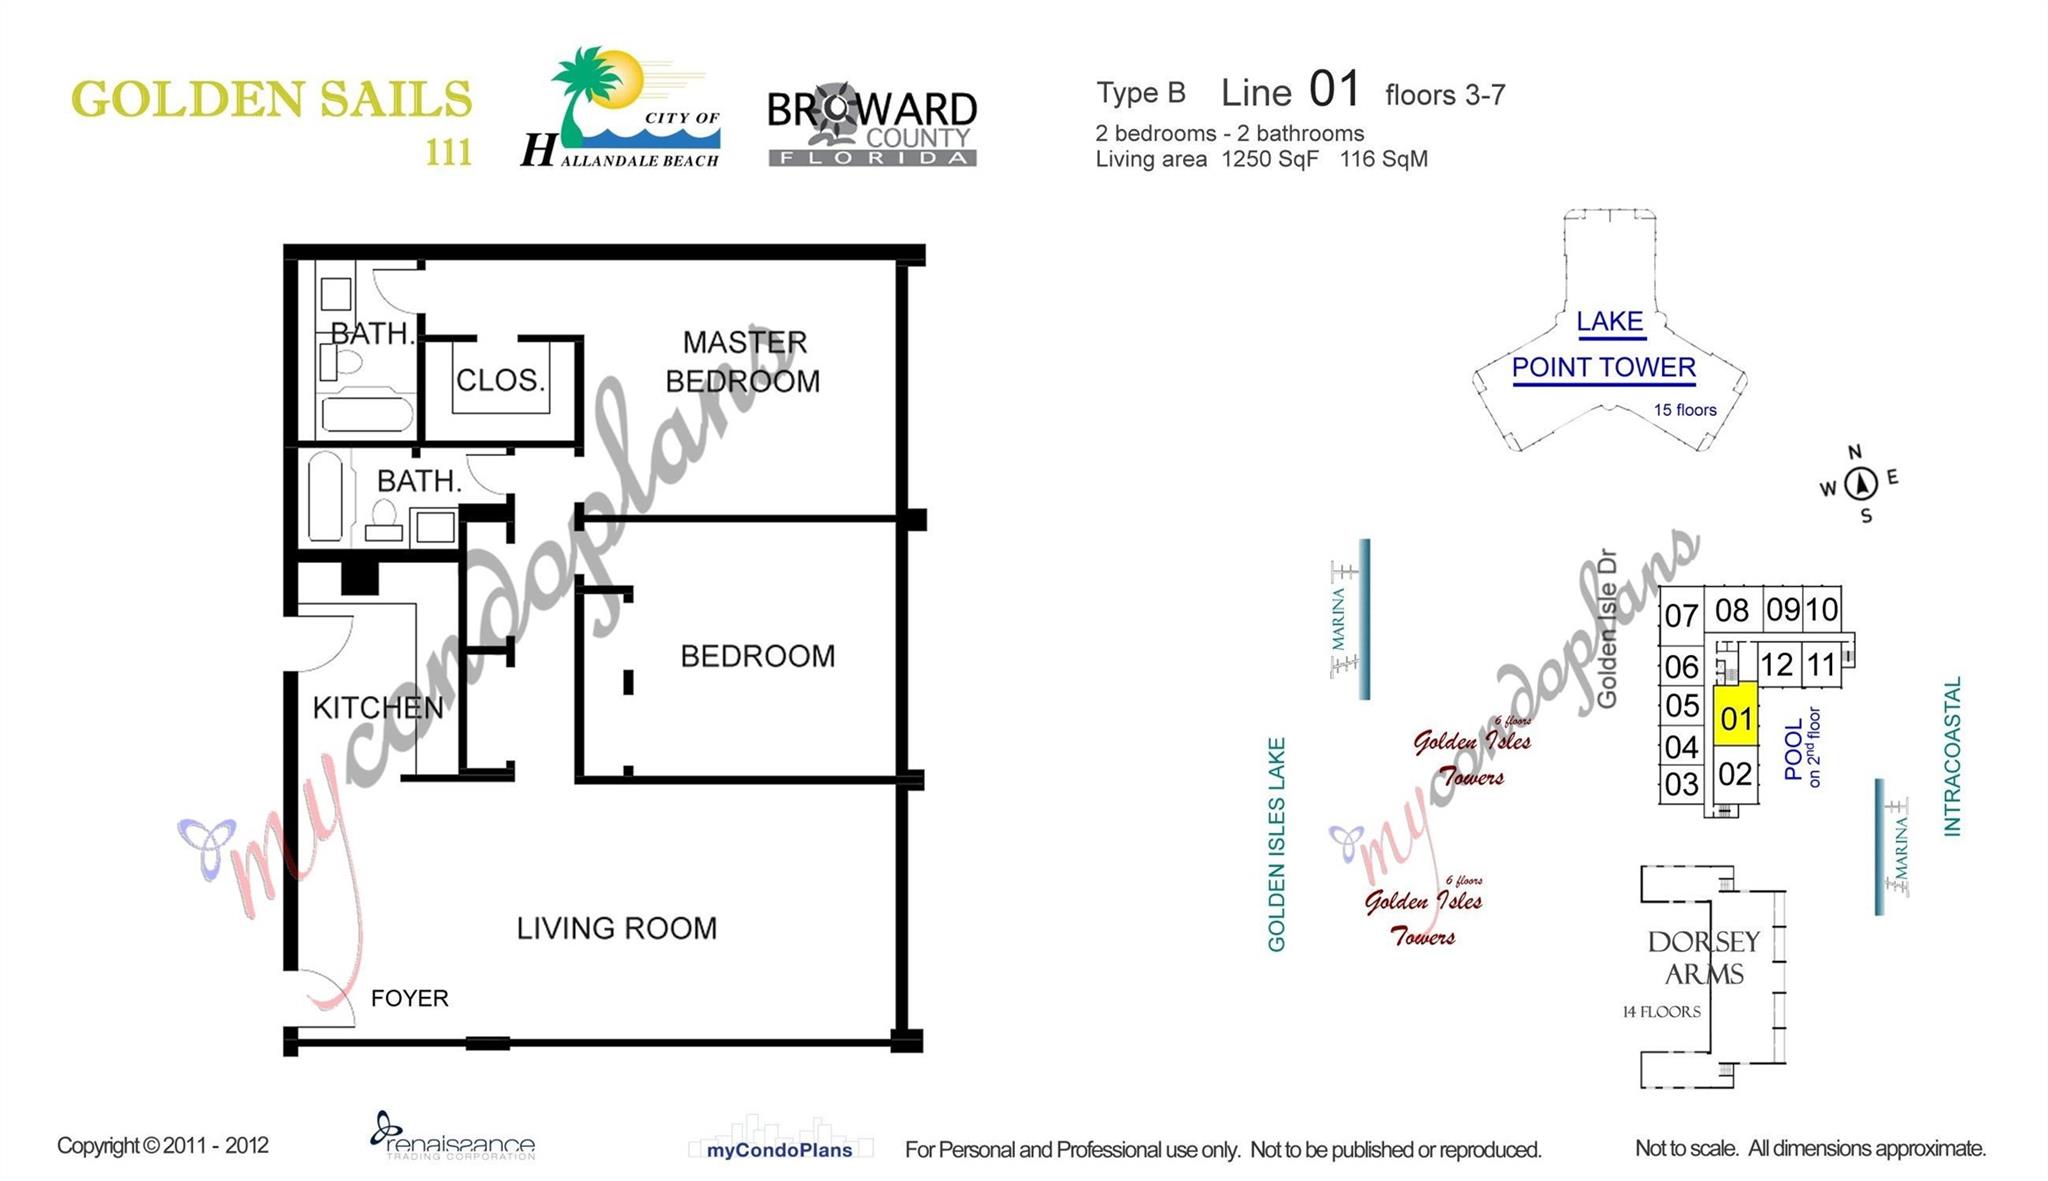
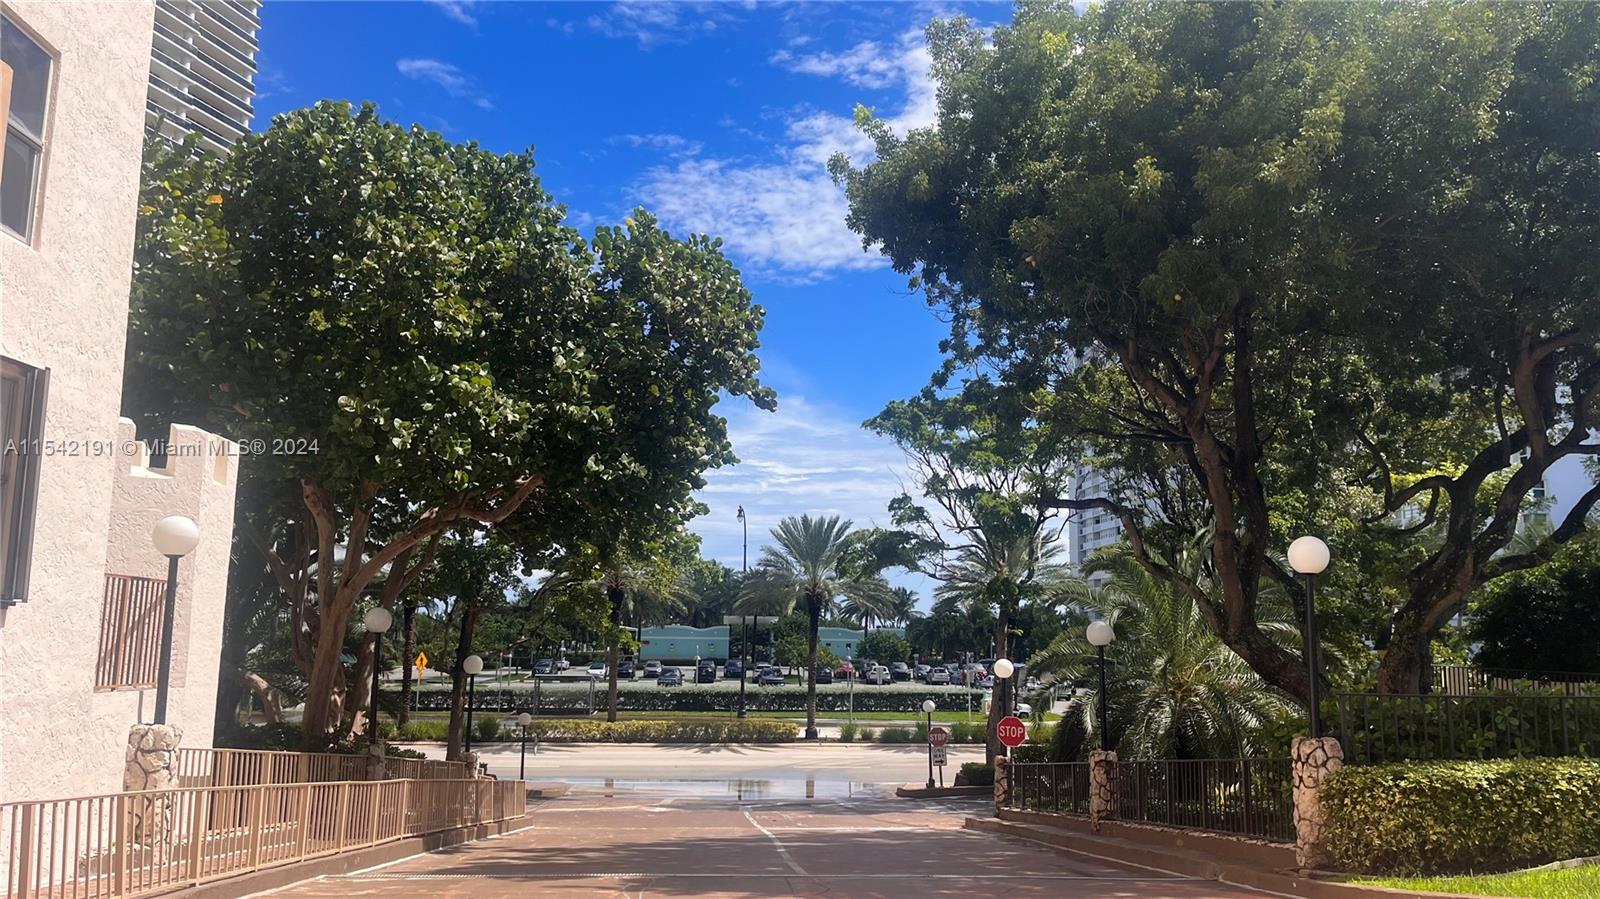
Active
$295,000
2
bds
|
2
ba
|
1,250
sqft
|
built
1968
111 Golden Isles Dr, Hallandale Beach, FL 33009
$-837
Cash flow
-14.8%
Cash-on-Cash Return
2.7%
Cap rate
0.9%
Rent to Value Ratio

Active
$675,000
2
bds
|
2
ba
|
1,030
sqft
|
built
2015
2600 E Hallandale Beach Blvd, Hallandale Beach, FL 33009
$-2,747
Cash flow
-21.2%
Cash-on-Cash Return
1.3%
Cap rate
0.7%
Rent to Value Ratio
Active
$215,000
1
bds
|
1
ba
|
672
sqft
|
built
1969
1825 S Ocean Dr, Hallandale Beach, FL 33009
$10
Cash flow
0.2%
Cash-on-Cash Return
6.2%
Cap rate
0.9%
Rent to Value Ratio
Active
$397,700
3
bds
|
2
ba
|
1,379
sqft
|
built
1970
121 Golden Isles Dr, Hallandale Beach, FL 33009
$-1,451
Cash flow
-19.0%
Cash-on-Cash Return
1.8%
Cap rate
0.7%
Rent to Value Ratio
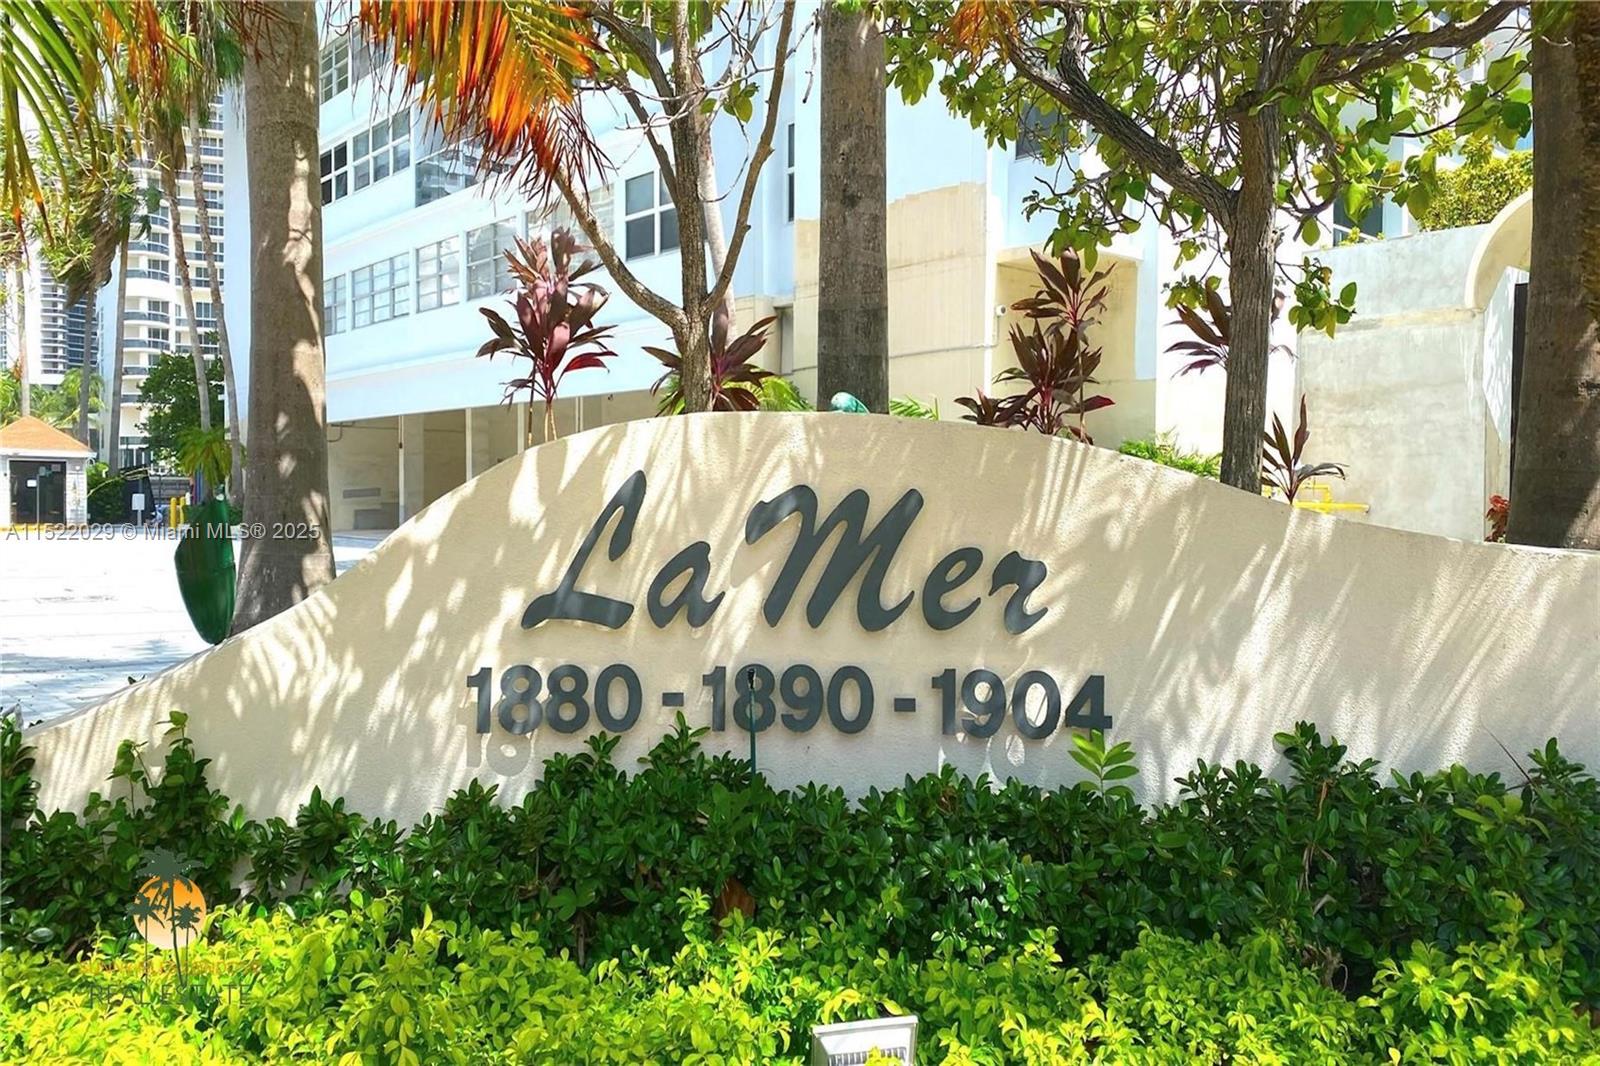
Active
$429,000
1
bds
|
2
ba
|
960
sqft
|
built
1970
1904 S Ocean Dr, Hallandale Beach, FL 33009
$-1,650
Cash flow
-20.1%
Cash-on-Cash Return
1.5%
Cap rate
0.7%
Rent to Value Ratio
Active
$279,000
1
bds
|
1
ba
|
741
sqft
|
built
1972
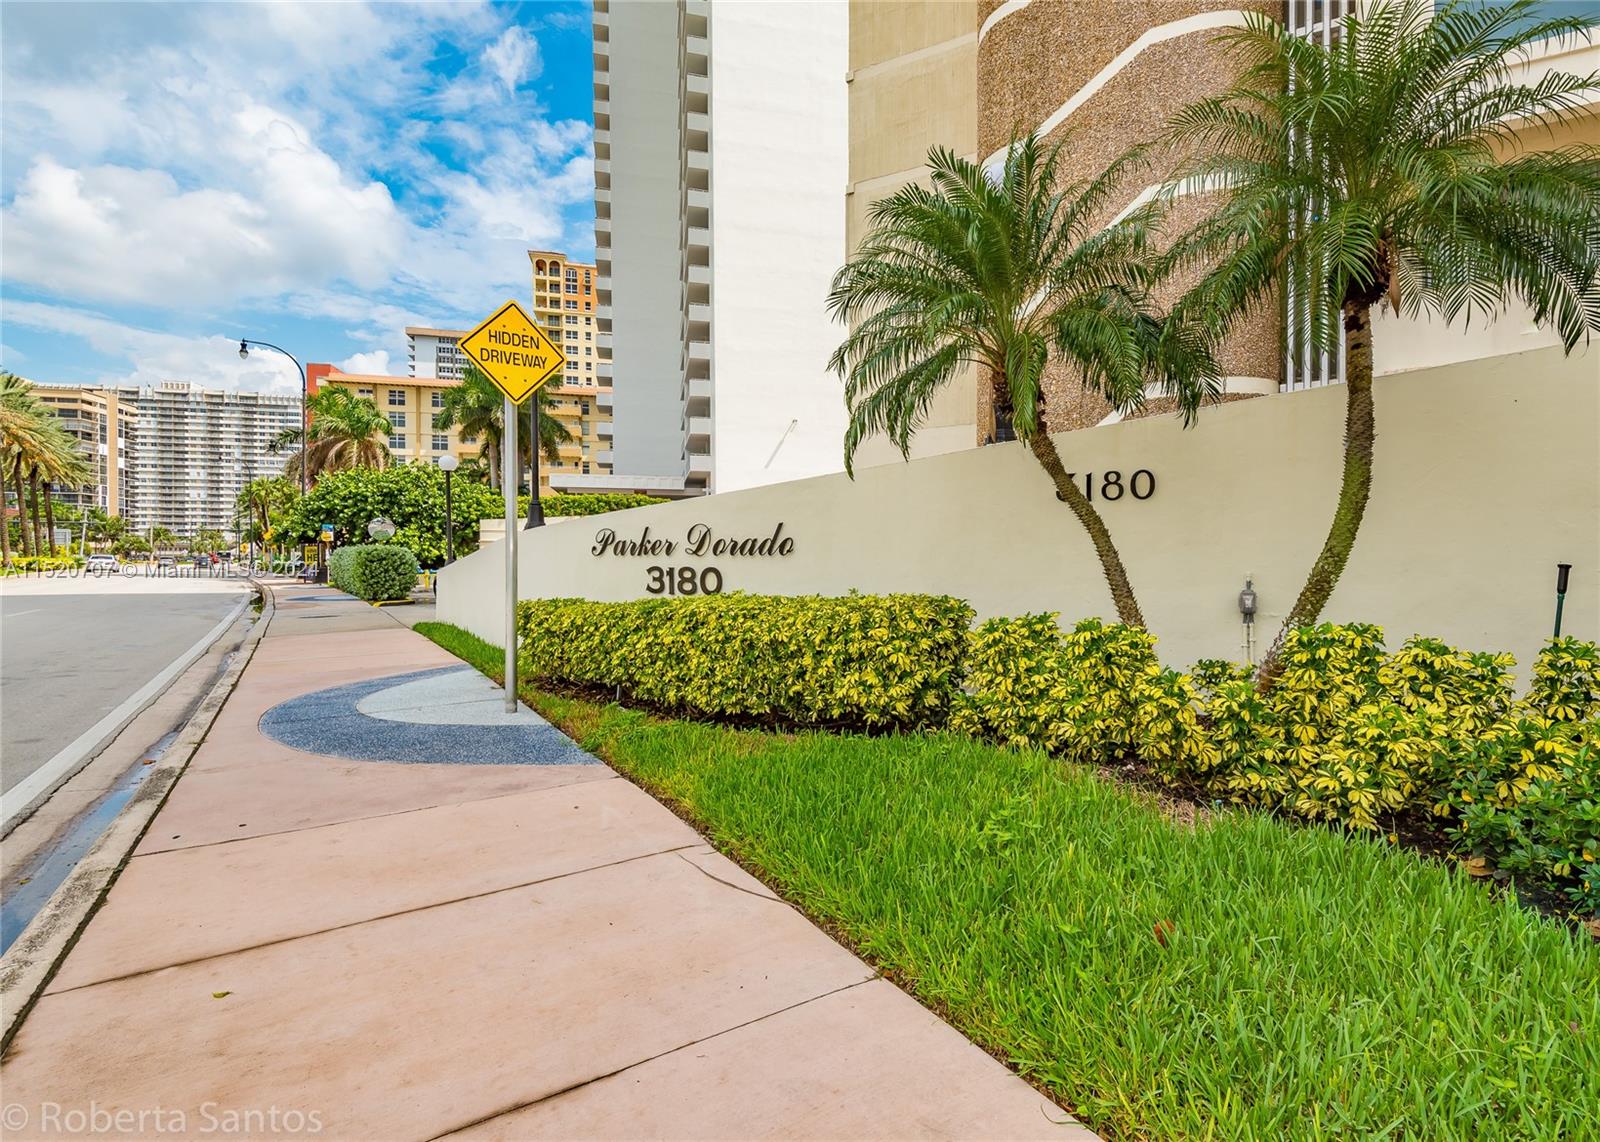
3180 S Ocean Dr, Hallandale Beach, FL 33009
$-1,293
Cash flow
-24.2%
Cash-on-Cash Return
0.6%
Cap rate
0.8%
Rent to Value Ratio
Active
$699,000
1
bds
|
1
ba
|
844
sqft
|
built
2006
1830 S Ocean Dr, Hallandale Beach, FL 33009
$-1,767
Cash flow
-13.2%
Cash-on-Cash Return
3.1%
Cap rate
0.6%
Rent to Value Ratio
Active
$697,000
1
bds
|
1
ba
|
811
sqft
|
built
2006
1830 S Ocean Dr, Hallandale Beach, FL 33009
$-2,702
Cash flow
-20.2%
Cash-on-Cash Return
1.5%
Cap rate
0.6%
Rent to Value Ratio
Active
$229,000
1
bds
|
2
ba
|
1,075
sqft
|
built
1976
1000 Parkview Dr, Hallandale Beach, FL 33009
$-701
Cash flow
-16.0%
Cash-on-Cash Return
2.5%
Cap rate
1.1%
Rent to Value Ratio
Active
$405,000
2
bds
|
2
ba
|
1,081
sqft
|
built
2007
1755 E Hallandale Beach Blvd, Hallandale Beach, FL 33009
$-1,284
Cash flow
-16.5%
Cash-on-Cash Return
2.3%
Cap rate
0.8%
Rent to Value Ratio
Active
$305,000
1
bds
|
1
ba
|
798
sqft
|
built
1970
1965 S Ocean Dr, Hallandale Beach, FL 33009
$-1,209
Cash flow
-20.7%
Cash-on-Cash Return
1.4%
Cap rate
0.7%
Rent to Value Ratio

Active
$208,500
1
bds
|
1
ba
|
660
sqft
|
built
1967
180 NE 12th Ave, Hallandale Beach, FL 33009
$-544
Cash flow
-13.6%
Cash-on-Cash Return
3.0%
Cap rate
0.9%
Rent to Value Ratio
Active
$1,350,000
3
bds
|
2
ba
|
1,554
sqft
|
built
2006
1830 S Ocean Dr, Hallandale Beach, FL 33009
$-5,309
Cash flow
-20.5%
Cash-on-Cash Return
1.4%
Cap rate
0.5%
Rent to Value Ratio
Active
$1,175,000
2
bds
|
2
ba
|
1,458
sqft
|
built
2006
1830 S Ocean Dr, Hallandale Beach, FL 33009
$-3,666
Cash flow
-16.3%
Cash-on-Cash Return
2.4%
Cap rate
0.6%
Rent to Value Ratio
Active
$335,000
2
bds
|
2
ba
|
1,776
sqft
|
built
1974
1865 S Ocean Dr, Hallandale Beach, FL 33009
$-1,495
Cash flow
-23.3%
Cash-on-Cash Return
0.8%
Cap rate
0.9%
Rent to Value Ratio
Active
$199,000
1
bds
|
1
ba
|
875
sqft
|
built
1976
1000 Parkview Dr, Hallandale Beach, FL 33009
$47
Cash flow
1.2%
Cash-on-Cash Return
6.4%
Cap rate
1.0%
Rent to Value Ratio
Active
$190,000
1
bds
|
2
ba
|
847
sqft
|
built
1969
218 NE 12th Ave, Hallandale Beach, FL 33009
$-312
Cash flow
-8.6%
Cash-on-Cash Return
4.2%
Cap rate
0.9%
Rent to Value Ratio
Active
$232,500
1
bds
|
2
ba
|
715
sqft
|
built
1973
1300 Moffett St, Hallandale Beach, FL 33009
$-564
Cash flow
-12.7%
Cash-on-Cash Return
3.2%
Cap rate
0.8%
Rent to Value Ratio
Active
$1,169,000
3
bds
|
3
ba
|
1,571
sqft
|
built
2005
1850 S Ocean Dr, Hallandale Beach, FL 33009
$-3,317
Cash flow
-14.8%
Cash-on-Cash Return
2.7%
Cap rate
0.5%
Rent to Value Ratio
Active
$250,000
1
bds
|
2
ba
|
1,075
sqft
|
built
1976
800 Parkview Dr, Hallandale Beach, FL 33009
$-923
Cash flow
-19.3%
Cash-on-Cash Return
1.7%
Cap rate
0.9%
Rent to Value Ratio
Active
$310,000
1
bds
|
1
ba
|
798
sqft
|
built
1970
1965 S Ocean Dr, Hallandale Beach, FL 33009
$-1,210
Cash flow
-20.4%
Cash-on-Cash Return
1.5%
Cap rate
0.7%
Rent to Value Ratio

Active
$3,900,000
7
bds
|
5
ba
|
3,704
sqft
|
built
1959
472 Sunset Dr, Hallandale Beach, FL 33009
$-16,622
Cash flow
-22.2%
Cash-on-Cash Return
1.0%
Cap rate
0.3%
Rent to Value Ratio
Active
$449,999
3
bds
|
2
ba
|
1,780
sqft
|
built
1975
600 Three Islands Blvd, Hallandale Beach, FL 33009
$-1,607
Cash flow
-18.6%
Cash-on-Cash Return
1.9%
Cap rate
0.7%
Rent to Value Ratio

Active
$1,899,000
3
bds
|
4
ba
|
2,078
sqft
|
built
2005
1850 S Ocean Dr, Hallandale Beach, FL 33009
$-8,713
Cash flow
-23.9%
Cash-on-Cash Return
0.6%
Cap rate
0.4%
Rent to Value Ratio
Active
$825,000
3
bds
|
3
ba
|
1,577
sqft
|
built
2015
2600 E Hallandale Beach Blvd, Hallandale Beach, FL 33009
$-2,460
Cash flow
-15.6%
Cash-on-Cash Return
2.6%
Cap rate
0.8%
Rent to Value Ratio
Active
$395,000
1
bds
|
1
ba
|
736
sqft
|
built
1970
2030 S Ocean Dr, Hallandale Beach, FL 33009
$-1,839
Cash flow
-24.3%
Cash-on-Cash Return
0.6%
Cap rate
0.6%
Rent to Value Ratio
Active
$250,000
2
bds
|
2
ba
|
960
sqft
|
built
1983
1420 Atlantic Shores Blvd, Hallandale Beach, FL 33009
$-444
Cash flow
-9.3%
Cash-on-Cash Return
4.0%
Cap rate
0.9%
Rent to Value Ratio

Active
$399,000
2
bds
|
2
ba
|
1,710
sqft
|
built
1974
1865 S Ocean Dr, Hallandale Beach, FL 33009
$-1,952
Cash flow
-25.5%
Cash-on-Cash Return
0.3%
Cap rate
0.7%
Rent to Value Ratio
Active
$1,525,000
3
bds
|
3
ba
|
1,733
sqft
|
built
2006
1830 S Ocean Dr, Hallandale Beach, FL 33009
$-5,205
Cash flow
-17.8%
Cash-on-Cash Return
2.1%
Cap rate
0.5%
Rent to Value Ratio
Active
$750,000
2
bds
|
2
ba
|
1,000
sqft
|
built
2002
2080 S Ocean Dr, Hallandale Beach, FL 33009
$-2,699
Cash flow
-18.8%
Cash-on-Cash Return
1.8%
Cap rate
0.5%
Rent to Value Ratio