Hallandale Beach, FL Investment Properties for Sale
Browse homes for sale and investment properties in Hallandale Beach, FL. Refine your search by price, property type, or more.
Best cash flowing properties in Hallandale Beach, FL
Active
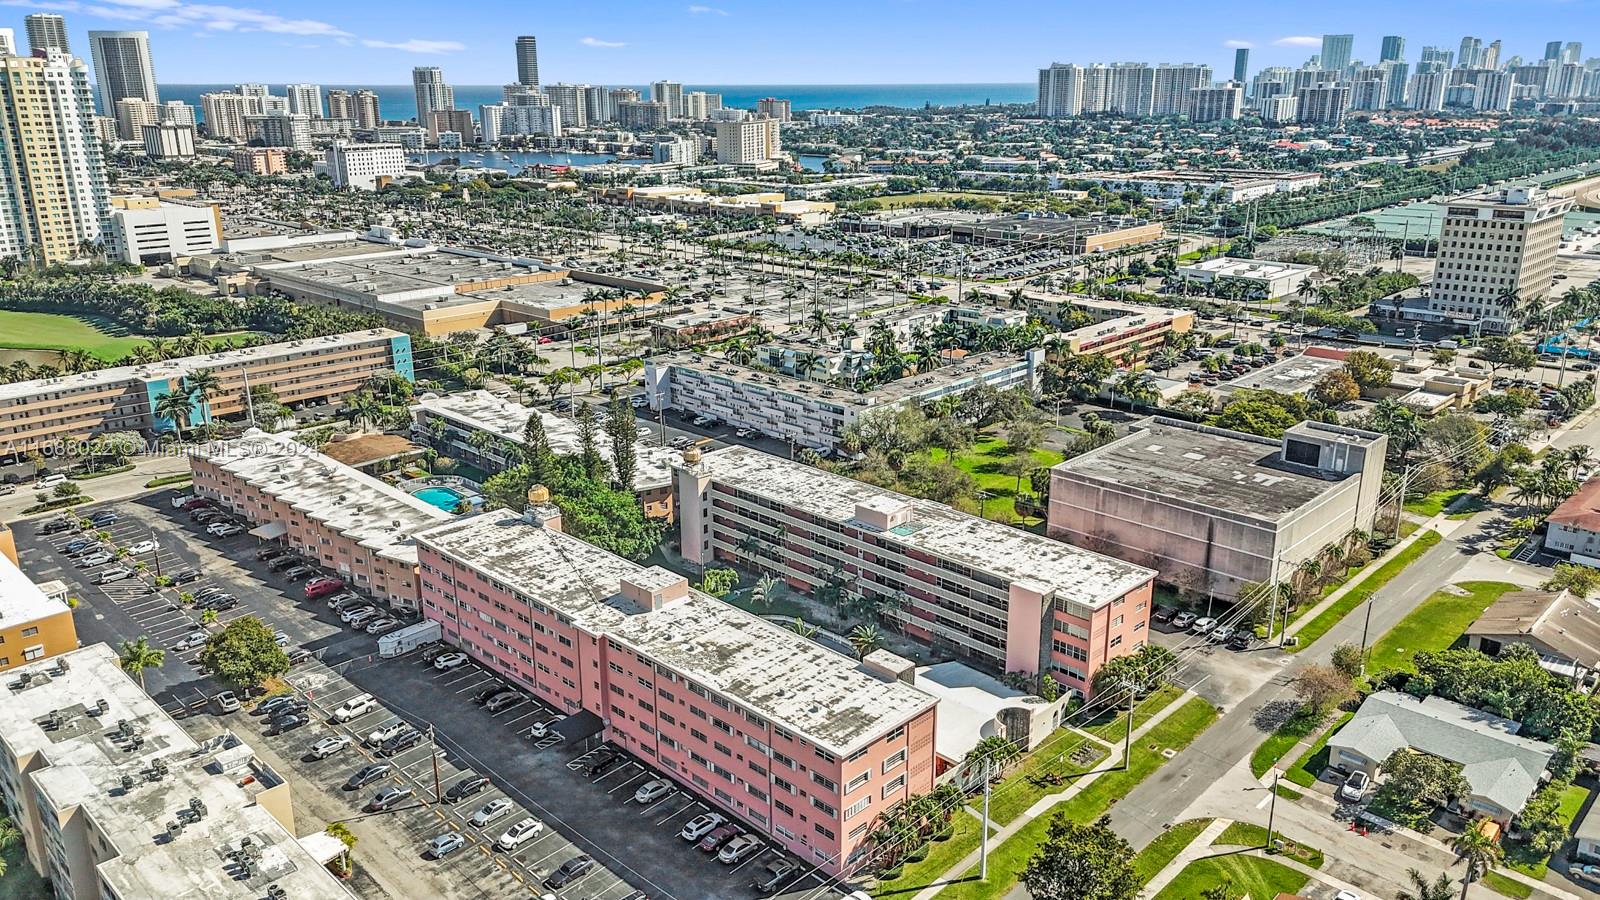
$195,000
1
bds
|
1
ba
|
660
sqft
|
built
1967
180 NE 12th Ave, Hallandale Beach, FL 33009
$287
Cash flow
7.7%
Cash-on-Cash Return
7.9%
Cap rate
1.0%
Rent to Value Ratio
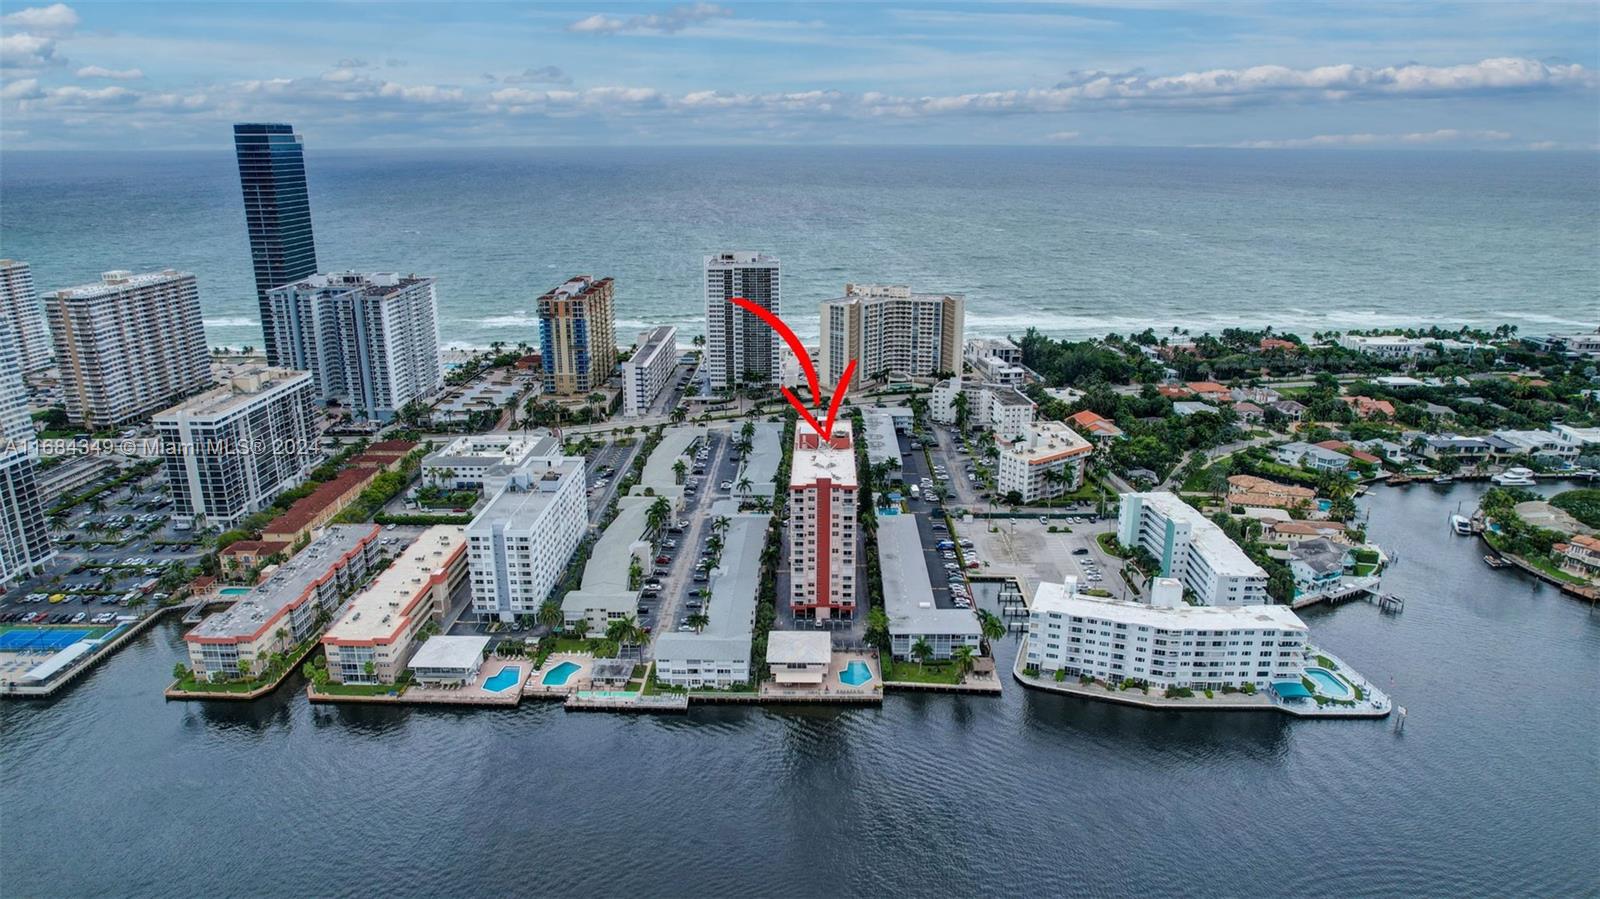
Active
$270,000
1
bds
|
2
ba
|
1,016
sqft
|
built
1971
3161 S Ocean Dr, Hallandale Beach, FL 33009
$-248
Cash flow
-4.8%
Cash-on-Cash Return
5.0%
Cap rate
0.9%
Rent to Value Ratio
832 out of 930 properties for sale in Hallandale Beach, FL
Limited Results Shown
Create a free account, or log in to reveal all property listings and enjoy the complete experience.
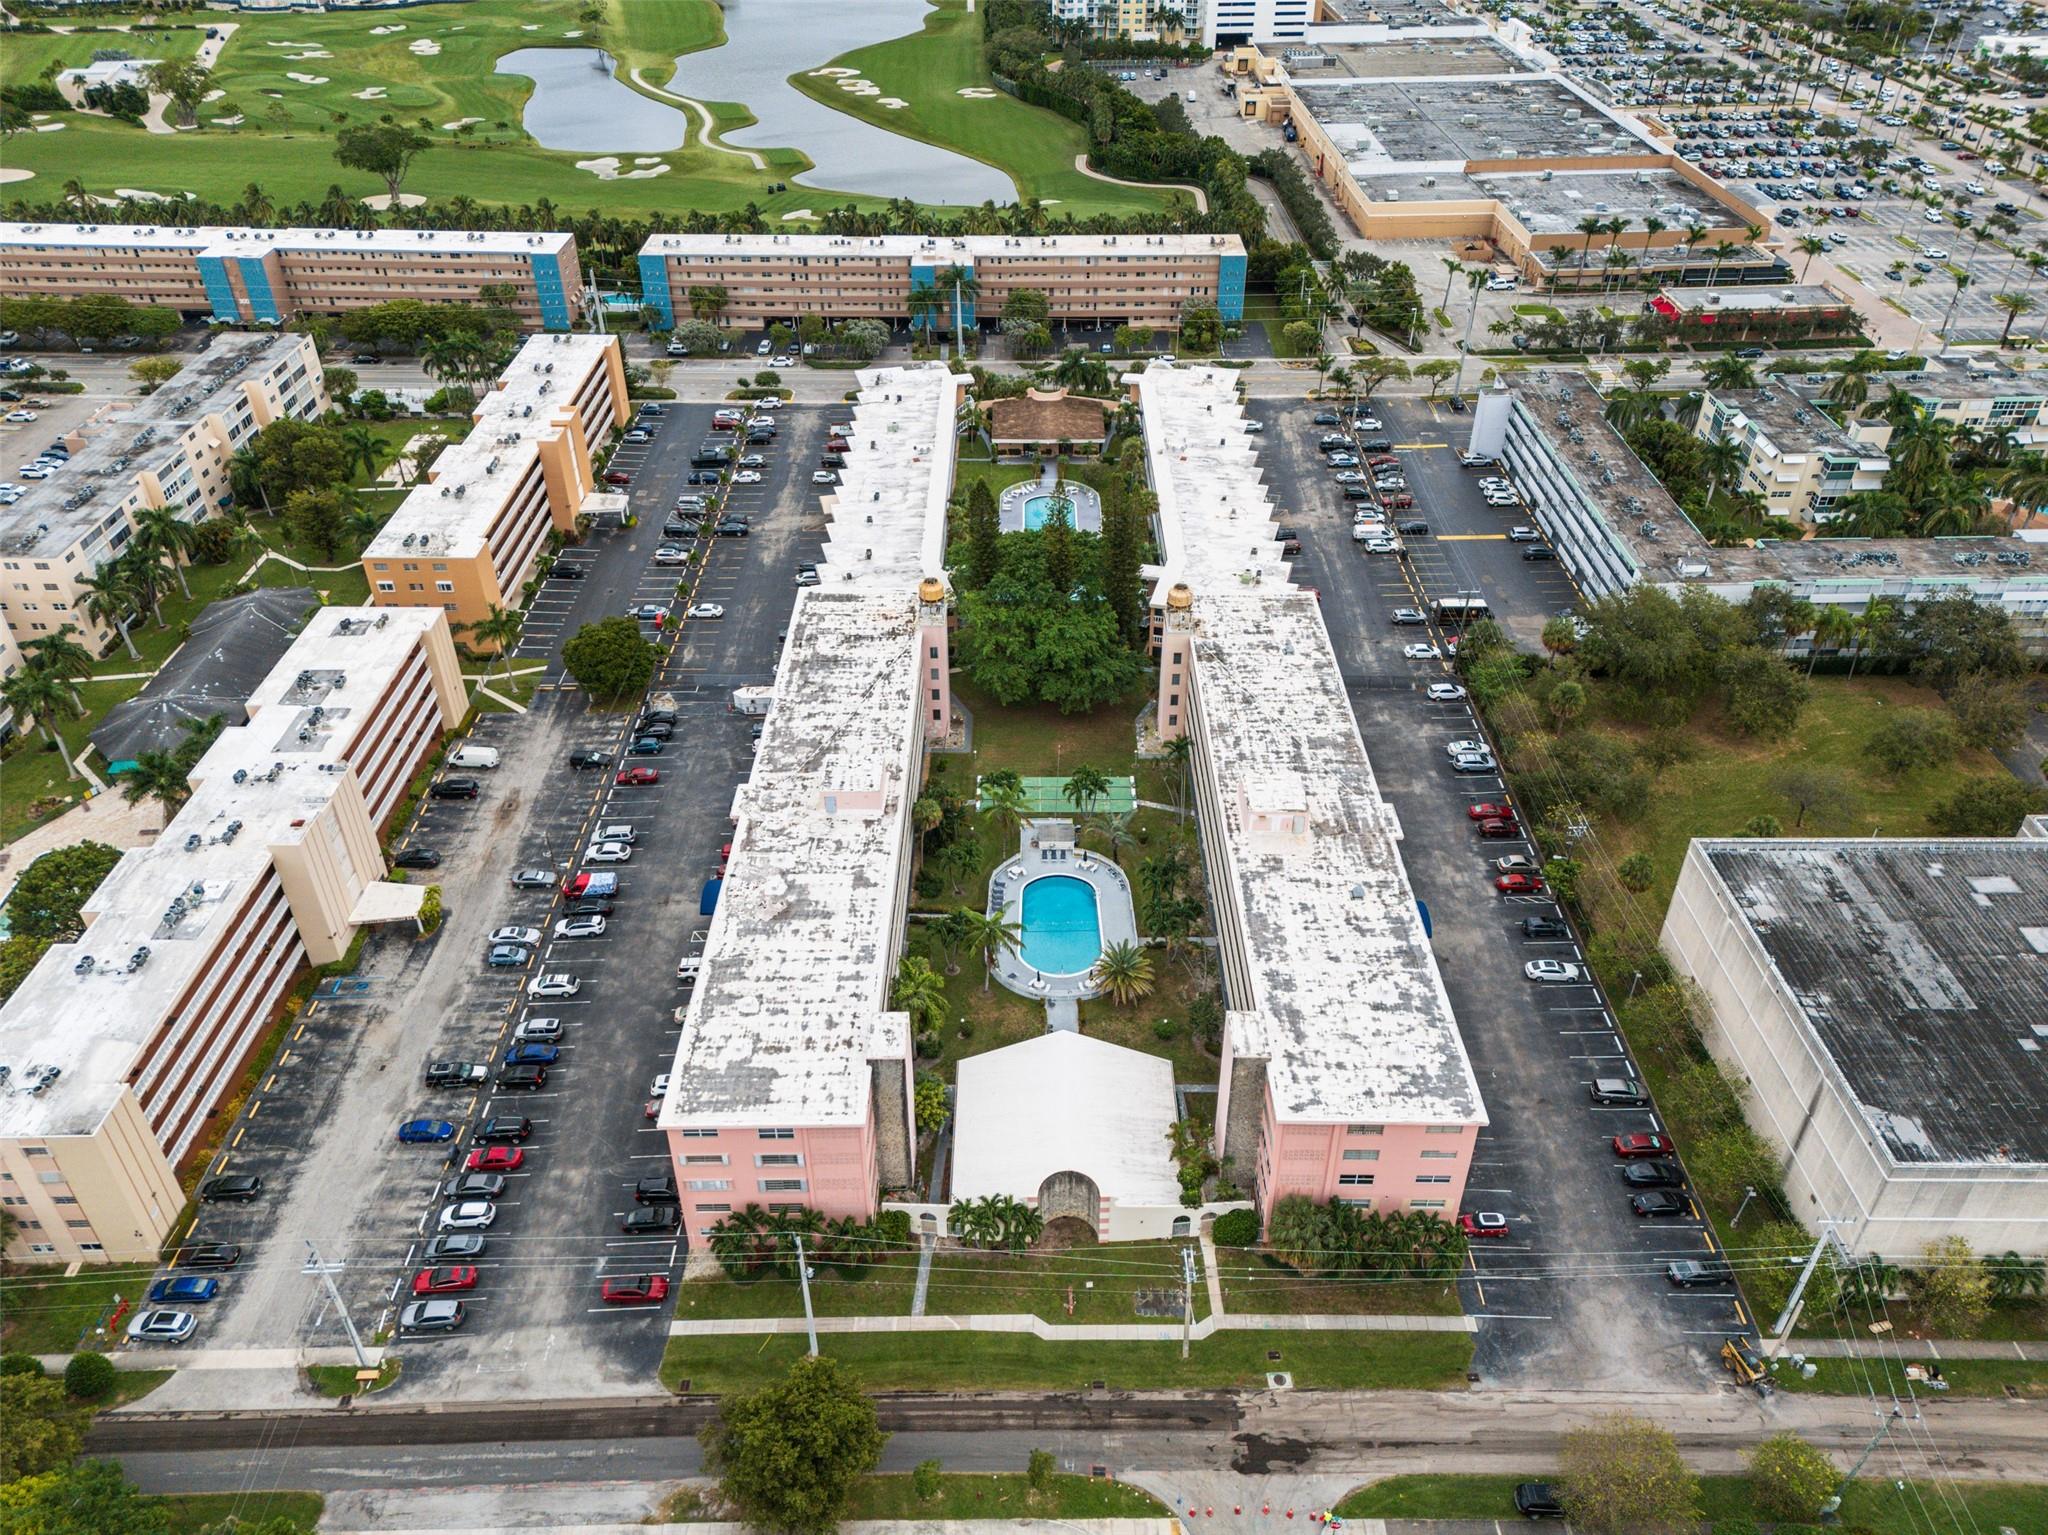
Active
$230,000
2
bds
|
2
ba
|
993
sqft
|
built
1966
200 NE 12th Ave, Hallandale Beach, FL 33009
$-762
Cash flow
-17.3%
Cash-on-Cash Return
2.2%
Cap rate
1.0%
Rent to Value Ratio
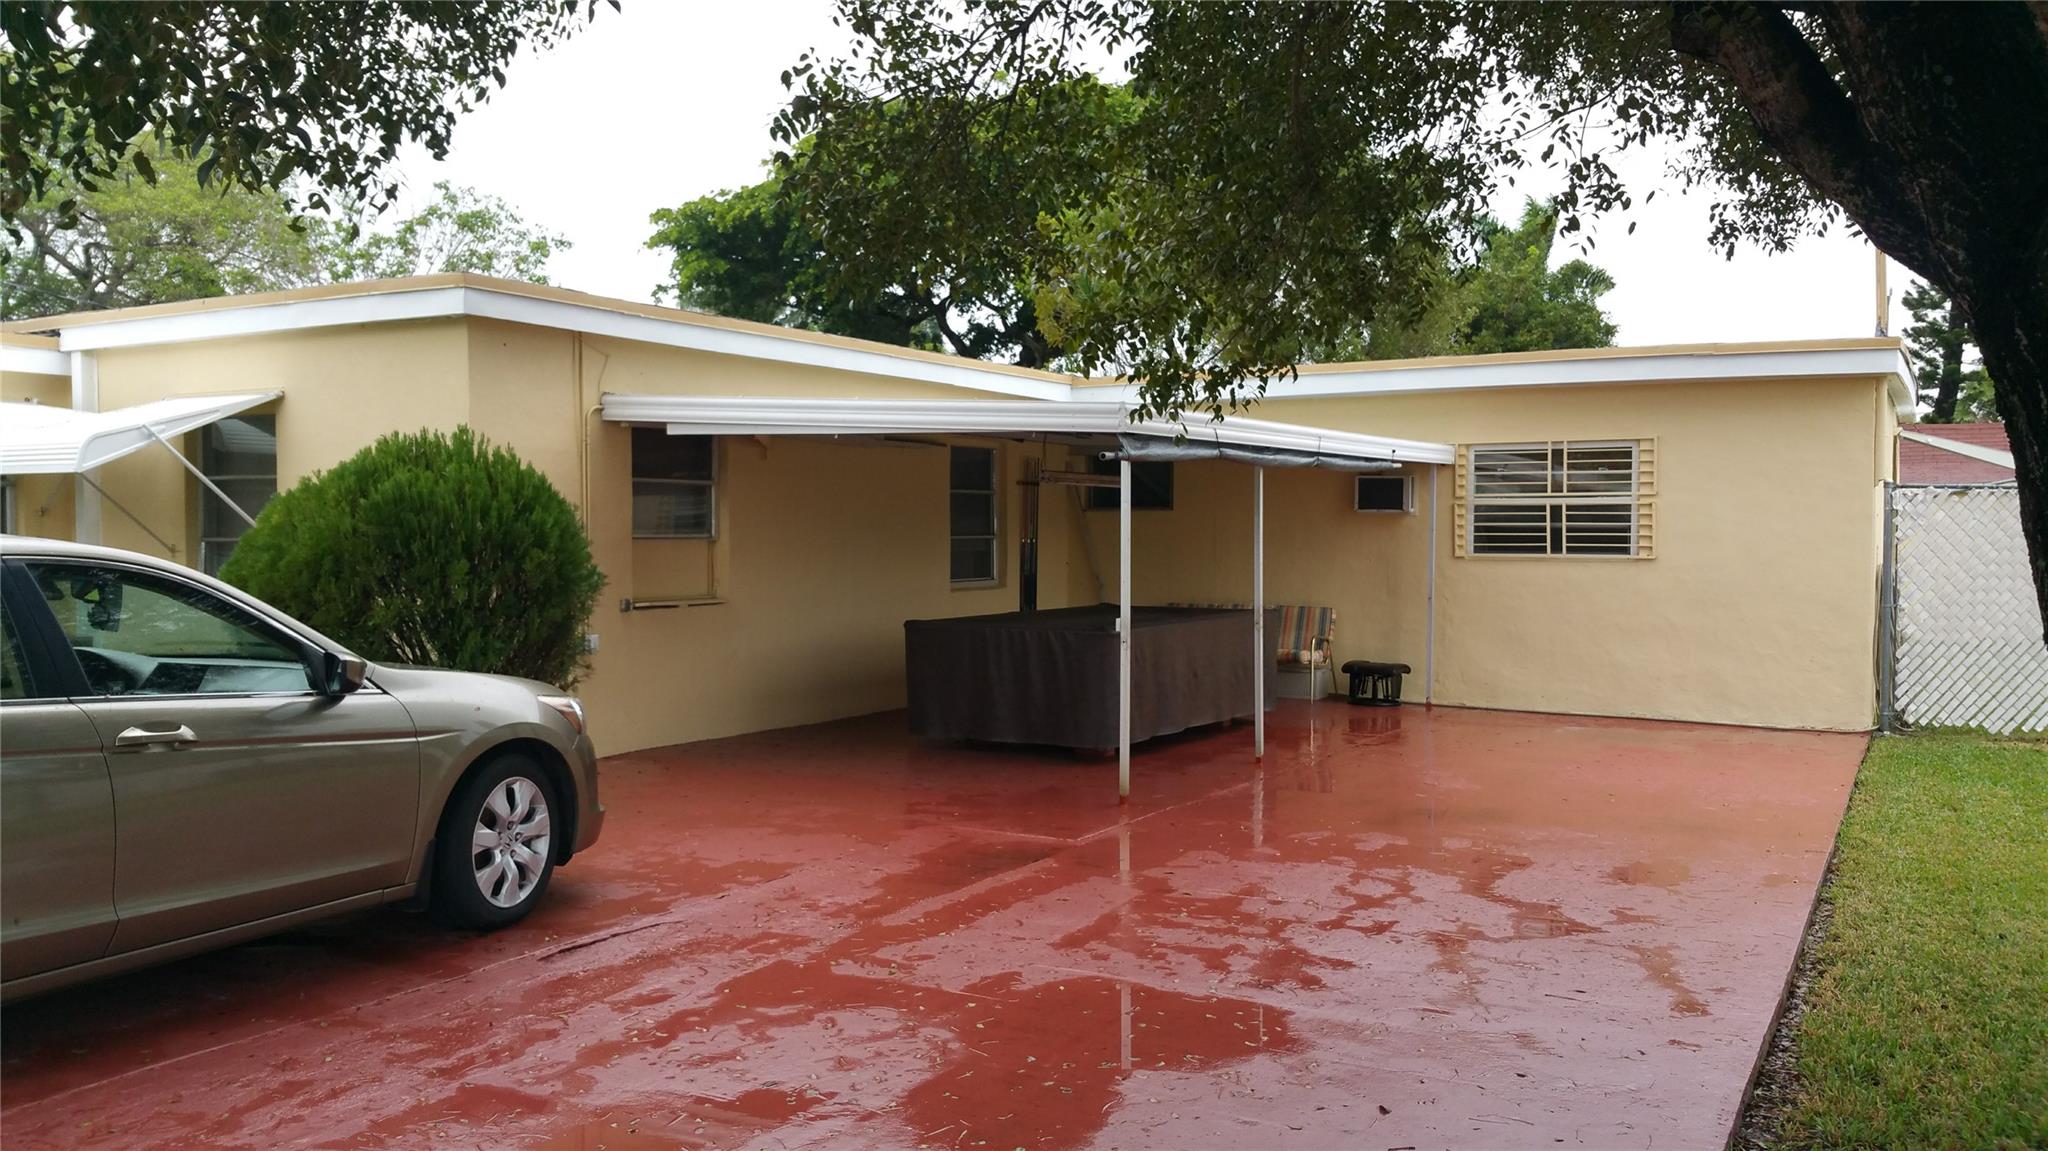
Active
$675,000
bds
|
0
ba
|
2,930
sqft
|
built
1951
219 NE 4th St, Hallandale Beach, FL 33009
$-2,694
Cash flow
-20.8%
Cash-on-Cash Return
1.4%
Cap rate
0.3%
Rent to Value Ratio
Active
$550,000
2
bds
|
2
ba
|
1,248
sqft
|
built
1970
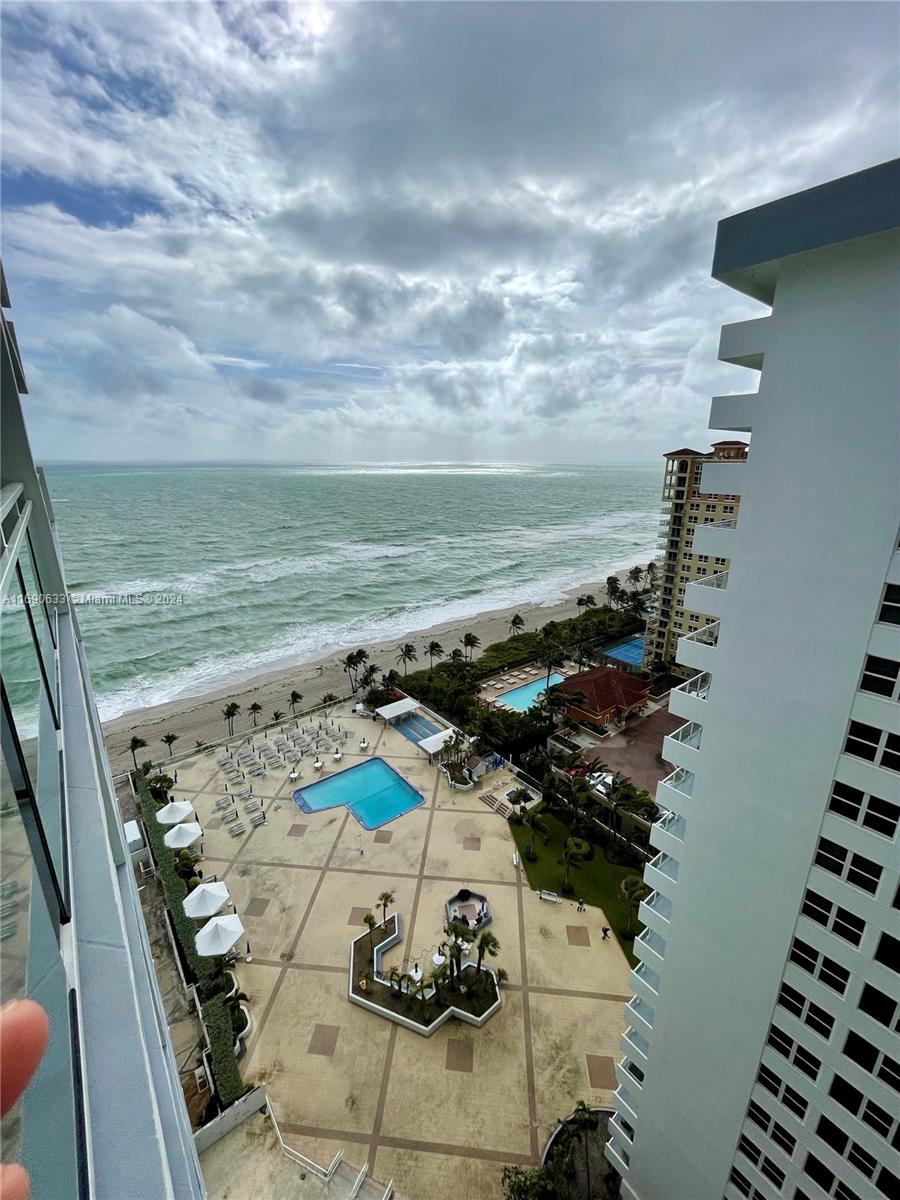
2030 S Ocean Dr, Hallandale Beach, FL 33009
$-2,370
Cash flow
-22.5%
Cash-on-Cash Return
1.0%
Cap rate
0.6%
Rent to Value Ratio
Active
$437,500
2
bds
|
2
ba
|
1,360
sqft
|
built
1972
1833 S Ocean Dr, Hallandale Beach, FL 33009
$-1,446
Cash flow
-17.2%
Cash-on-Cash Return
2.2%
Cap rate
0.8%
Rent to Value Ratio

Active
$3,750,000
4
bds
|
4
ba
|
2,913
sqft
|
built
2022
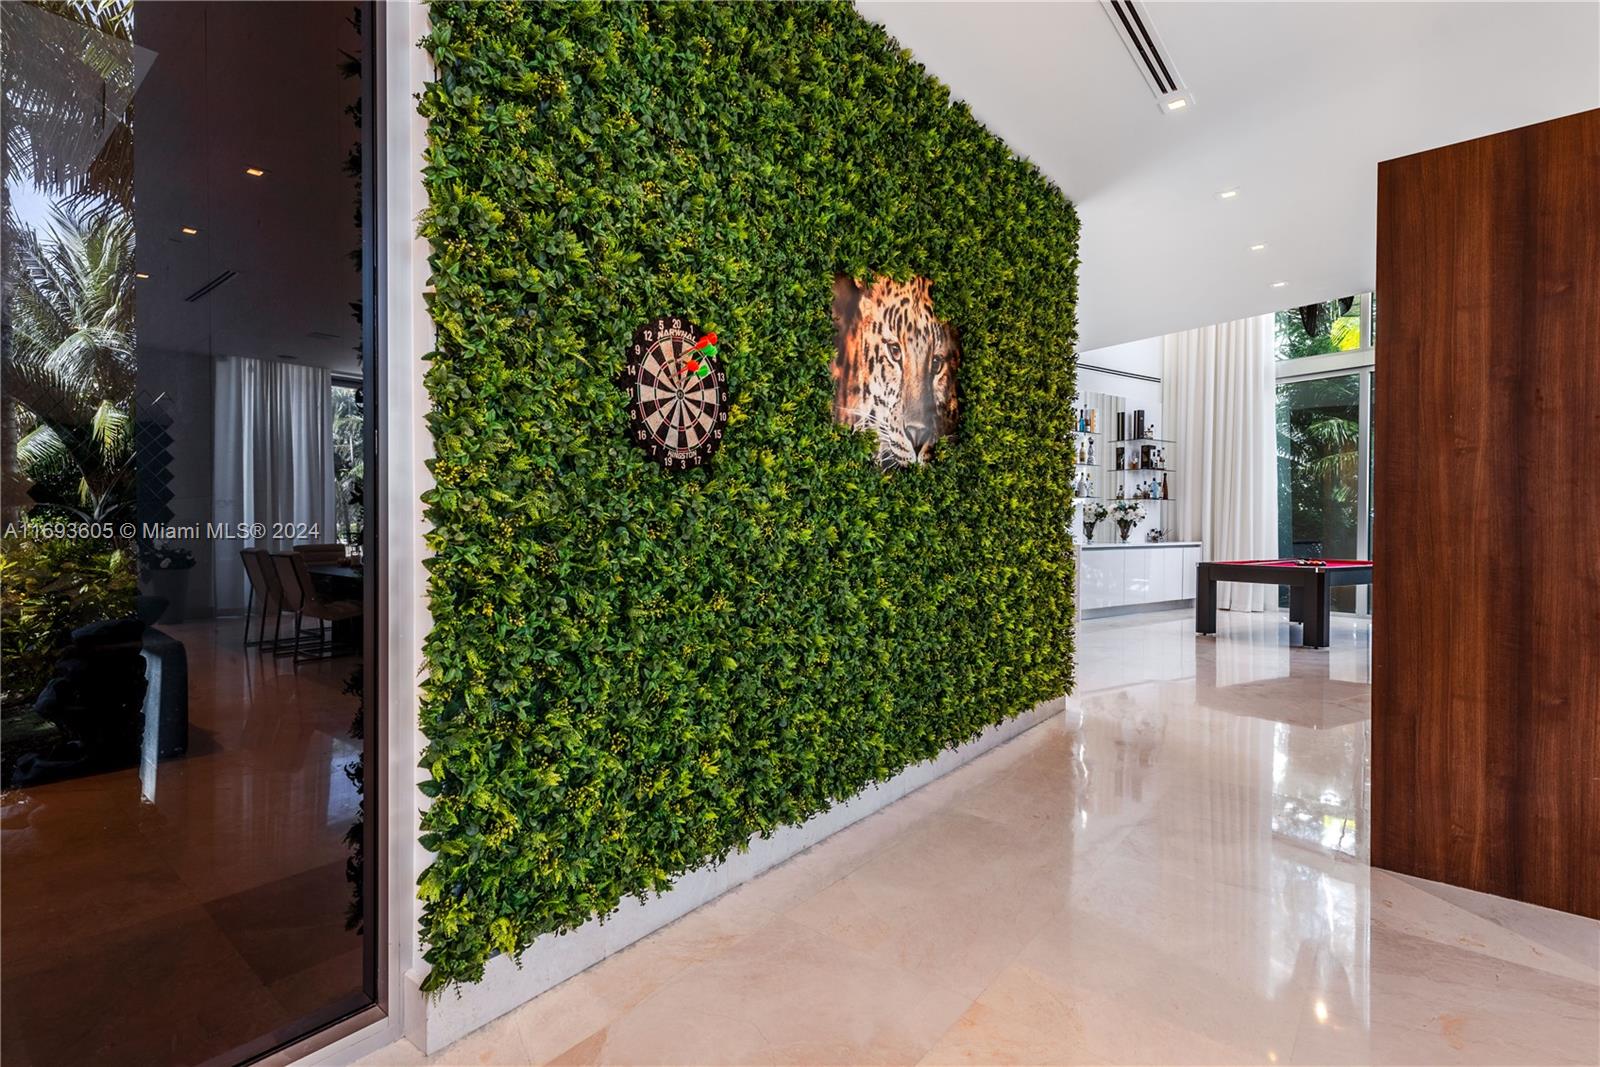
2000 S Ocean Dr, Hallandale Beach, FL 33009
$-22,475
Cash flow
-31.3%
Cash-on-Cash Return
-1.0%
Cap rate
0.3%
Rent to Value Ratio
Active
$8,780,000
6
bds
|
7
ba
|
6,755
sqft
|
built
2017
400 Tamarind Dr, Hallandale Beach, FL 33009
$-47,089
Cash flow
-28.0%
Cash-on-Cash Return
-0.3%
Cap rate
0.1%
Rent to Value Ratio
Active
$285,000
2
bds
|
2
ba
|
1,080
sqft
|
built
1967
120 Golden Isles Dr, Hallandale Beach, FL 33009
$-925
Cash flow
-16.9%
Cash-on-Cash Return
2.3%
Cap rate
0.9%
Rent to Value Ratio
Active
$265,000
1
bds
|
2
ba
|
870
sqft
|
built
1970
1849 S Ocean Dr, Hallandale Beach, FL 33009
$-940
Cash flow
-18.5%
Cash-on-Cash Return
1.9%
Cap rate
0.8%
Rent to Value Ratio
Active
$229,000
2
bds
|
2
ba
|
1,075
sqft
|
built
1976
800 Parkview Dr, Hallandale Beach, FL 33009
$-775
Cash flow
-17.7%
Cash-on-Cash Return
2.1%
Cap rate
1.1%
Rent to Value Ratio
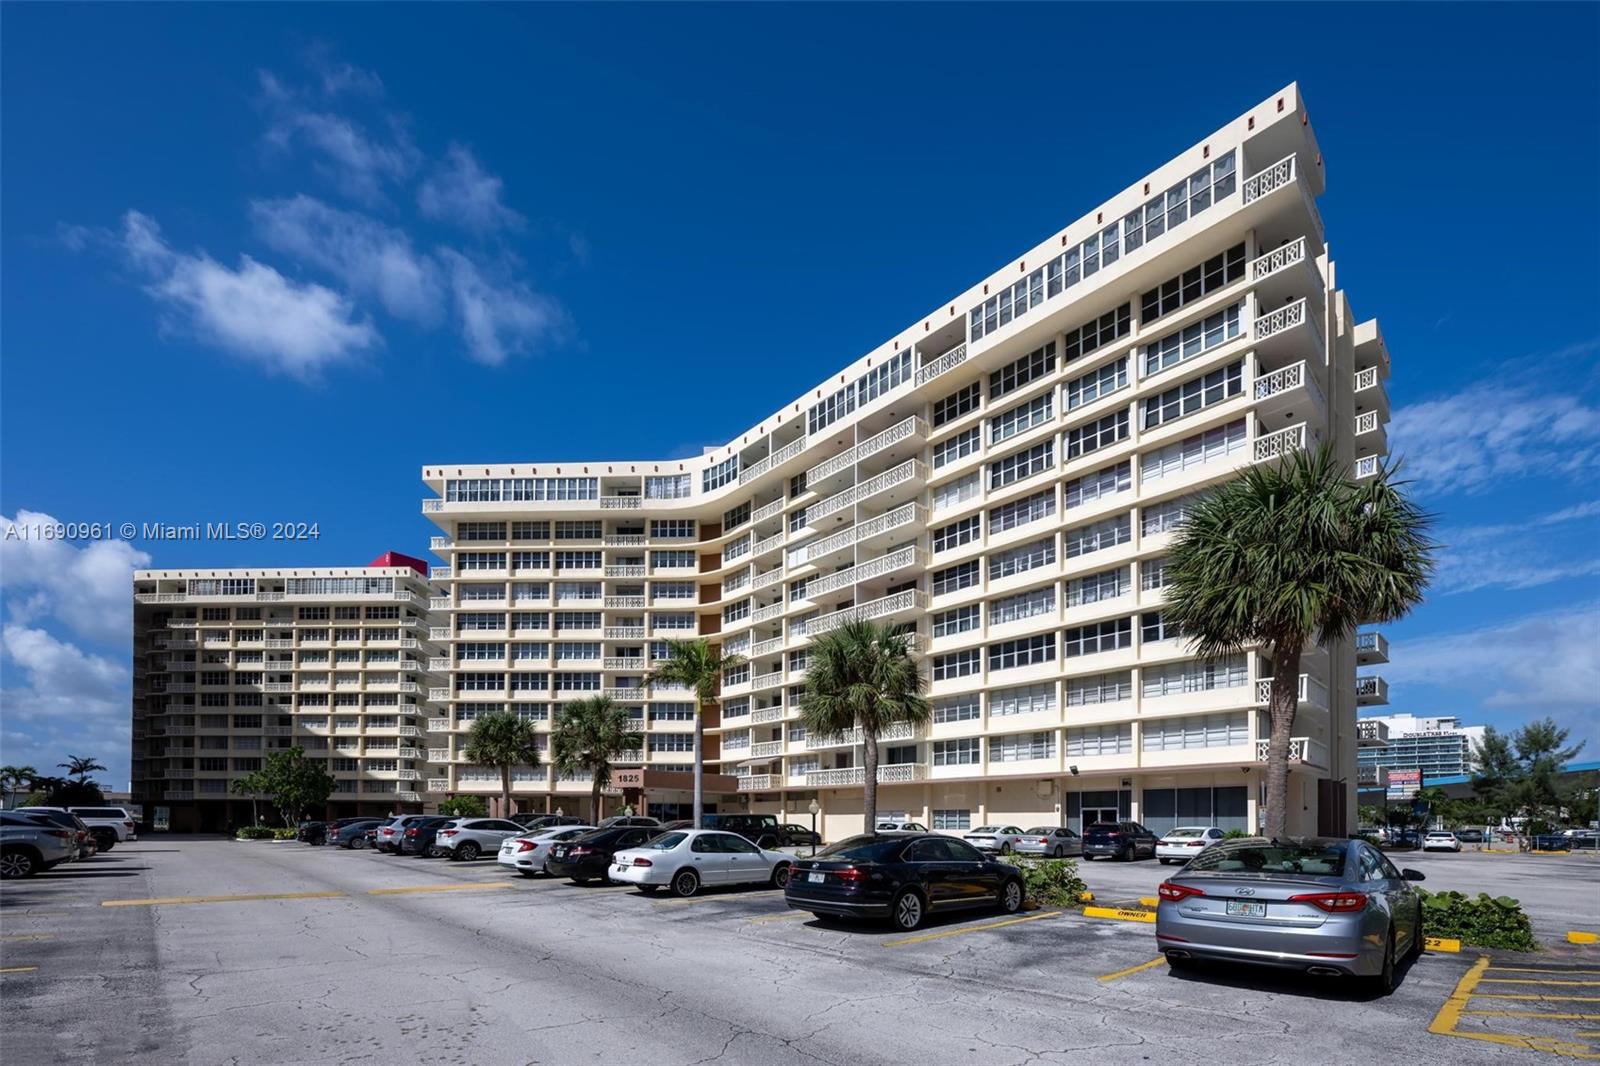
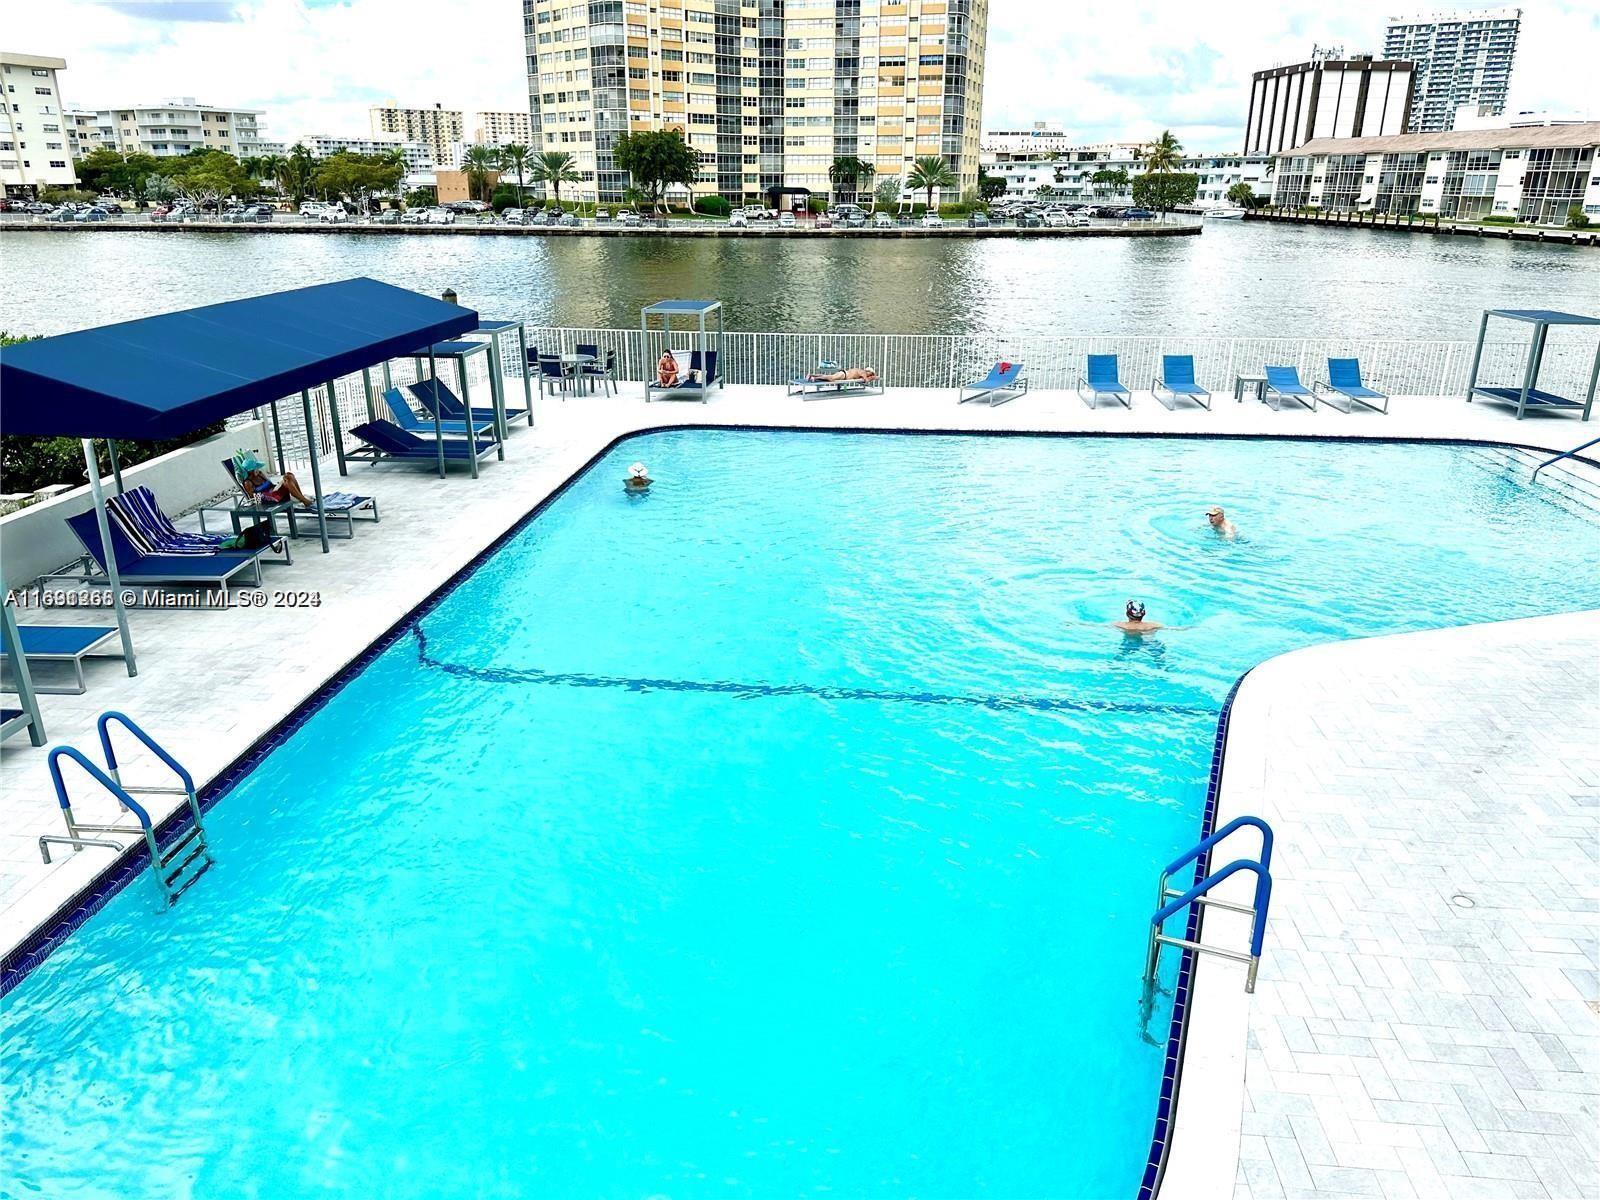
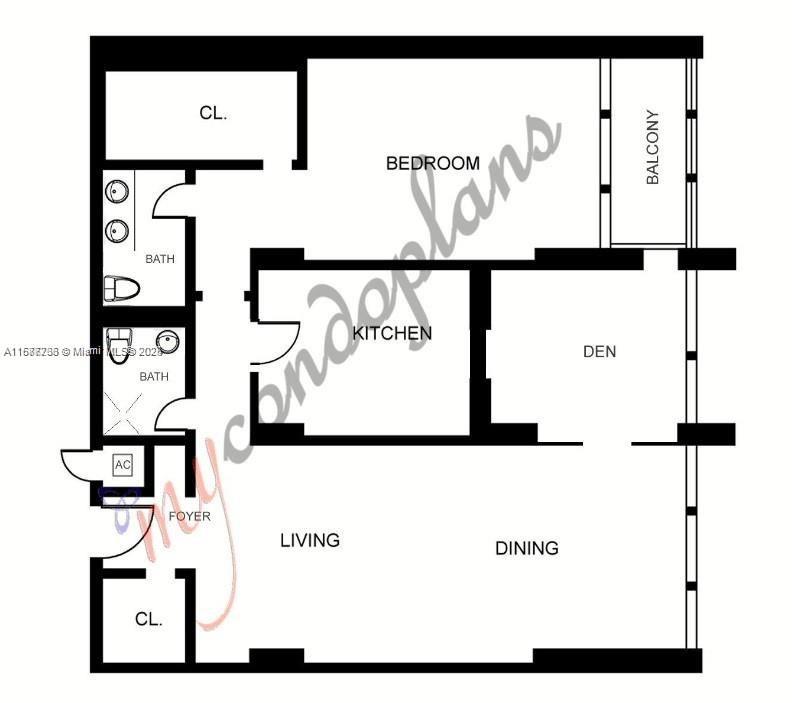
Active
$198,000
1
bds
|
2
ba
|
780
sqft
|
built
1969
1825 S Ocean Dr, Hallandale Beach, FL 33009
$-775
Cash flow
-20.4%
Cash-on-Cash Return
1.4%
Cap rate
0.9%
Rent to Value Ratio

Active
$342,000
3
bds
|
2
ba
|
1,430
sqft
|
built
1976
800 Parkview Dr, Hallandale Beach, FL 33009
$-1,200
Cash flow
-18.3%
Cash-on-Cash Return
1.9%
Cap rate
0.9%
Rent to Value Ratio
Active
$1,075,000
2
bds
|
2
ba
|
1,782
sqft
|
built
2005
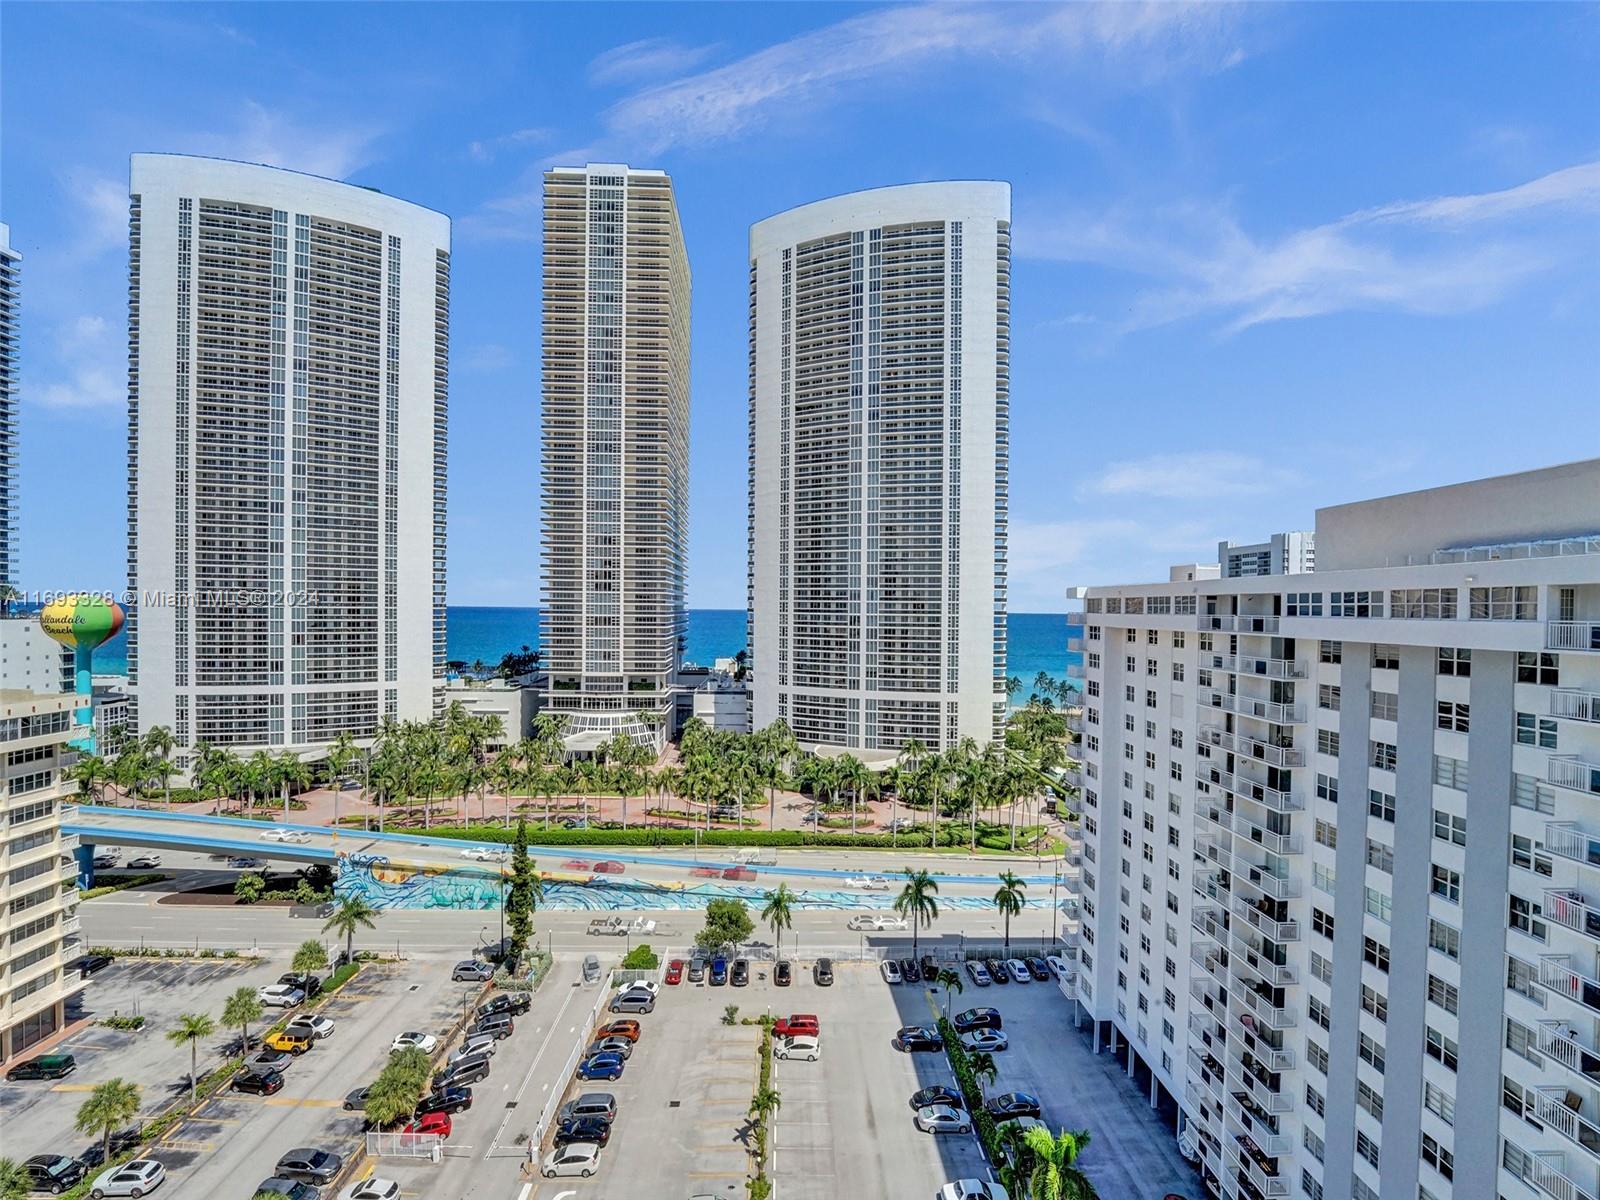
1850 S Ocean Dr, Hallandale Beach, FL 33009
$-4,097
Cash flow
-19.9%
Cash-on-Cash Return
1.6%
Cap rate
0.6%
Rent to Value Ratio
Active
$519,000
2
bds
|
2
ba
|
1,275
sqft
|
built
1970
1965 S Ocean Dr, Hallandale Beach, FL 33009
$-551
Cash flow
-5.5%
Cash-on-Cash Return
4.9%
Cap rate
0.8%
Rent to Value Ratio
Active
$369,000
2
bds
|
2
ba
|
1,150
sqft
|
built
1970
200 Diplomat Pkwy, Hallandale Beach, FL 33009
$-1,222
Cash flow
-17.3%
Cash-on-Cash Return
2.2%
Cap rate
0.9%
Rent to Value Ratio
Active
$225,000
1
bds
|
2
ba
|
850
sqft
|
built
1970
300 Diplomat Pkwy, Hallandale Beach, FL 33009
$-711
Cash flow
-16.5%
Cash-on-Cash Return
2.4%
Cap rate
1.1%
Rent to Value Ratio
Active
$225,000
1
bds
|
2
ba
|
915
sqft
|
built
1979
600 Parkview Dr, Hallandale Beach, FL 33009
$-603
Cash flow
-14.0%
Cash-on-Cash Return
2.9%
Cap rate
1.0%
Rent to Value Ratio
Active
$329,000
1
bds
|
2
ba
|
950
sqft
|
built
1980
2500 Parkview Dr, Hallandale Beach, FL 33009
$-541
Cash flow
-8.6%
Cash-on-Cash Return
4.2%
Cap rate
1.1%
Rent to Value Ratio
Active
$414,900
2
bds
|
2
ba
|
1,580
sqft
|
built
1980
2500 Parkview Dr, Hallandale Beach, FL 33009
$-1,798
Cash flow
-22.6%
Cash-on-Cash Return
0.9%
Cap rate
0.7%
Rent to Value Ratio
Active
$295,250
2
bds
|
2
ba
|
1,075
sqft
|
built
1981
200 Leslie Dr, Hallandale Beach, FL 33009
$-1,194
Cash flow
-21.1%
Cash-on-Cash Return
1.3%
Cap rate
0.9%
Rent to Value Ratio
Active
$195,000
1
bds
|
1
ba
|
660
sqft
|
built
1967
180 NE 12th Ave, Hallandale Beach, FL 33009
$287
Cash flow
7.7%
Cash-on-Cash Return
7.9%
Cap rate
1.0%
Rent to Value Ratio

Active
$930,000
3
bds
|
3
ba
|
2,305
sqft
|
built
1975
1920 S Ocean Dr, Hallandale Beach, FL 33009
$-3,723
Cash flow
-20.9%
Cash-on-Cash Return
1.3%
Cap rate
0.5%
Rent to Value Ratio

Active
$195,000
2
bds
|
1
ba
|
0
sqft
|
built
1978
455 Golden Isles Dr, Hallandale Beach, FL 33009
$-735
Cash flow
-19.7%
Cash-on-Cash Return
1.6%
Cap rate
1.0%
Rent to Value Ratio

Active
$399,000
1
bds
|
2
ba
|
1,300
sqft
|
built
1974
1865 S Ocean Dr, Hallandale Beach, FL 33009
$-1,455
Cash flow
-19.0%
Cash-on-Cash Return
1.8%
Cap rate
0.7%
Rent to Value Ratio

Active
$335,000
2
bds
|
2
ba
|
940
sqft
|
built
1980
1913 S Ocean Dr, Hallandale Beach, FL 33009
$-1,247
Cash flow
-19.4%
Cash-on-Cash Return
1.7%
Cap rate
0.7%
Rent to Value Ratio
Active
$435,000
2
bds
|
2
ba
|
1,080
sqft
|
built
1966
126 Golden Isles Dr, Hallandale Beach, FL 33009
$-1,480
Cash flow
-17.8%
Cash-on-Cash Return
2.1%
Cap rate
0.8%
Rent to Value Ratio
Active
$285,000
1
bds
|
1
ba
|
825
sqft
|
built
1968
111 Golden Isles Dr, Hallandale Beach, FL 33009
$-840
Cash flow
-15.4%
Cash-on-Cash Return
2.6%
Cap rate
0.8%
Rent to Value Ratio

Active
$450,000
2
bds
|
2
ba
|
1,360
sqft
|
built
1972
1833 S Ocean Dr, Hallandale Beach, FL 33009
$-1,679
Cash flow
-19.5%
Cash-on-Cash Return
1.7%
Cap rate
0.7%
Rent to Value Ratio
Active
$294,900
2
bds
|
2
ba
|
1,400
sqft
|
built
1975
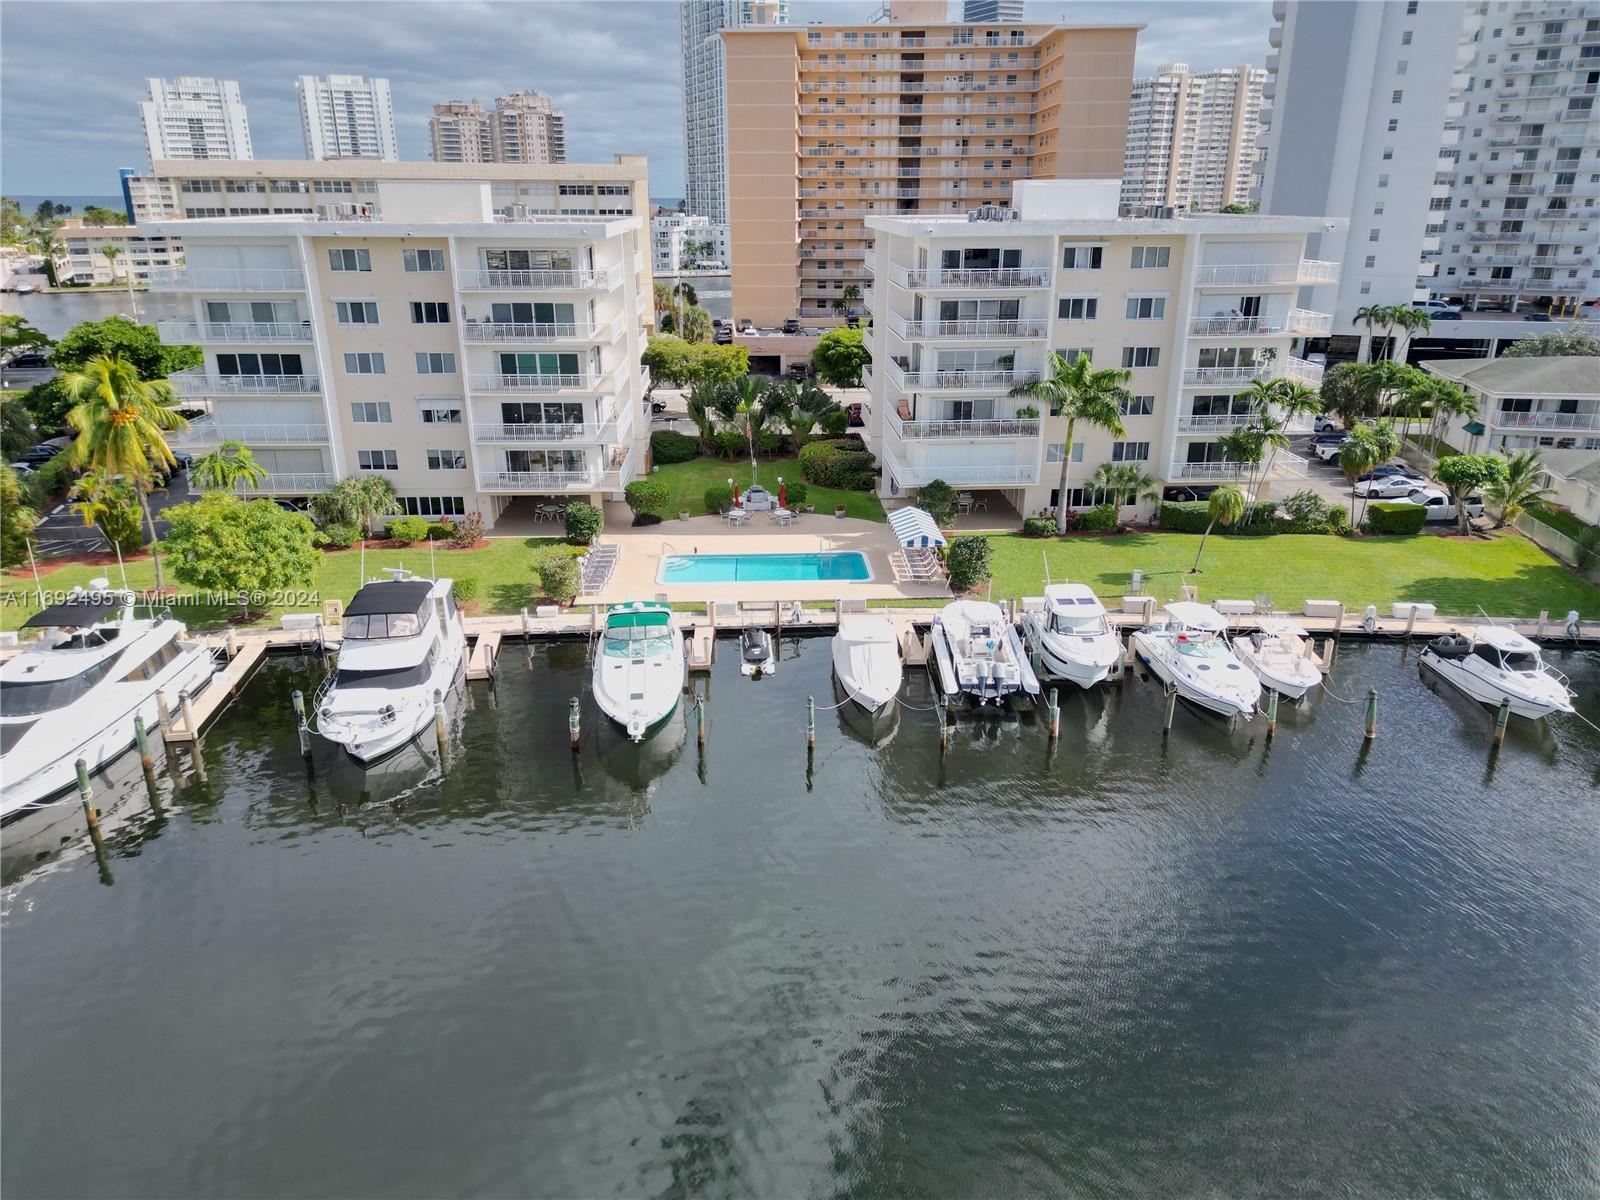
600 Three Islands Blvd, Hallandale Beach, FL 33009
$-1,754
Cash flow
-31.0%
Cash-on-Cash Return
-1.0%
Cap rate
0.9%
Rent to Value Ratio

Active
$279,900
1
bds
|
2
ba
|
1,000
sqft
|
built
1975
600 Three Islands Blvd, Hallandale Beach, FL 33009
$-988
Cash flow
-18.4%
Cash-on-Cash Return
1.9%
Cap rate
0.8%
Rent to Value Ratio
Active
$369,000
3
bds
|
1
ba
|
795
sqft
|
built
1979
709 NW 6th St, Hallandale Beach, FL 33009
$-459
Cash flow
-6.5%
Cash-on-Cash Return
4.7%
Cap rate
0.8%
Rent to Value Ratio
Active
$997,900
3
bds
|
3
ba
|
1,737
sqft
|
built
2015
2600 E Hallandale Beach Blvd, Hallandale Beach, FL 33009
$-4,047
Cash flow
-21.2%
Cash-on-Cash Return
1.3%
Cap rate
0.6%
Rent to Value Ratio
Active
$270,000
1
bds
|
2
ba
|
1,016
sqft
|
built
1971
3161 S Ocean Dr, Hallandale Beach, FL 33009
$-248
Cash flow
-4.8%
Cash-on-Cash Return
5.0%
Cap rate
0.9%
Rent to Value Ratio
Active
$258,000
2
bds
|
2
ba
|
1,150
sqft
|
built
1970
300 Diplomat Pkwy, Hallandale Beach, FL 33009
$-994
Cash flow
-20.1%
Cash-on-Cash Return
1.5%
Cap rate
1.0%
Rent to Value Ratio
Active
$929,000
2
bds
|
2
ba
|
1,500
sqft
|
built
1979
3140 S Ocean Dr, Hallandale Beach, FL 33009
$-2,072
Cash flow
-11.6%
Cash-on-Cash Return
3.5%
Cap rate
0.7%
Rent to Value Ratio
Active
$385,000
2
bds
|
2
ba
|
1,259
sqft
|
built
1973
100 Golden Isles Dr, Hallandale Beach, FL 33009
$-1,436
Cash flow
-19.5%
Cash-on-Cash Return
1.7%
Cap rate
0.8%
Rent to Value Ratio
Active
$950,000
3
bds
|
3
ba
|
1,571
sqft
|
built
2006
1800 S Ocean Dr, Hallandale Beach, FL 33009
$-3,435
Cash flow
-18.9%
Cash-on-Cash Return
1.8%
Cap rate
0.5%
Rent to Value Ratio

Active
$8,999,000
6
bds
|
7
ba
|
7,948
sqft
|
built
2021
406 Tamarind Dr, Hallandale Beach, FL 33009
$-47,594
Cash flow
-27.6%
Cash-on-Cash Return
-0.2%
Cap rate
0.1%
Rent to Value Ratio
Closed
$169,000
1
bds
|
2
ba
|
828
sqft
|
built
1974
500 Three Islands Blvd, Hallandale Beach, FL 33009
$-673
Cash flow
-20.8%
Cash-on-Cash Return
1.4%
Cap rate
1.2%
Rent to Value Ratio
Active
$1,285,000
3
bds
|
2
ba
|
1,554
sqft
|
built
2006
1830 S Ocean Dr, Hallandale Beach, FL 33009
$-6,263
Cash flow
-25.4%
Cash-on-Cash Return
0.3%
Cap rate
0.4%
Rent to Value Ratio
Active
$2,300,000
3
bds
|
3
ba
|
1,841
sqft
|
built
2005
1850 S Ocean Dr, Hallandale Beach, FL 33009
$-7,719
Cash flow
-17.5%
Cash-on-Cash Return
2.1%
Cap rate
0.4%
Rent to Value Ratio