Hallandale Beach, FL Investment Properties for Sale
Browse homes for sale and investment properties in Hallandale Beach, FL. Refine your search by price, property type, or more.
Best cash flowing properties in Hallandale Beach, FL
Active
$150,000
1
bds
|
1
ba
|
730
sqft
|
built
1968
233 NE 14th Ave, Hallandale Beach, FL 33009
$-119
Cash flow
-4.1%
Cash-on-Cash Return
5.2%
Cap rate
1.2%
Rent to Value Ratio
Active
$150,000
1
bds
|
2
ba
|
847
sqft
|
built
1972
420 NE 12th Ave, Hallandale Beach, FL 33009
$-244
Cash flow
-8.5%
Cash-on-Cash Return
4.2%
Cap rate
1.2%
Rent to Value Ratio
832 out of 930 properties for sale in Hallandale Beach, FL
Limited Results Shown
Create a free account, or log in to reveal all property listings and enjoy the complete experience.
Active
$186,000
1
bds
|
1
ba
|
700
sqft
|
built
1980
300 Layne Blvd, Hallandale Beach, FL 33009
$-634
Cash flow
-17.8%
Cash-on-Cash Return
2.1%
Cap rate
1.0%
Rent to Value Ratio
Active
$674,000
3
bds
|
2
ba
|
990
sqft
|
built
1955
925 NE 4th St, Hallandale Beach, FL 33009
$-1,278
Cash flow
-9.9%
Cash-on-Cash Return
3.9%
Cap rate
0.6%
Rent to Value Ratio

Active
$629,500
2
bds
|
2
ba
|
1,270
sqft
|
built
1974
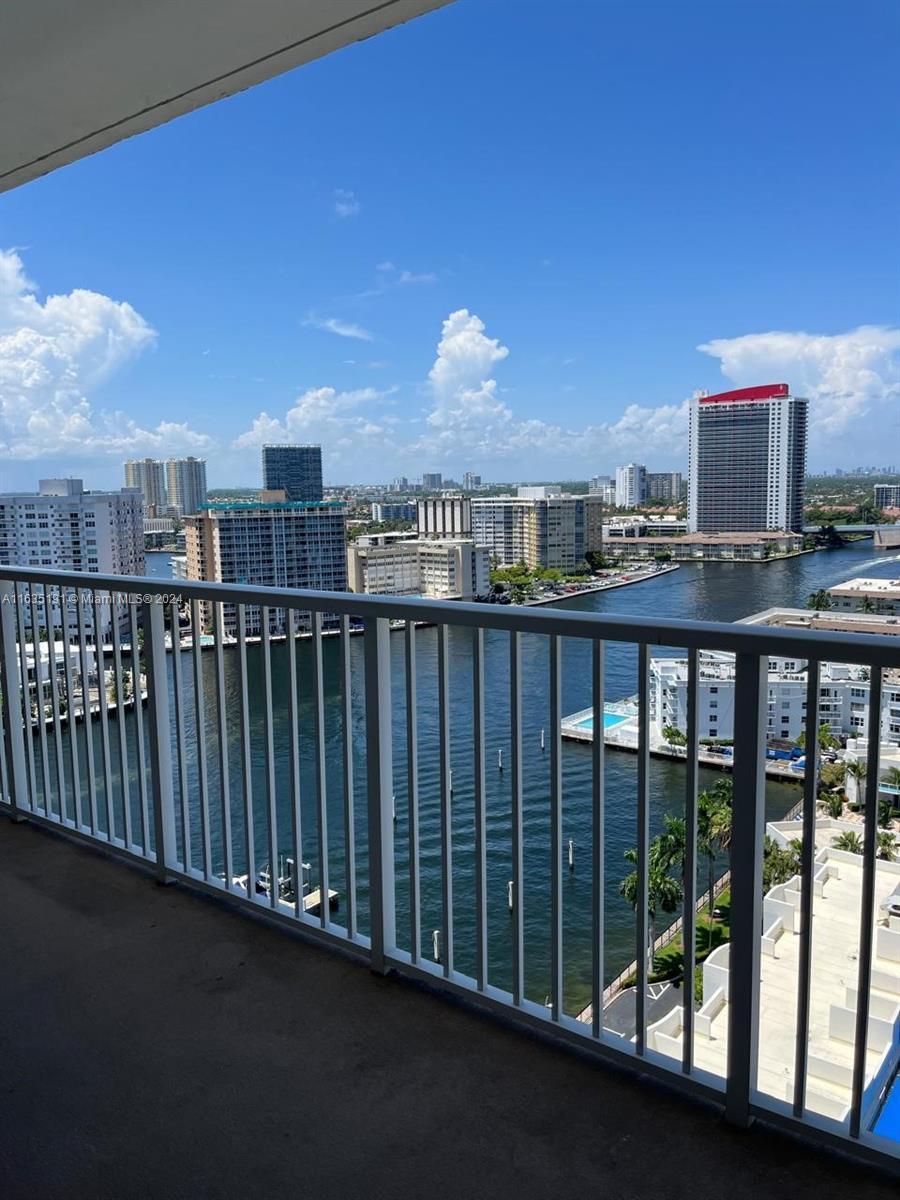
2017 S Ocean Dr, Hallandale Beach, FL 33009
$-1,116
Cash flow
-9.2%
Cash-on-Cash Return
4.0%
Cap rate
0.8%
Rent to Value Ratio

Active
$3,200,000
8
bds
|
10
ba
|
1,715
sqft
|
built
1960
661 Layne Blvd, Hallandale Beach, FL 33009
$-14,925
Cash flow
-24.3%
Cash-on-Cash Return
0.6%
Cap rate
0.2%
Rent to Value Ratio
Active
$1,150,000
3
bds
|
3
ba
|
1,920
sqft
|
built
1974
1880 S Ocean Dr, Hallandale Beach, FL 33009
$-3,702
Cash flow
-16.8%
Cash-on-Cash Return
2.3%
Cap rate
0.7%
Rent to Value Ratio

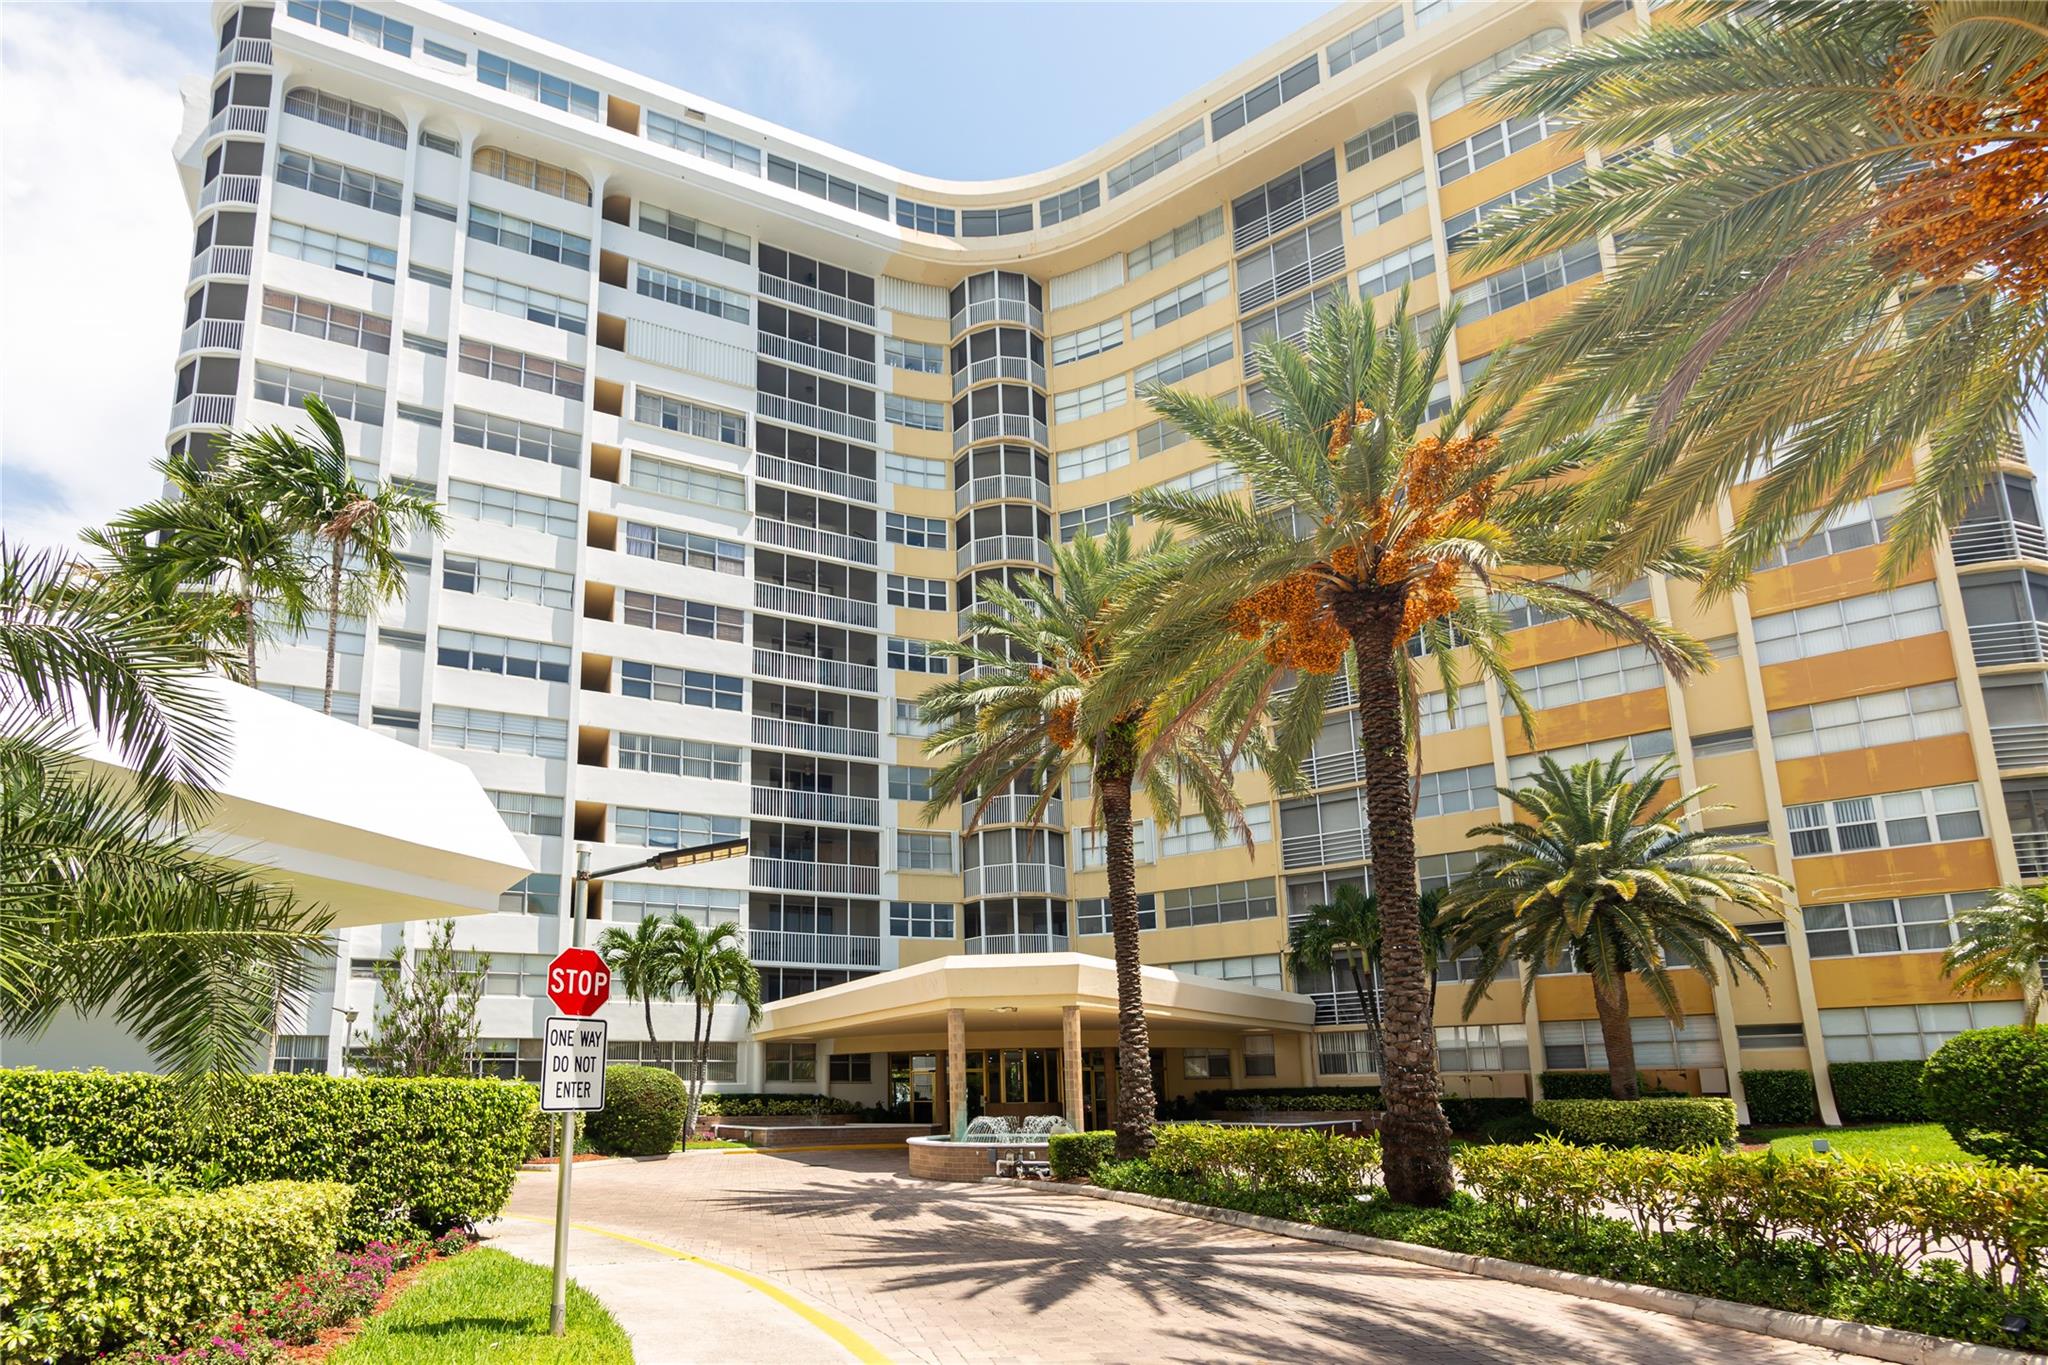
Active
$360,000
2
bds
|
2
ba
|
1,035
sqft
|
built
1968
430 Golden Isles Dr, Hallandale Beach, FL 33009
$-736
Cash flow
-10.7%
Cash-on-Cash Return
3.7%
Cap rate
0.8%
Rent to Value Ratio
Active
$290,000
2
bds
|
2
ba
|
1,050
sqft
|
built
1965
700 Layne Blvd, Hallandale Beach, FL 33009
$-684
Cash flow
-12.3%
Cash-on-Cash Return
3.3%
Cap rate
0.8%
Rent to Value Ratio
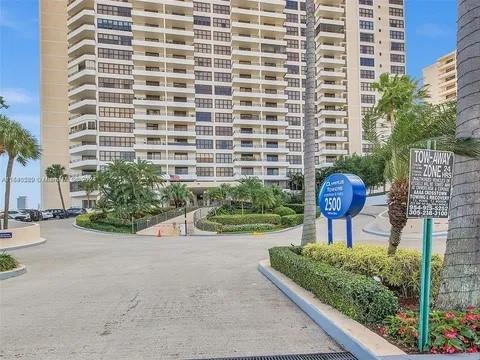
Active
$269,900
2
bds
|
2
ba
|
1,280
sqft
|
built
1980
2500 Parkview Dr, Hallandale Beach, FL 33009
$-843
Cash flow
-16.3%
Cash-on-Cash Return
2.4%
Cap rate
1.0%
Rent to Value Ratio
Active
$250,000
1
bds
|
2
ba
|
1,300
sqft
|
built
1974
1865 S Ocean Dr, Hallandale Beach, FL 33009
$-1,304
Cash flow
-27.2%
Cash-on-Cash Return
-0.1%
Cap rate
0.8%
Rent to Value Ratio
Active
$205,000
1
bds
|
1
ba
|
690
sqft
|
built
1966
105 NE 12th Ave, Hallandale Beach, FL 33009
$-425
Cash flow
-10.8%
Cash-on-Cash Return
3.7%
Cap rate
0.9%
Rent to Value Ratio
Active
$150,000
1
bds
|
1
ba
|
730
sqft
|
built
1968
233 NE 14th Ave, Hallandale Beach, FL 33009
$-119
Cash flow
-4.1%
Cash-on-Cash Return
5.2%
Cap rate
1.2%
Rent to Value Ratio

Active
$329,000
1
bds
|
2
ba
|
1,000
sqft
|
built
1975
600 Three Islands Blvd, Hallandale Beach, FL 33009
$-1,175
Cash flow
-18.6%
Cash-on-Cash Return
1.9%
Cap rate
0.8%
Rent to Value Ratio
Active
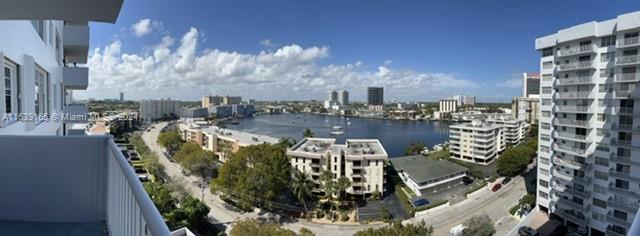
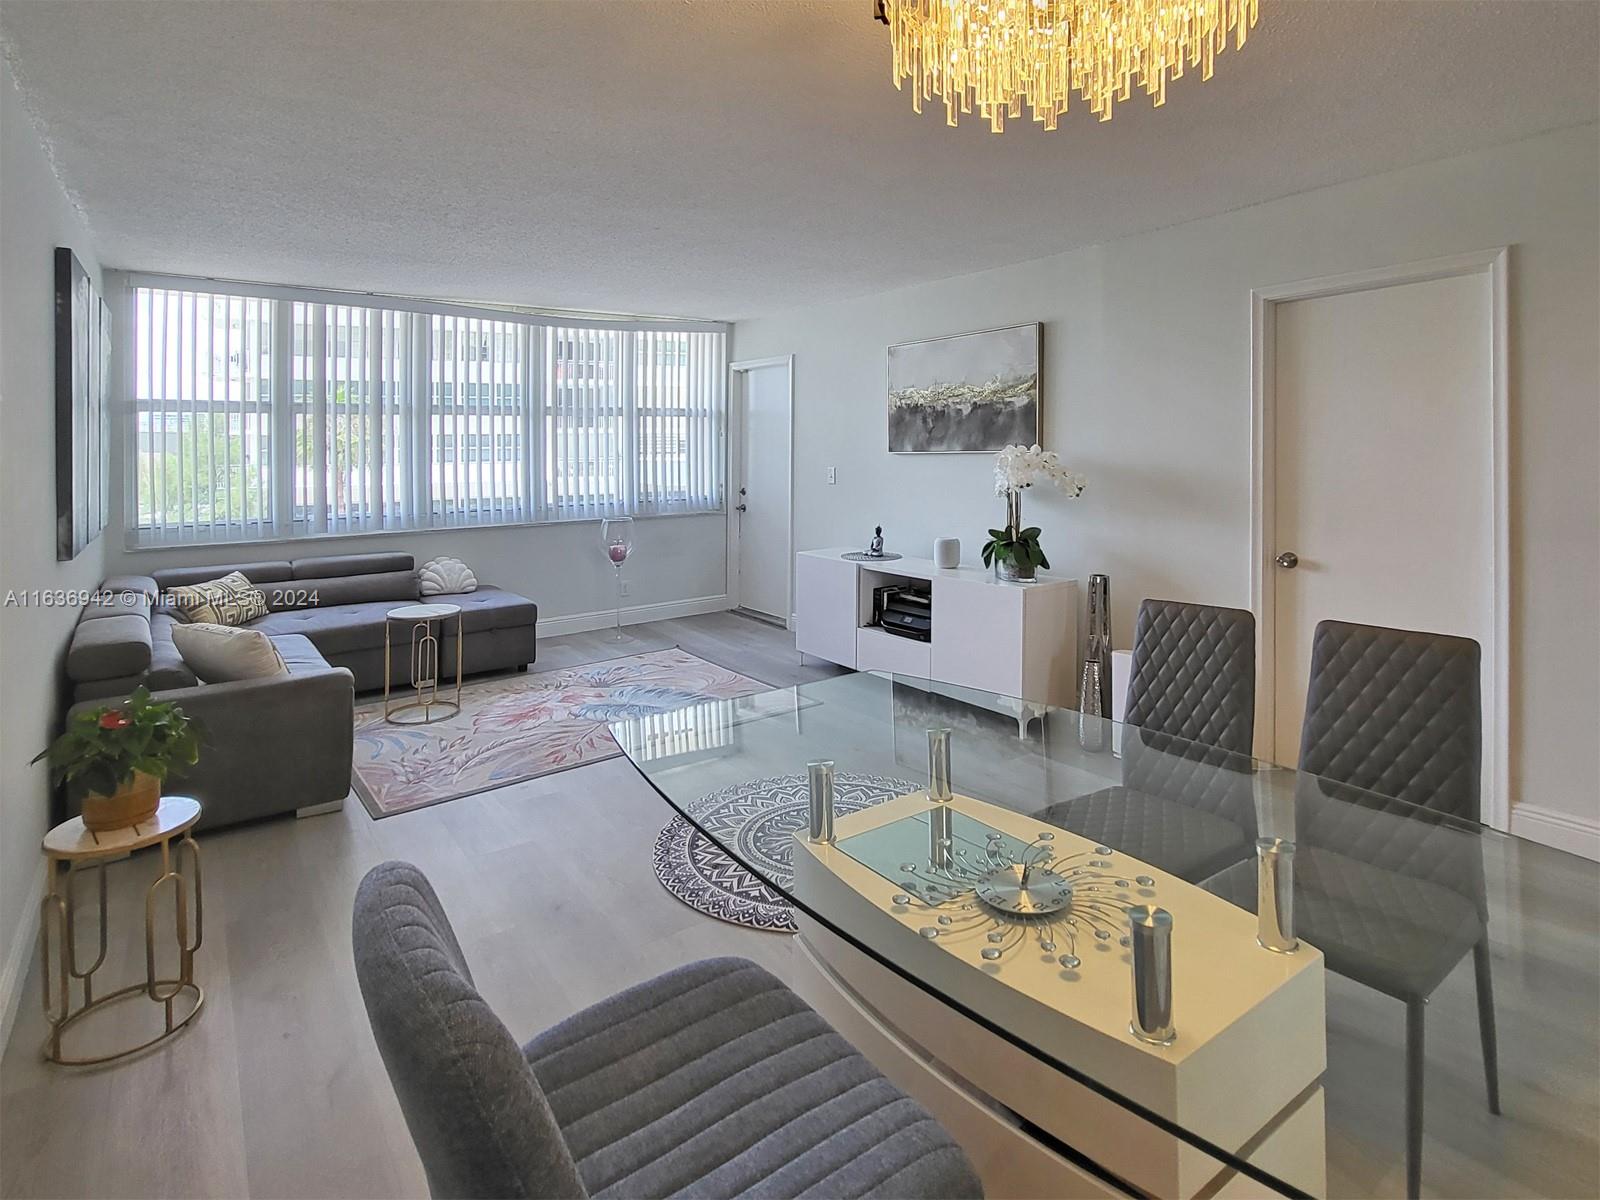
$660,000
2
bds
|
2
ba
|
1,312
sqft
|
built
1970
2030 S Ocean Dr, Hallandale Beach, FL 33009
$-2,654
Cash flow
-21.0%
Cash-on-Cash Return
1.3%
Cap rate
0.6%
Rent to Value Ratio
Active
$500,000
2
bds
|
2
ba
|
1,240
sqft
|
built
1972
1985 S Ocean Dr, Hallandale Beach, FL 33009
$-1,600
Cash flow
-16.7%
Cash-on-Cash Return
2.3%
Cap rate
0.8%
Rent to Value Ratio
Active
$1,894,000
3
bds
|
4
ba
|
2,078
sqft
|
built
2007
1800 S Ocean Dr, Hallandale Beach, FL 33009
$-5,697
Cash flow
-15.7%
Cash-on-Cash Return
2.5%
Cap rate
0.5%
Rent to Value Ratio
Active
$750,000
2
bds
|
1
ba
|
1,086
sqft
|
built
2005
1850 S Ocean Dr, Hallandale Beach, FL 33009
$-2,836
Cash flow
-19.7%
Cash-on-Cash Return
1.6%
Cap rate
0.5%
Rent to Value Ratio
Active
$439,876
2
bds
|
2
ba
|
1,240
sqft
|
built
1972
1985 S Ocean Dr, Hallandale Beach, FL 33009
$-1,845
Cash flow
-21.9%
Cash-on-Cash Return
1.1%
Cap rate
0.7%
Rent to Value Ratio

Active
$395,000
3
bds
|
2
ba
|
1,430
sqft
|
built
1976
1000 Parkview Dr, Hallandale Beach, FL 33009
$-1,613
Cash flow
-21.3%
Cash-on-Cash Return
1.2%
Cap rate
0.7%
Rent to Value Ratio
Active
$282,000
2
bds
|
2
ba
|
1,210
sqft
|
built
1975
601 Three Islands Blvd, Hallandale Beach, FL 33009
$-673
Cash flow
-12.5%
Cash-on-Cash Return
3.3%
Cap rate
0.9%
Rent to Value Ratio
Active
$799,999
bds
|
0
ba
|
1,902
sqft
|
built
1958
1005 NE 2nd St, Hallandale Beach, FL 33009
$-3,338
Cash flow
-21.8%
Cash-on-Cash Return
1.1%
Cap rate
0.3%
Rent to Value Ratio
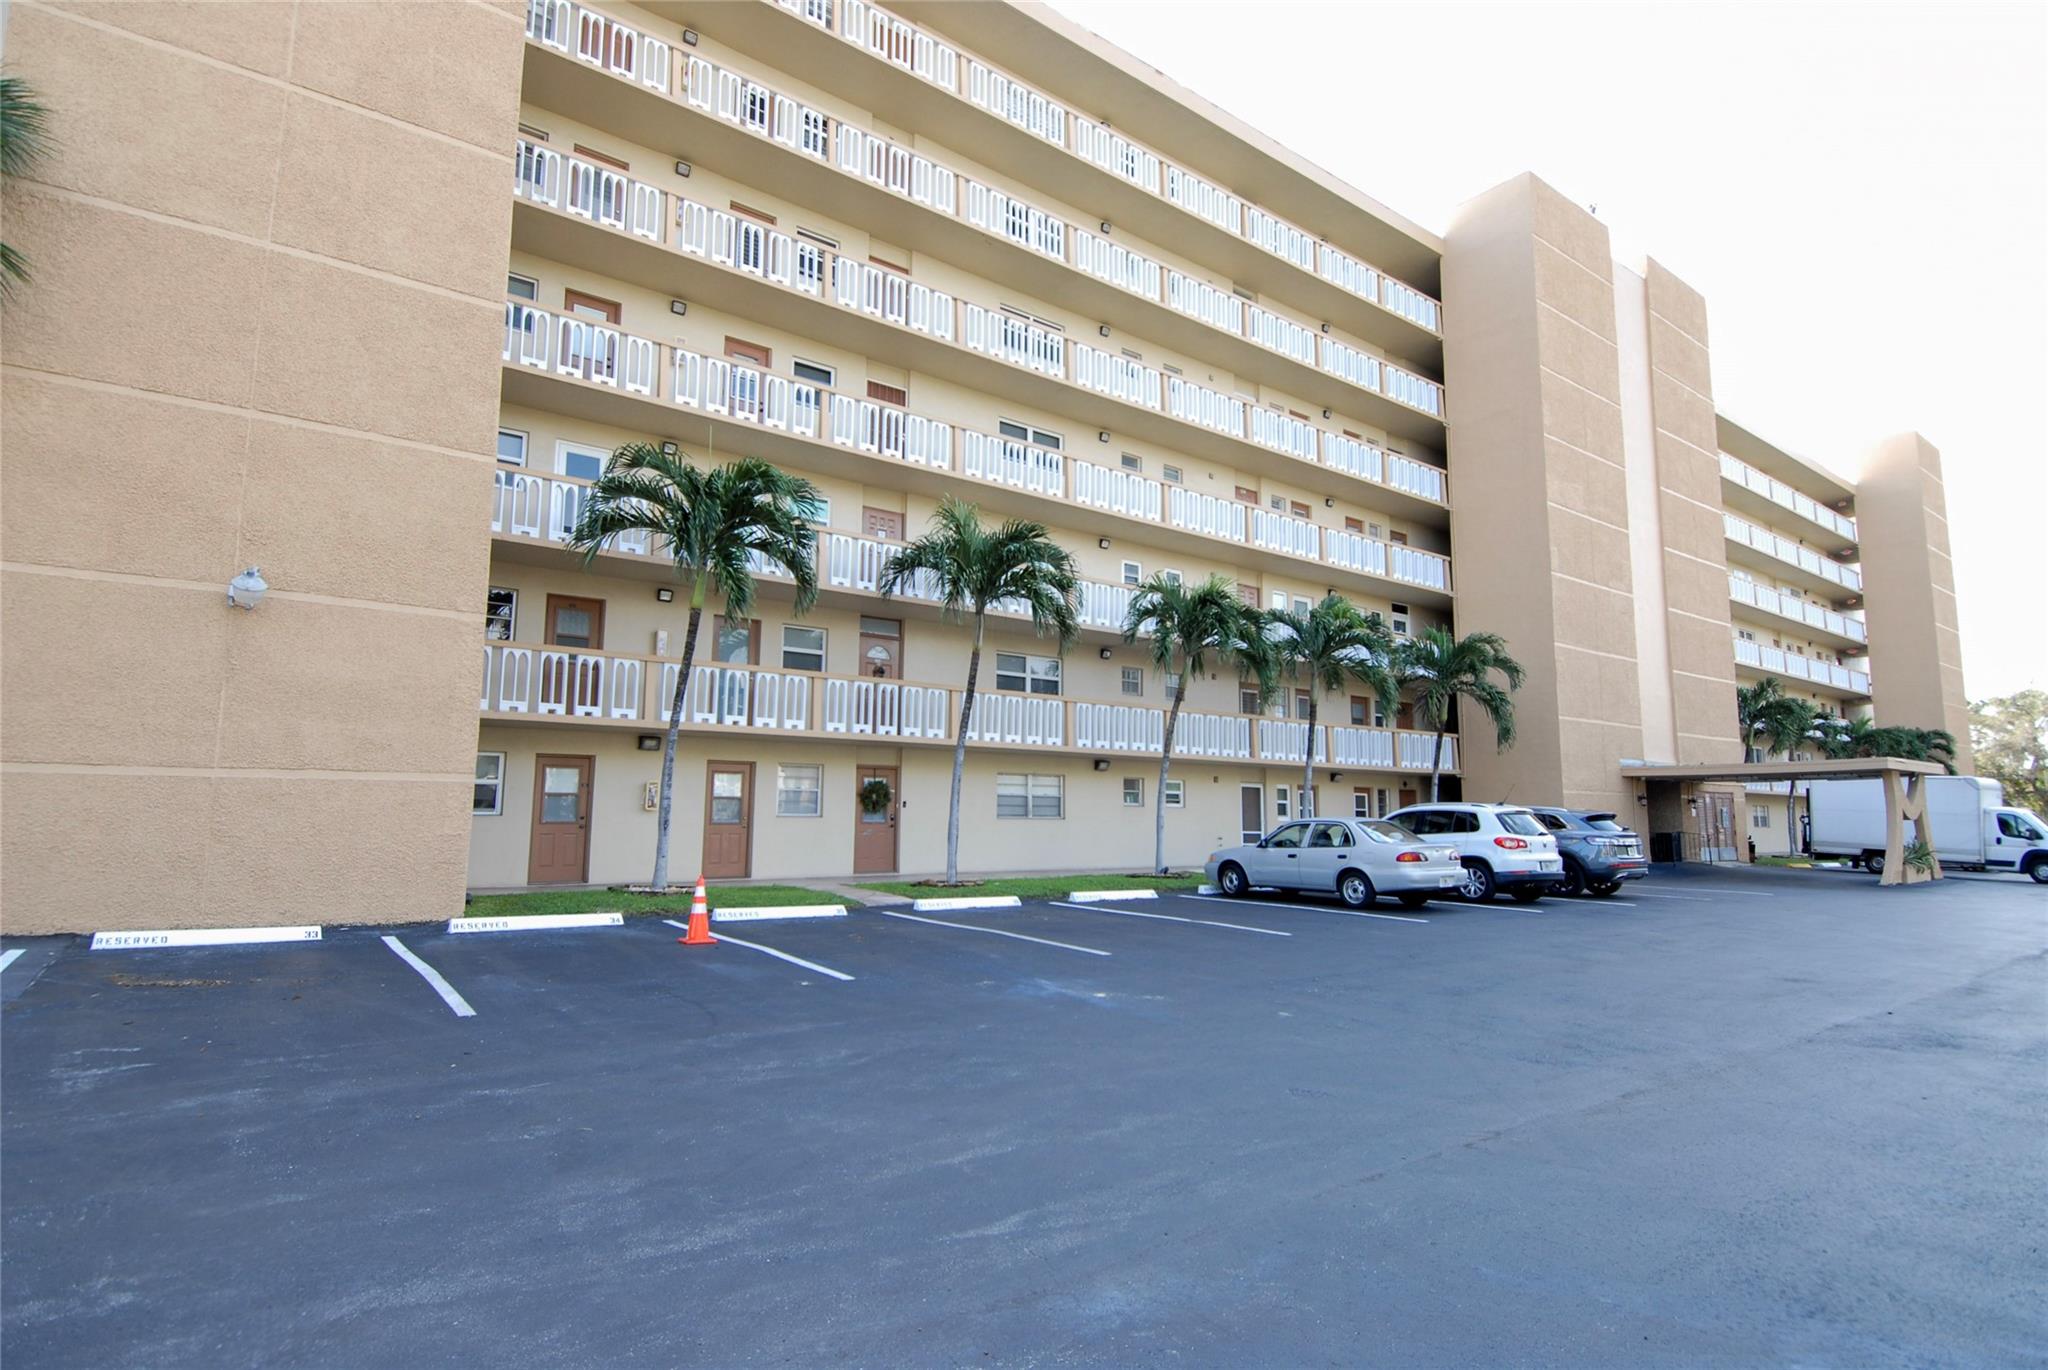
Active
$459,900
2
bds
|
2
ba
|
1,580
sqft
|
built
1980
2500 Parkview Dr, Hallandale Beach, FL 33009
$-1,889
Cash flow
-21.4%
Cash-on-Cash Return
1.2%
Cap rate
0.7%
Rent to Value Ratio
Active
$485,000
3
bds
|
2
ba
|
1,180
sqft
|
built
1970
1817 S Ocean Dr, Hallandale Beach, FL 33009
$-1,246
Cash flow
-13.4%
Cash-on-Cash Return
3.1%
Cap rate
0.8%
Rent to Value Ratio
Active
$150,000
1
bds
|
2
ba
|
847
sqft
|
built
1972
420 NE 12th Ave, Hallandale Beach, FL 33009
$-244
Cash flow
-8.5%
Cash-on-Cash Return
4.2%
Cap rate
1.2%
Rent to Value Ratio
Active
$269,000
2
bds
|
2
ba
|
1,092
sqft
|
built
1969
620 NE 12th Ave, Hallandale Beach, FL 33009
$-347
Cash flow
-6.7%
Cash-on-Cash Return
4.6%
Cap rate
0.9%
Rent to Value Ratio
Active
$317,000
2
bds
|
2
ba
|
1,040
sqft
|
built
1966
1450 Atlantic Shores Blvd, Hallandale Beach, FL 33009
$-975
Cash flow
-16.0%
Cash-on-Cash Return
2.5%
Cap rate
0.7%
Rent to Value Ratio
Active
$305,700
2
bds
|
2
ba
|
1,311
sqft
|
built
1971
137 Golden Isles Dr, Hallandale Beach, FL 33009
$-1,125
Cash flow
-19.2%
Cash-on-Cash Return
1.7%
Cap rate
0.8%
Rent to Value Ratio
Active
$225,000
1
bds
|
1
ba
|
672
sqft
|
built
1969
1825 S Ocean Dr, Hallandale Beach, FL 33009
$-561
Cash flow
-13.0%
Cash-on-Cash Return
3.2%
Cap rate
0.9%
Rent to Value Ratio

Active
$275,000
2
bds
|
2
ba
|
1,070
sqft
|
built
1966
200 NE 12th Ave, Hallandale Beach, FL 33009
$-526
Cash flow
-10.0%
Cash-on-Cash Return
3.9%
Cap rate
0.9%
Rent to Value Ratio
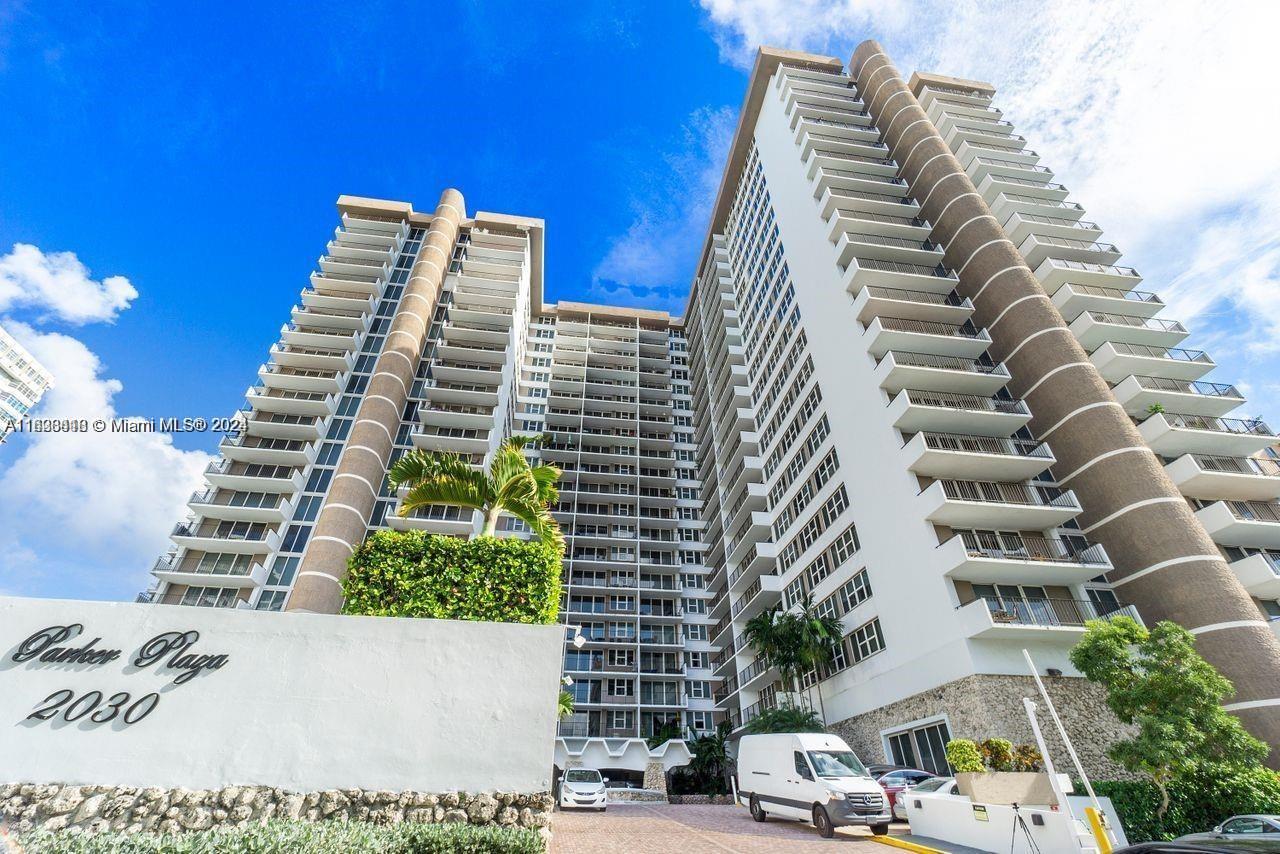
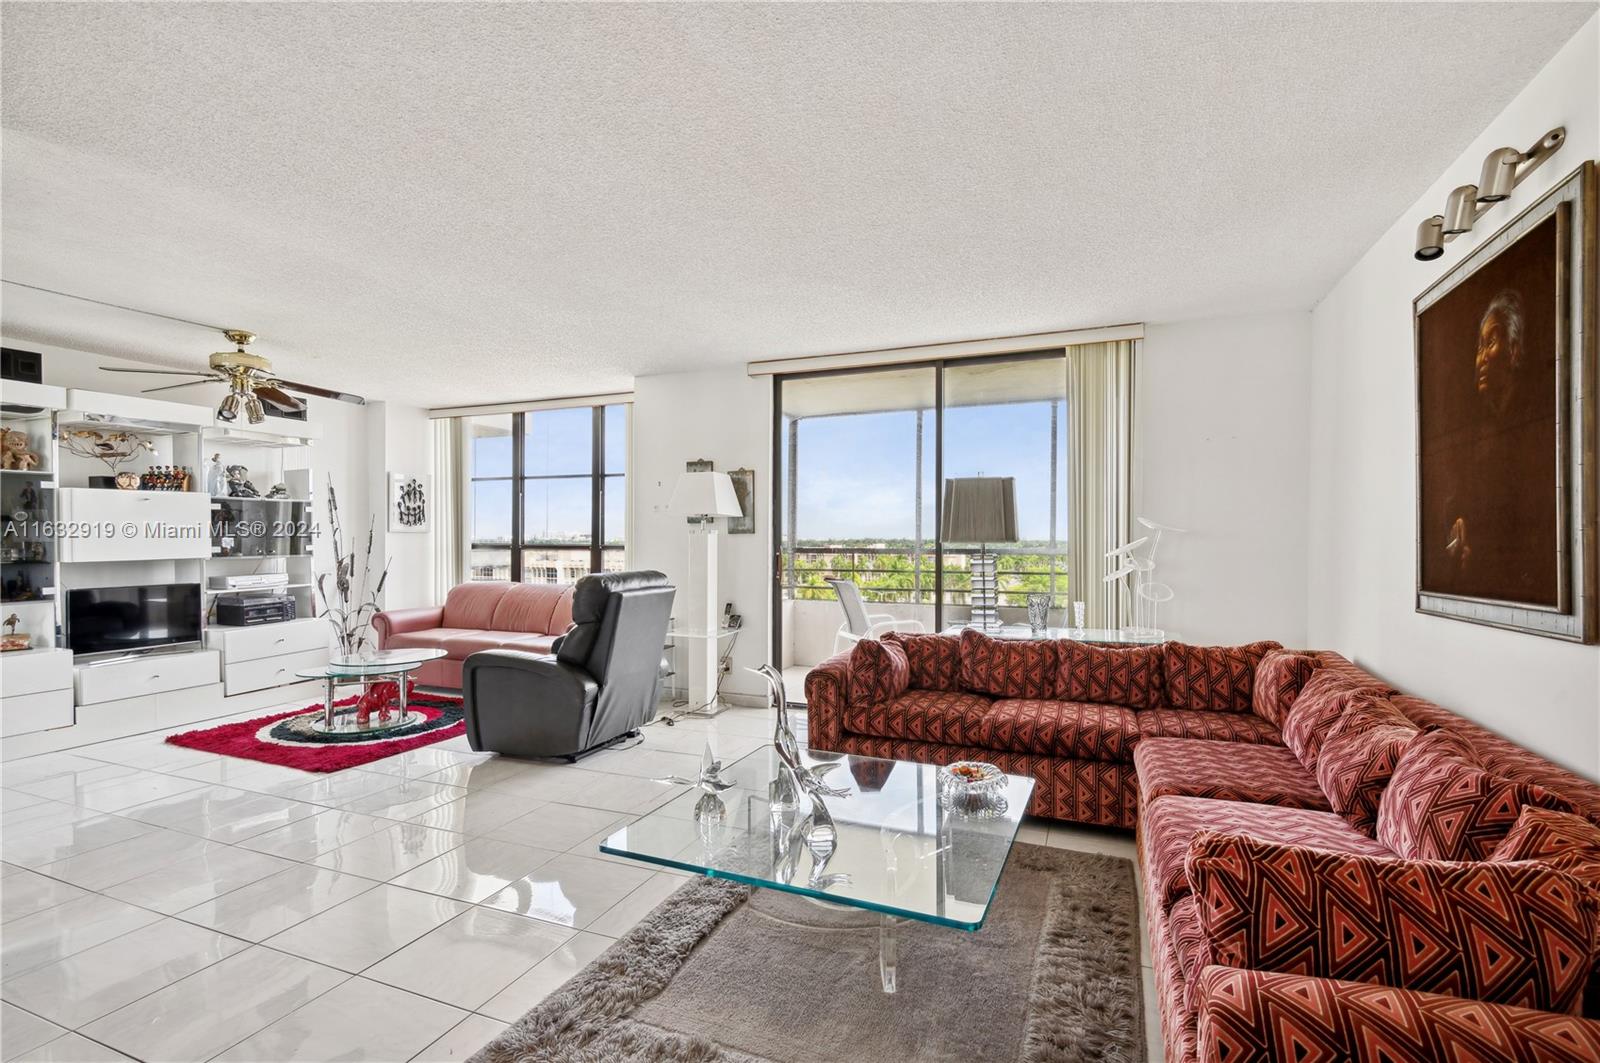
Active
$469,000
1
bds
|
1
ba
|
736
sqft
|
built
1970
2030 S Ocean Dr, Hallandale Beach, FL 33009
$-1,629
Cash flow
-18.1%
Cash-on-Cash Return
2.0%
Cap rate
0.7%
Rent to Value Ratio
Active
$288,000
2
bds
|
2
ba
|
1,400
sqft
|
built
1975
600 Three Islands Blvd, Hallandale Beach, FL 33009
$-621
Cash flow
-11.3%
Cash-on-Cash Return
3.6%
Cap rate
1.0%
Rent to Value Ratio
Active
$228,000
1
bds
|
1
ba
|
545
sqft
|
built
1970
1965 S Ocean Dr, Hallandale Beach, FL 33009
$-717
Cash flow
-16.4%
Cash-on-Cash Return
2.4%
Cap rate
0.9%
Rent to Value Ratio
Active
$269,000
2
bds
|
2
ba
|
1,259
sqft
|
built
1973
100 Golden Isles Dr, Hallandale Beach, FL 33009
$-830
Cash flow
-16.1%
Cash-on-Cash Return
2.4%
Cap rate
1.0%
Rent to Value Ratio
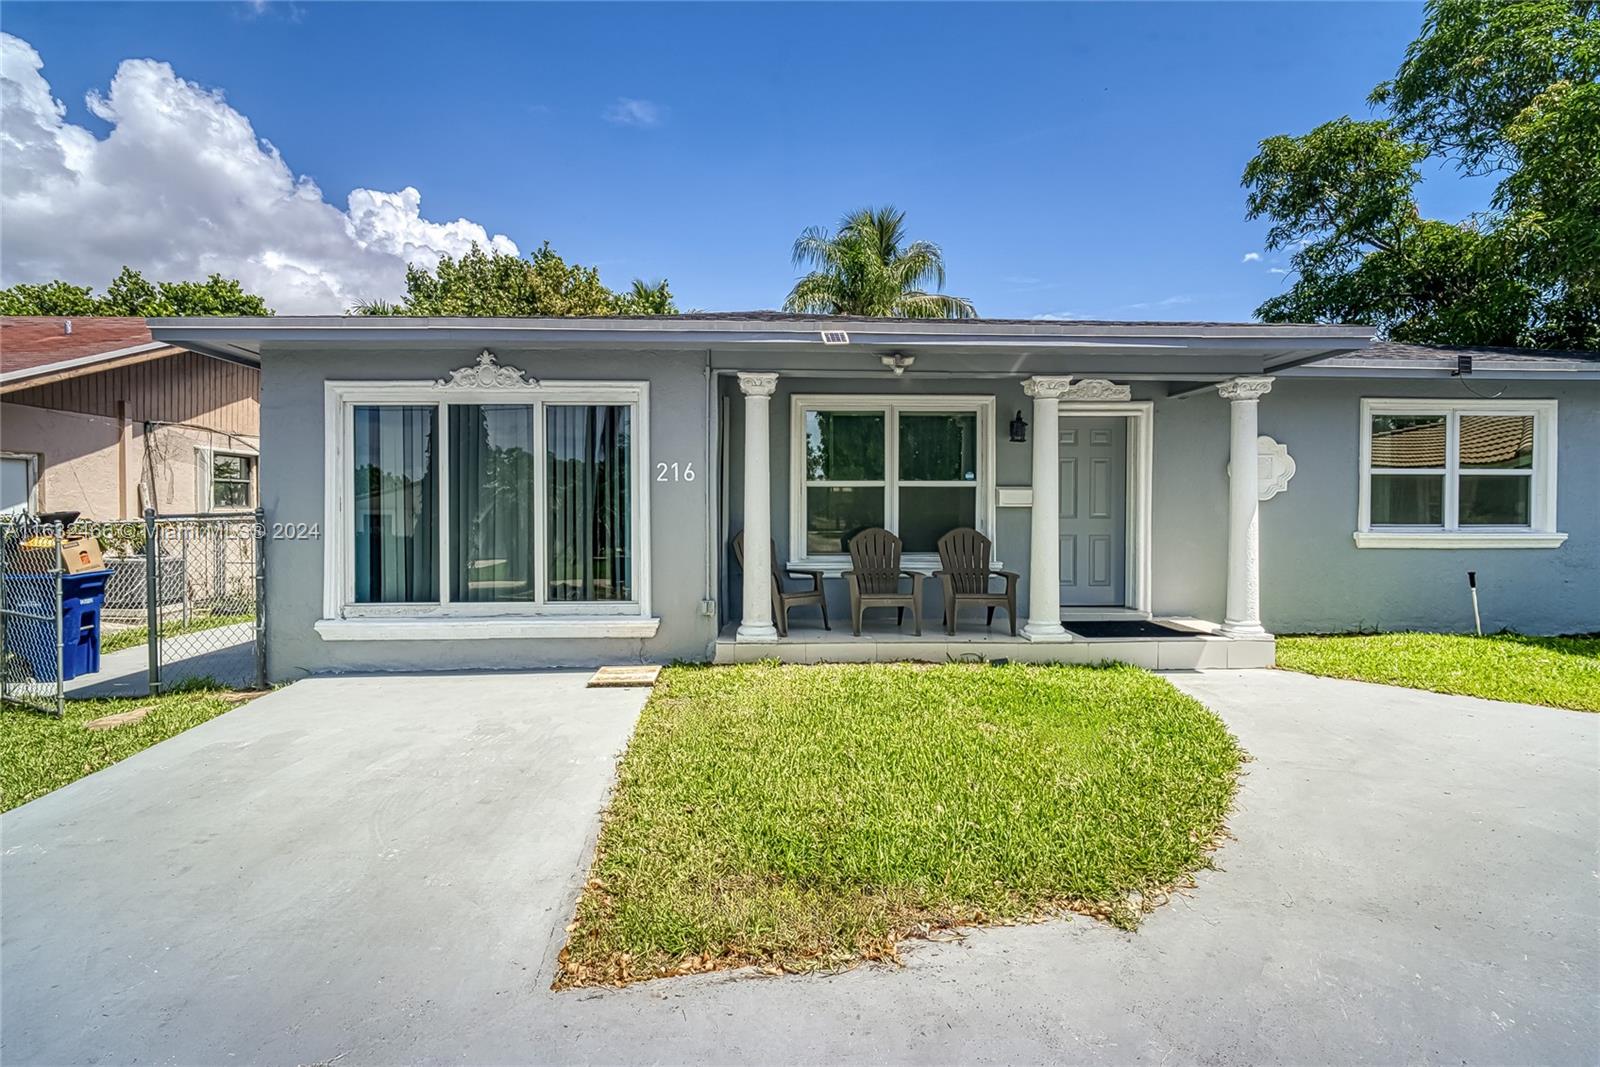
Active
$1,250,000
4
bds
|
2
ba
|
1,542
sqft
|
built
1954
216 SW 6th St, Hallandale Beach, FL 33009
$-2,814
Cash flow
-11.7%
Cash-on-Cash Return
3.4%
Cap rate
0.5%
Rent to Value Ratio

Active
$449,000
2
bds
|
2
ba
|
1,430
sqft
|
built
1978
800 Parkview Dr, Hallandale Beach, FL 33009
$-649
Cash flow
-7.5%
Cash-on-Cash Return
4.4%
Cap rate
0.7%
Rent to Value Ratio

Active
$820,000
2
bds
|
3
ba
|
1,220
sqft
|
built
2002
2080 S Ocean Dr, Hallandale Beach, FL 33009
$-3,722
Cash flow
-23.7%
Cash-on-Cash Return
0.7%
Cap rate
0.5%
Rent to Value Ratio

Active
$249,000
2
bds
|
2
ba
|
1,250
sqft
|
built
1968
111 Golden Isles Dr, Hallandale Beach, FL 33009
$-675
Cash flow
-14.1%
Cash-on-Cash Return
2.9%
Cap rate
1.0%
Rent to Value Ratio
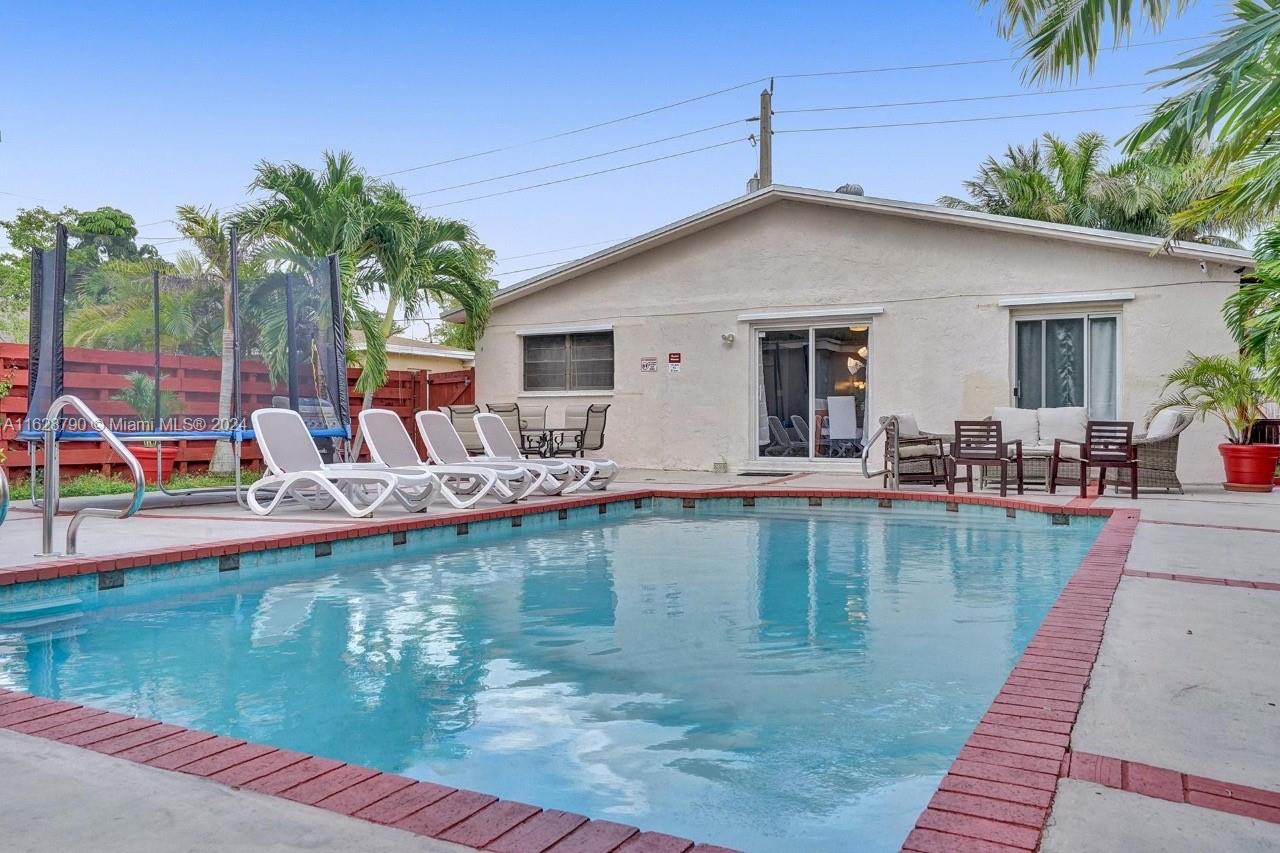
Active
$657,000
4
bds
|
2
ba
|
1,542
sqft
|
built
1979
208 SW 2nd Ave, Hallandale Beach, FL 33009
$-687
Cash flow
-5.5%
Cash-on-Cash Return
4.9%
Cap rate
0.8%
Rent to Value Ratio
Active
$439,500
2
bds
|
2
ba
|
1,400
sqft
|
built
1977
600 Three Islands Blvd, Hallandale Beach, FL 33009
$-1,710
Cash flow
-20.3%
Cash-on-Cash Return
1.5%
Cap rate
0.7%
Rent to Value Ratio

Active
$250,000
2
bds
|
2
ba
|
1,092
sqft
|
built
1968
219 NE 14th Ave, Hallandale Beach, FL 33009
$-438
Cash flow
-9.1%
Cash-on-Cash Return
4.0%
Cap rate
0.9%
Rent to Value Ratio
Active
$340,000
1
bds
|
1
ba
|
741
sqft
|
built
1972
3180 S Ocean Dr, Hallandale Beach, FL 33009
$-1,316
Cash flow
-20.2%
Cash-on-Cash Return
1.5%
Cap rate
0.7%
Rent to Value Ratio